 Threads

The GeForce RTX 4090 is the top variant of Nvidia’s latest RTX 40 series with 24GB memory and is currently the most powerful GPU in the world. On the other hand, the RX 6950 XT is the top-tier GPU of the AMD RX 6000 series featuring RDNA 2.0 architecture with 16GB memory. In this comparison of the RTX 4090 vs RX 6950 XT, I will reckon the two GPUs’ design specs and gaming prowess.
Key Takeaways
- In my gaming performance testing at 4K resolution, the RTX 4090 provides approximately 45% greater performance than the RX 6950 XT.
- According to my power consumption test, the RX 6950 XT exhibits about 30% greater power efficiency than the RTX 4090, thus saving energy.
- Based on the gaming temperatures I noted for two GPUs, the RTX 4090 has 12.4% higher thermal efficiency than the RX 6950 XT.
Comparison Table
| Feature | Nvidia GeForce RTX 4090 | AMD Radeon RX 6950 XT |
|---|---|---|
| Shading Units | 16384 CUDA Cores (CUDA Capability: 8.9) | 5120 Stream Processors |
| Ray Tracing Cores | 128 | 80 |
| ROPs | 176 | 128 |
| Base Clock | 2.23 GHz | 1.89 GHz |
| Boost Clock | 2.52 GHz | 2.31 GHz |
| Manufacturing Node | 5nm at TSMC | 7nm at TSMC |
| Standard Memory Config | 24GB GDDR6X | 16GB GDDR6 |
| Bandwidth | 1,008 GB/s | 576.0 GB/s |
| Memory Clock / Speed | 1313 MHz 21 Gbps effective | 2250 MHz 18 Gbps effective |
| GPU TDP | 450-watt | 335-watt |
| Maximum Temperature | 90°C | Up to 110°C |
| Launch Date | Sep 20th, 2022 | May 10th, 2022 |
| MSRP | $1599 | $1099 |
| Best Variants | BEST RTX 4090 Graphics Cards In 2023 | - |
Architectural Difference
- Architecture: The GeForce RTX 4090 employs Nvidia’s latest Ada Lovelace architecture, while the RX 6950 XT uses the company’s RDNA 2.0 design, the predecessor of AMD’s most recent RDNA 3.0 architecture.
- GPU Chip: The RX 6950 XT employs the AMD Navi 21 chip, whereas the RTX 4090 employs the features of Nvidia’s AD102 GPU chip. The cutting-edge AD102 chip crafted on a futuristic 5nm technology demonstrates revolutionary enhancements.
- Clock Speed: Regarding clock speed, the RTX 4090’s base clock is around 18% faster, and its boost clock is about 9.1% faster than the RX 6950 XT’s turbo clock.
- VRAM: The RTX 4090 features 384-bit 24GB GDDR6X memory with a bandwidth of 1,008 GB/s, whereas the RX 6950 XT has 256-bit 16GB GDDR6 memory and a bandwidth of only 576.0 GB/s. Moreover, the RTX 4090’s memory speed is 16.7% or 3Gbps faster than the RX 6950 XT.
- Advanced Technologies: The RTX 4090 showcases Nvidia’s cutting-edge DLSS 3.0, pitted against the AMD FidelityFX Super Resolution 2.0 employed by the RX 6950 XT. For more details, read Nvidia DLSS vs AMD FSR.
Gaming Benchmarks
When evaluating the performance of a graphics card, its gaming capabilities are considered the most reliable metric. I will assess the performance and efficiency of the RTX 4090 vs RX 6950 XT by analyzing their capabilities in 10 graphically taxing games I played at 4K resolution.
Gaming Rig
The setup I used to play these games had the following specs.
- OS: Windows 10 Pro
- CPU: Intel Core i9-12900K
- Motherboard: MSI MPG Z690 Force
- RAM: XPG Lancer 32GB (2 x 16GB) 288-Pin PC RAM DDR5 5200 MHz
- Storage: XPG GAMMIX S70 BLADE 2TB NVMe
- CPU Cooler: be quiet! Dark Rock Pro 4
- Power Supply: ENERMAX Revolution DFX ATX 3.0
Counter-Strike: Global Offensive
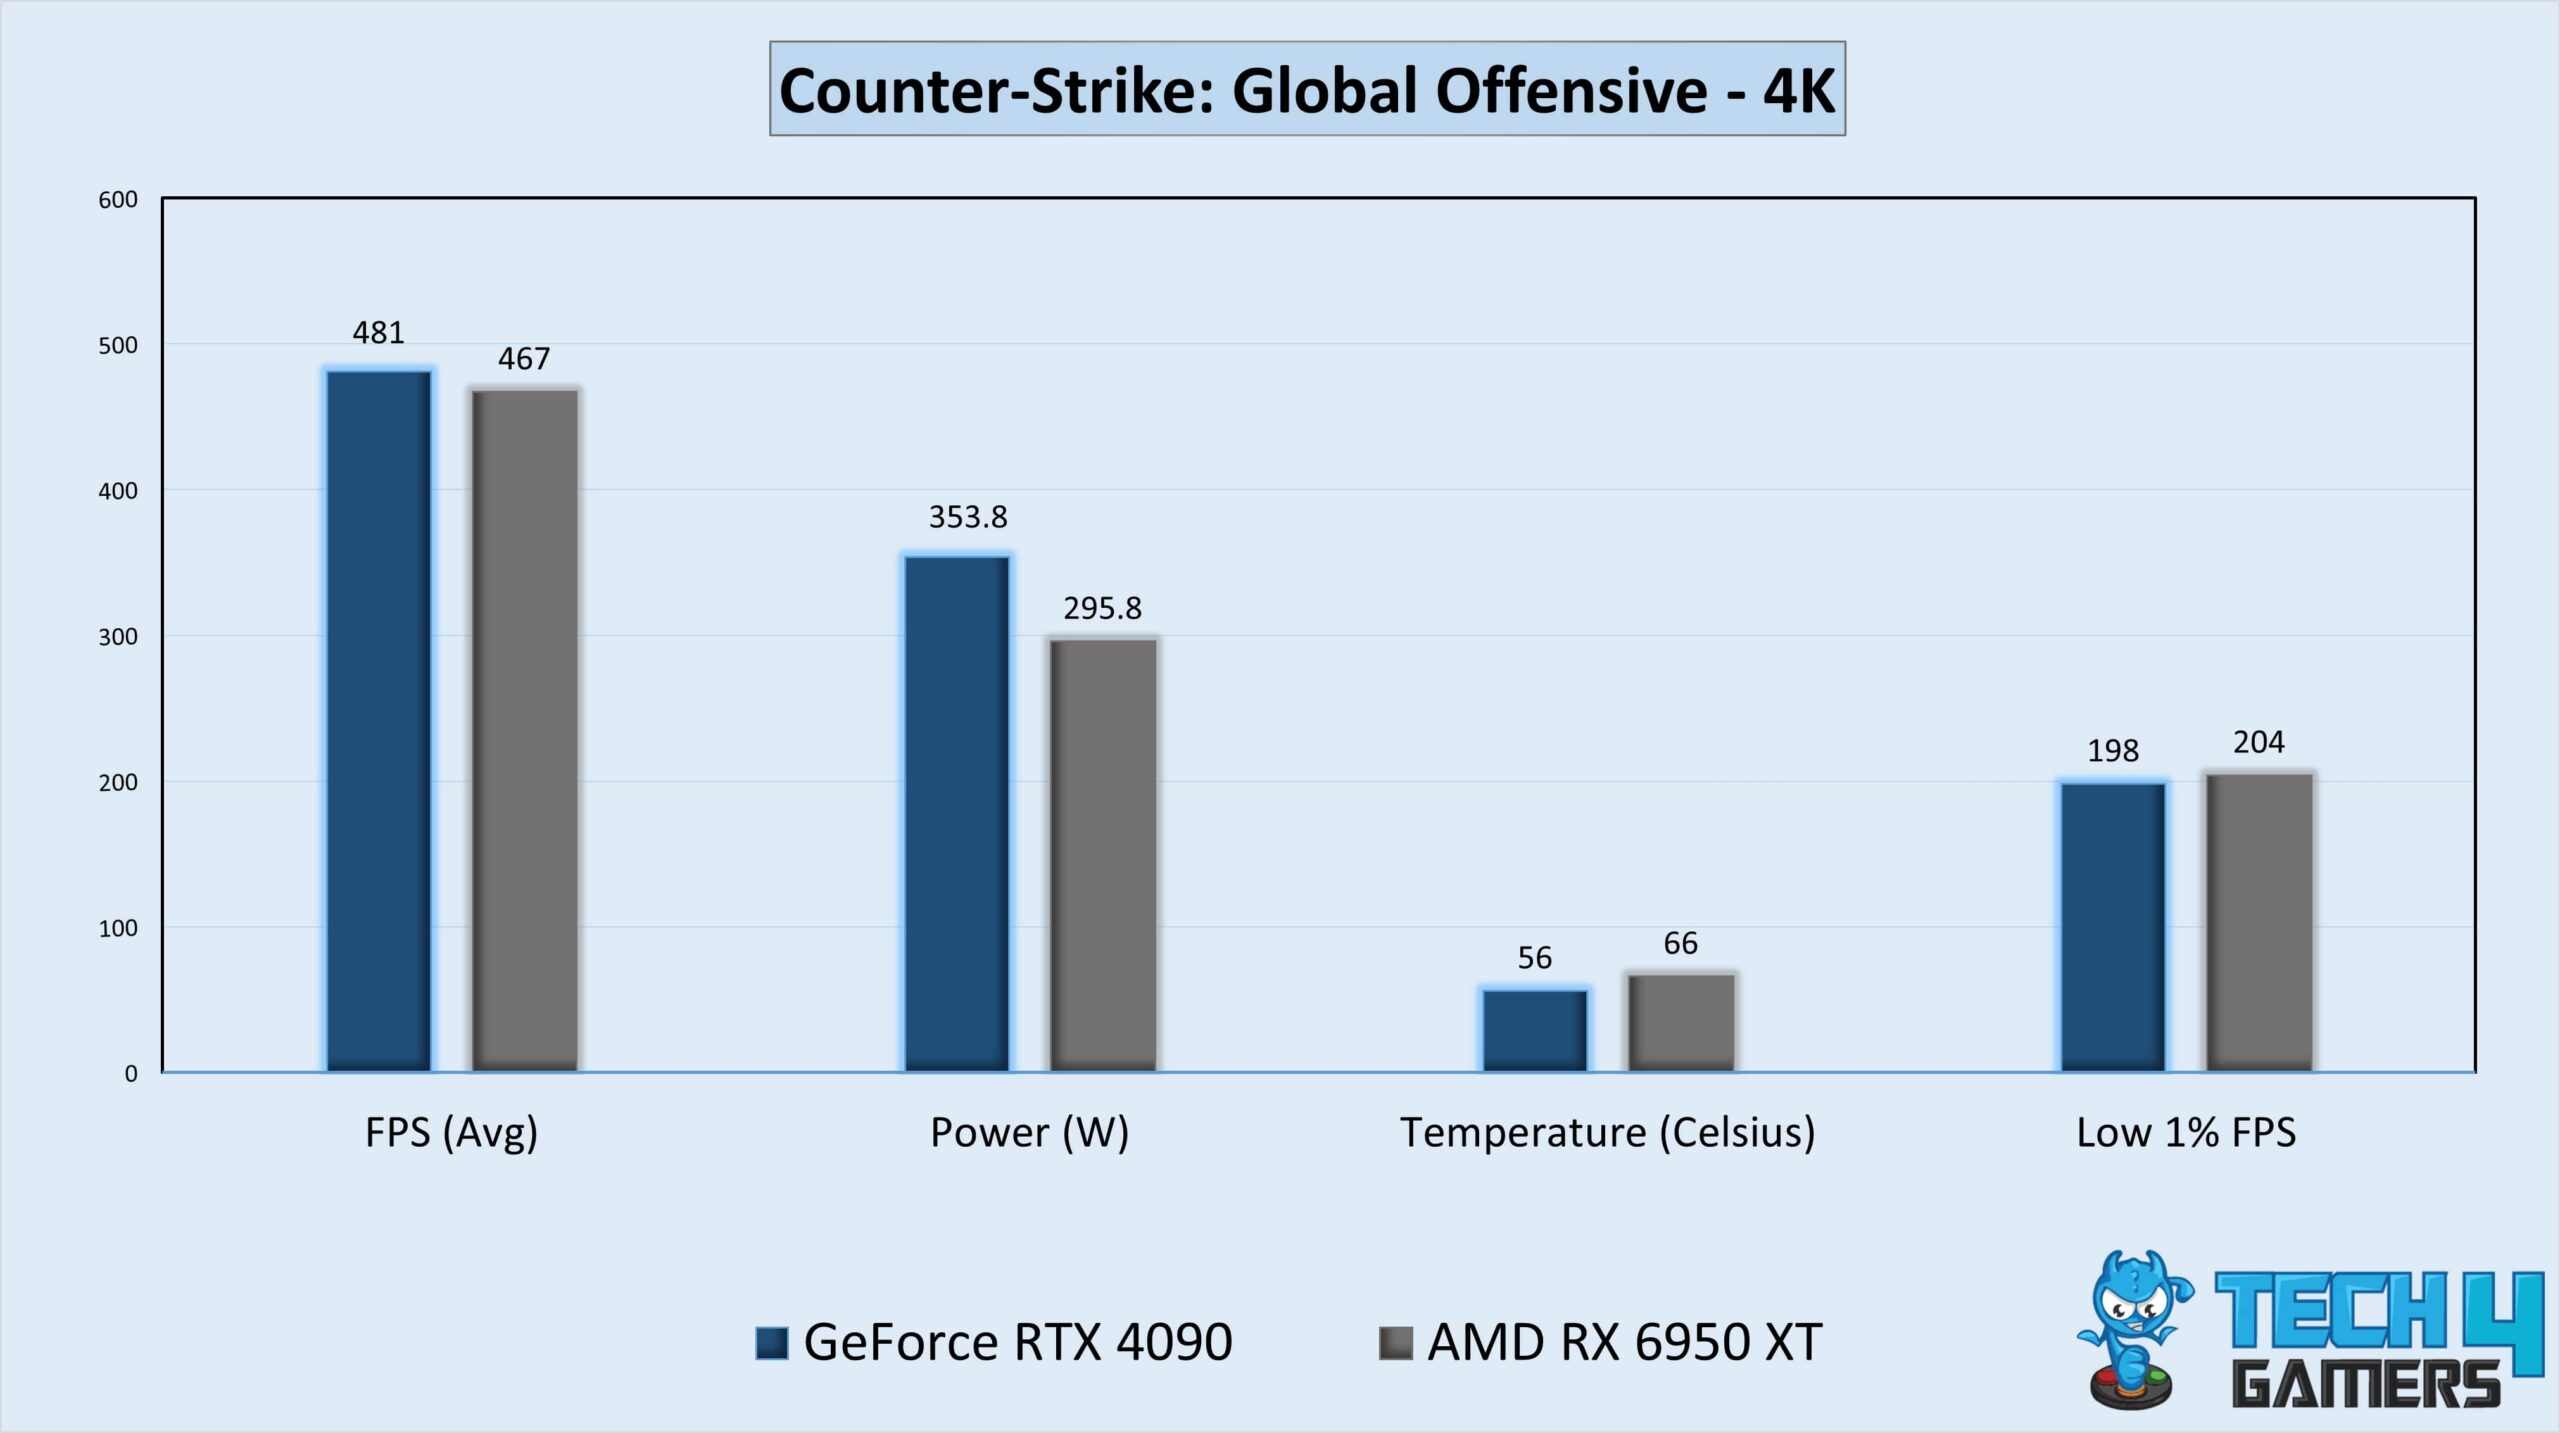
- In my first Counter-Strike: Global Offensive gameplay, the RTX 4090 established a 3% or 14 FPS performance lead over the RX 6950 XT. The RTX 4090 produced an average of 481 FPS at 4K, while the RX 6950 XT delivered 467 FPS on average.
- As for the low 1% frame rate, the RTX 4090 delivered 198 FPS, while the RX 6950 XT provided 204 FPS.
Cyberpunk 2077
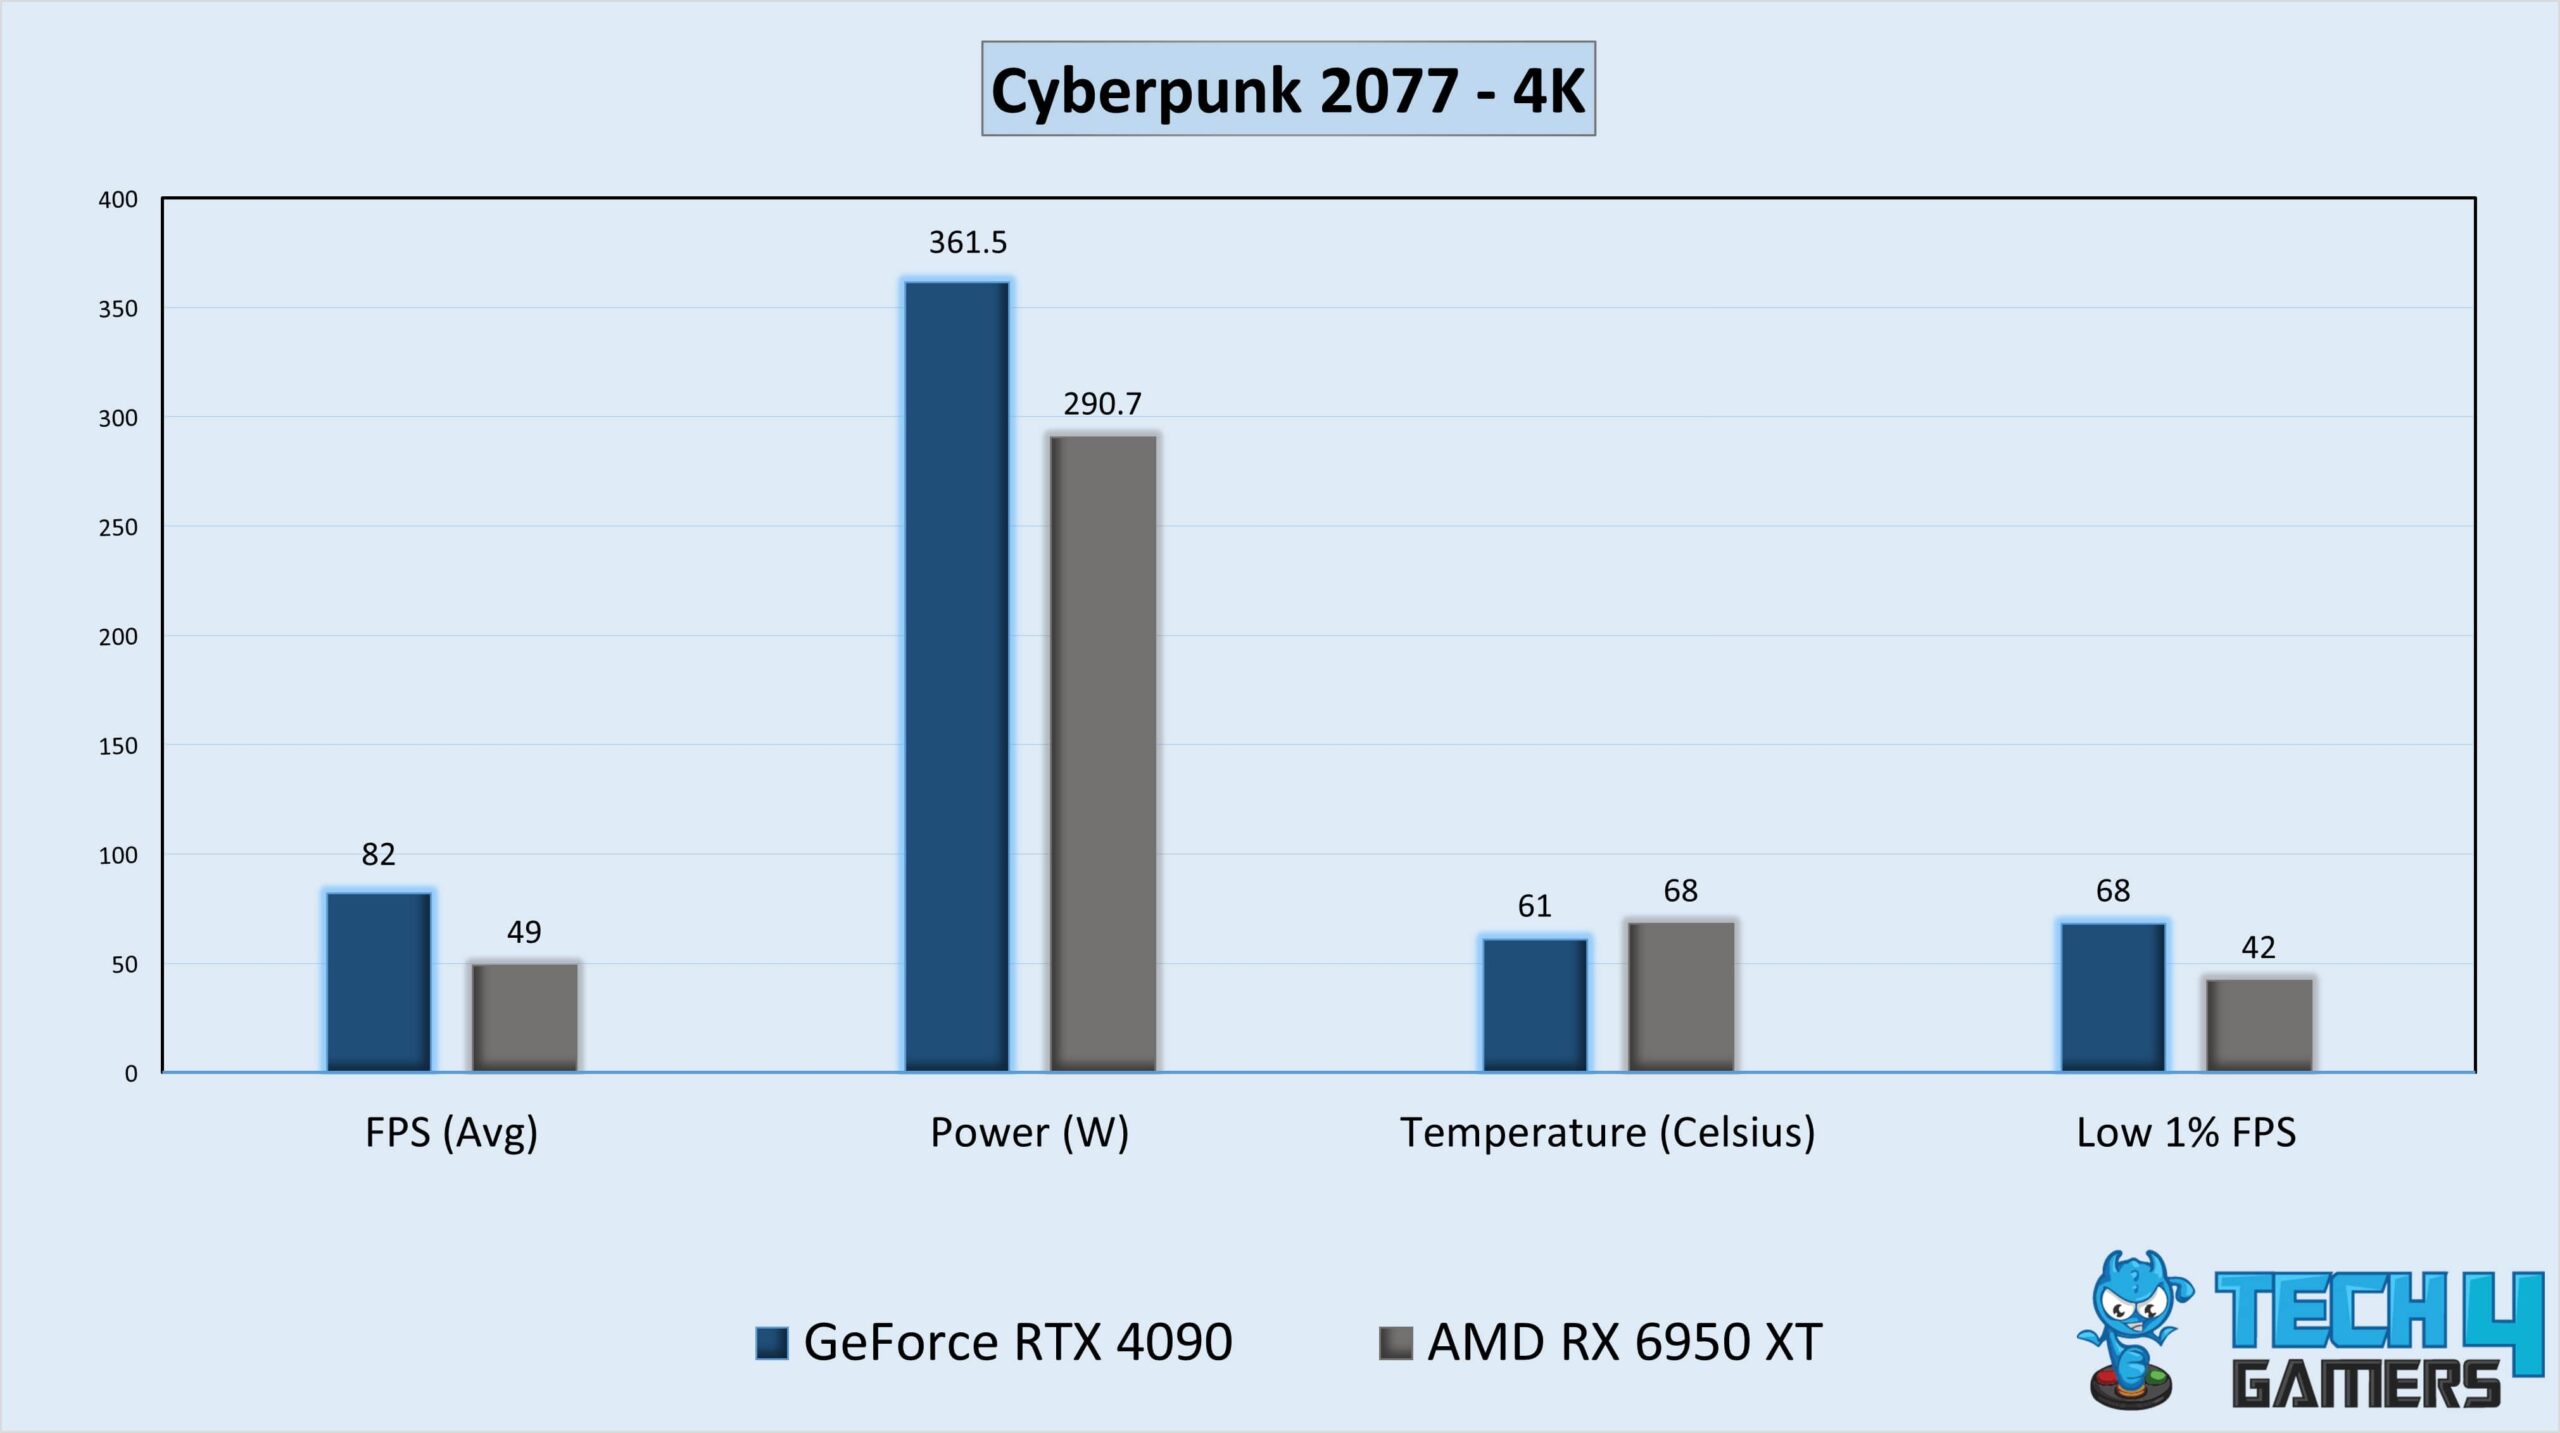
- During my gameplay of Cyberpunk 2077, the RTX 4090 provided a performance advantage of roughly 67.3% over the RX 6950 XT. On average, the RTX 4090 generated a frame rate of 82 FPS, whereas the RX 6950 XT produced 49 FPS.
- In the worst 1% performance time, the RTX 4090 bore an impressive frame rate of 68 FPS, while the RX 6950 XT only produced 42 FPS.
Forza Horizon 5
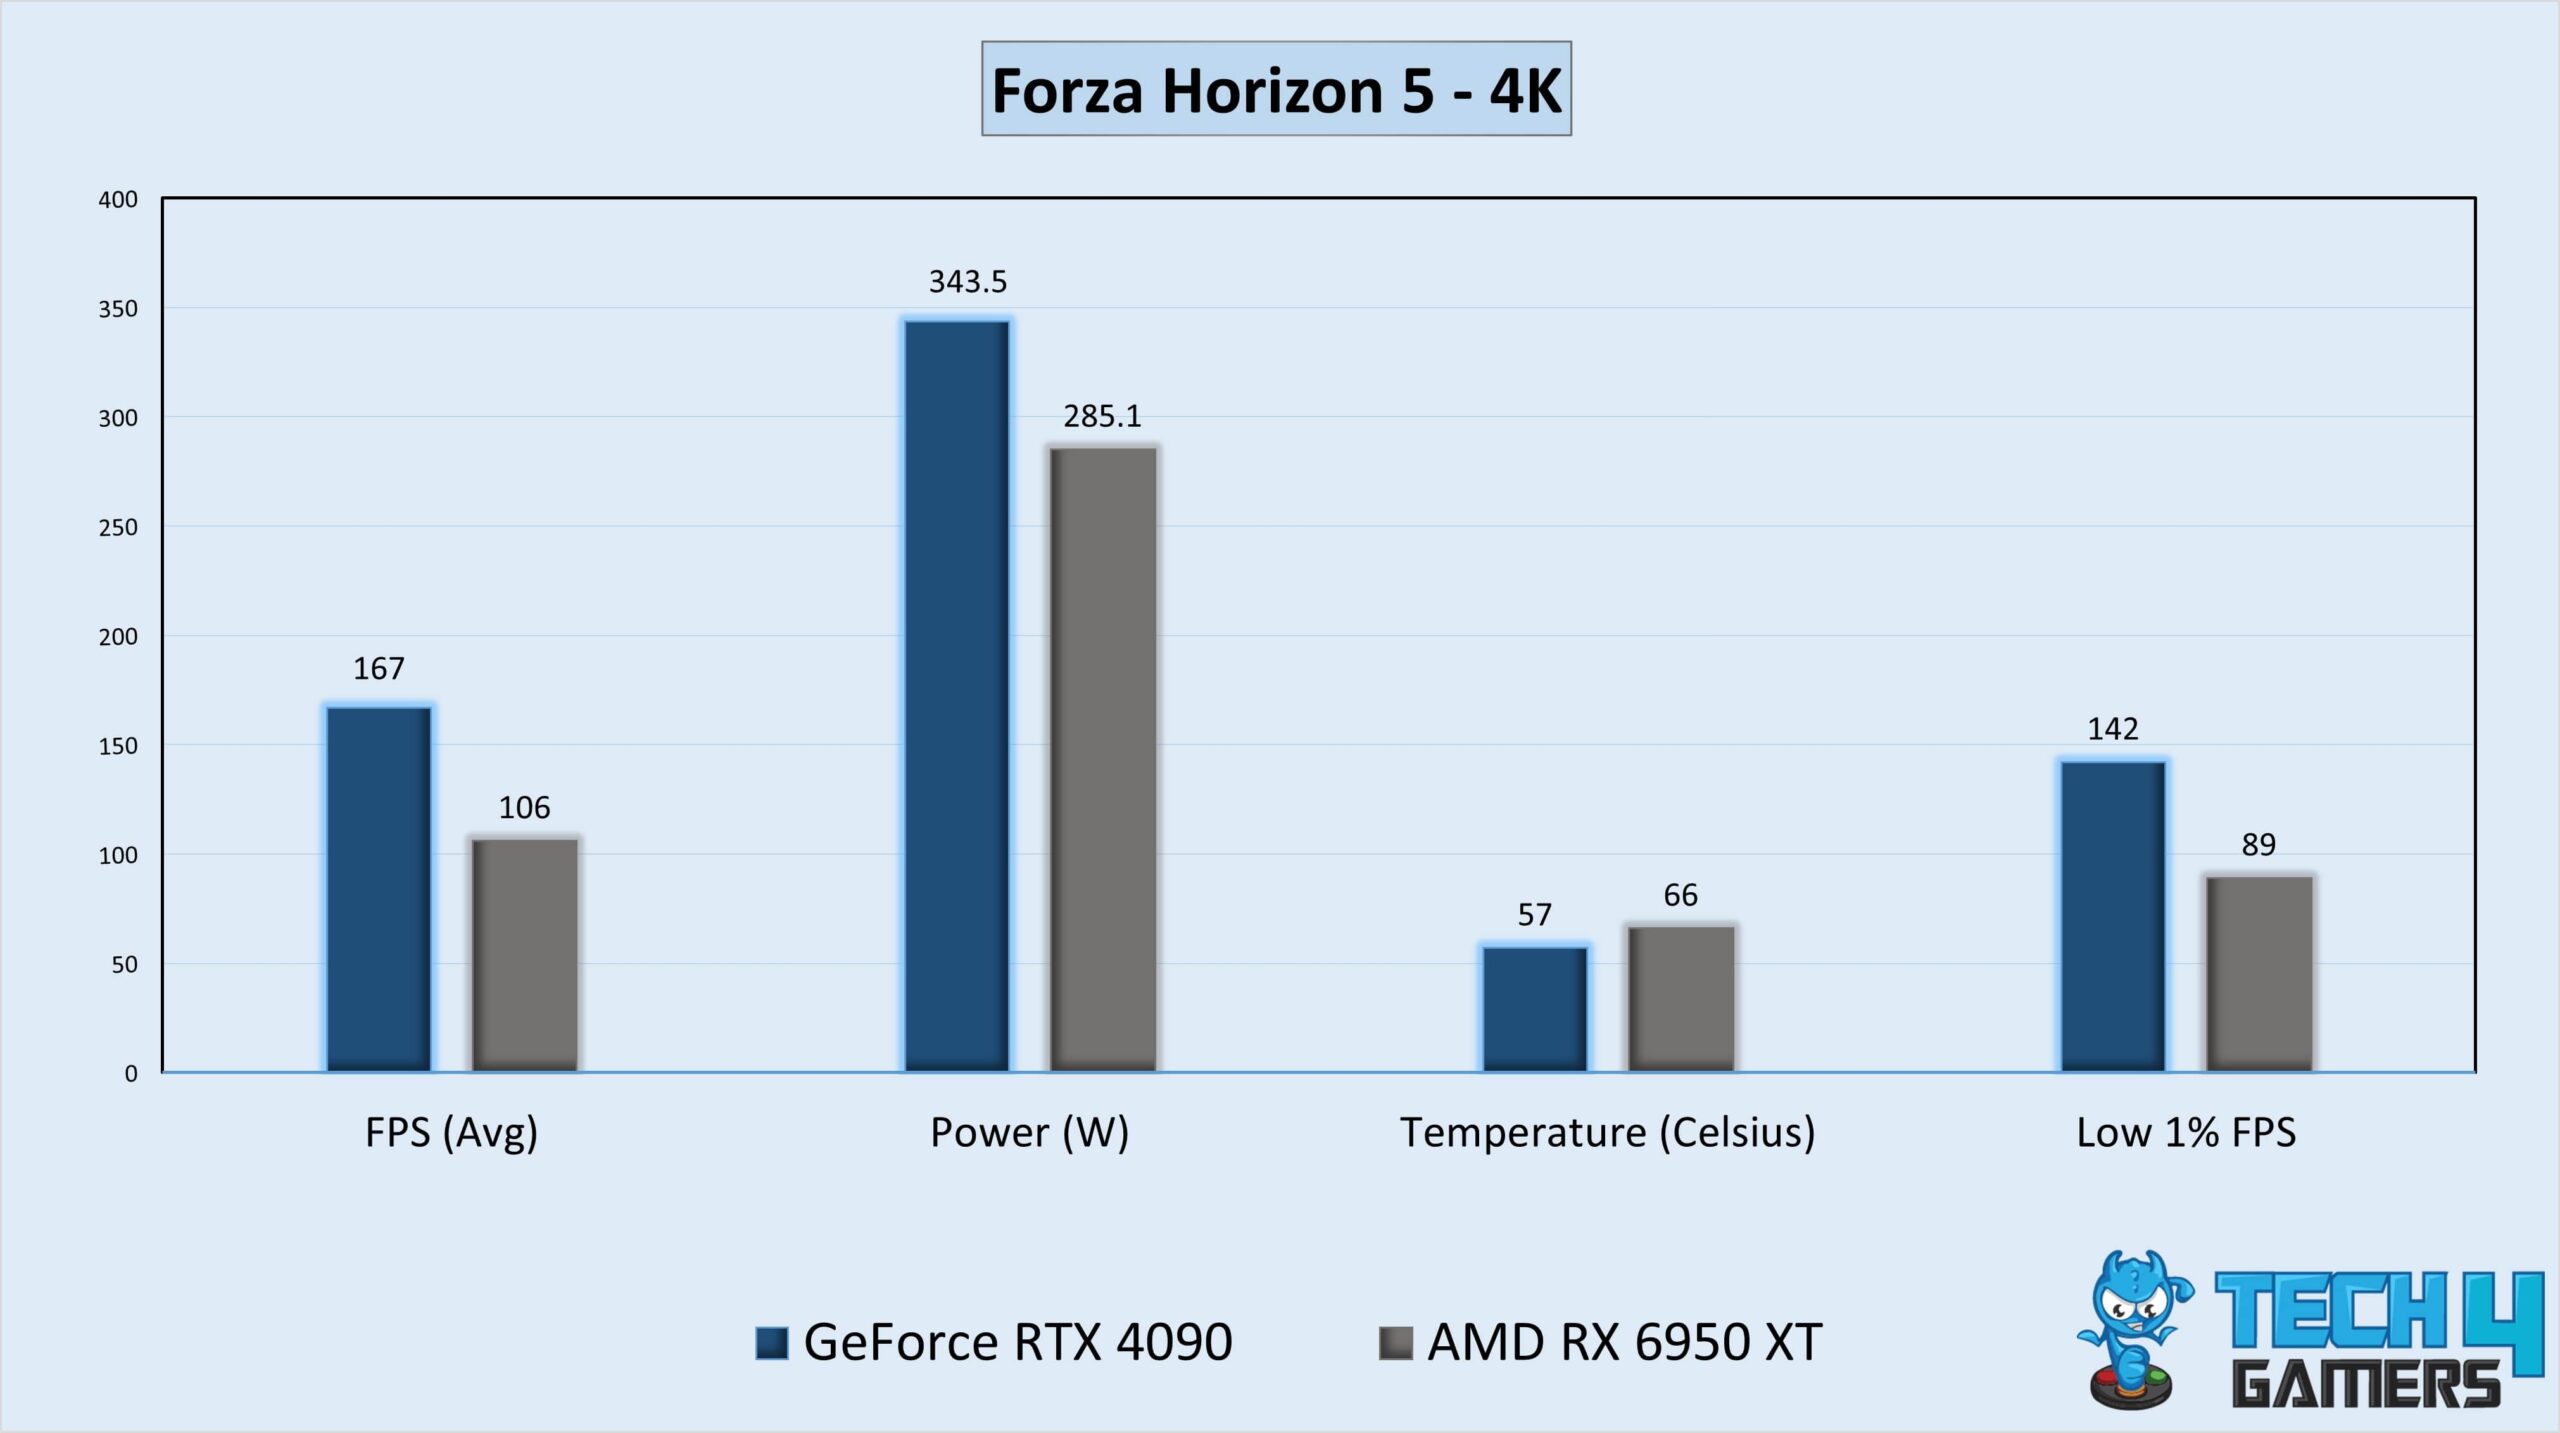
- In my testing of Forza Horizon 5, the RTX 4090 outperformed the RX 6950 XT with an upper hand of about 57.5%. The RX 6950 XT achieved an average frame rate of 106 FPS, compared to the RTX 4090’s a higher 167 FPS average.
- For the low 1% frame rate, the RTX 4090 surpassed the RX 6950 XT by a margin of 53 frames per second.
God Of War
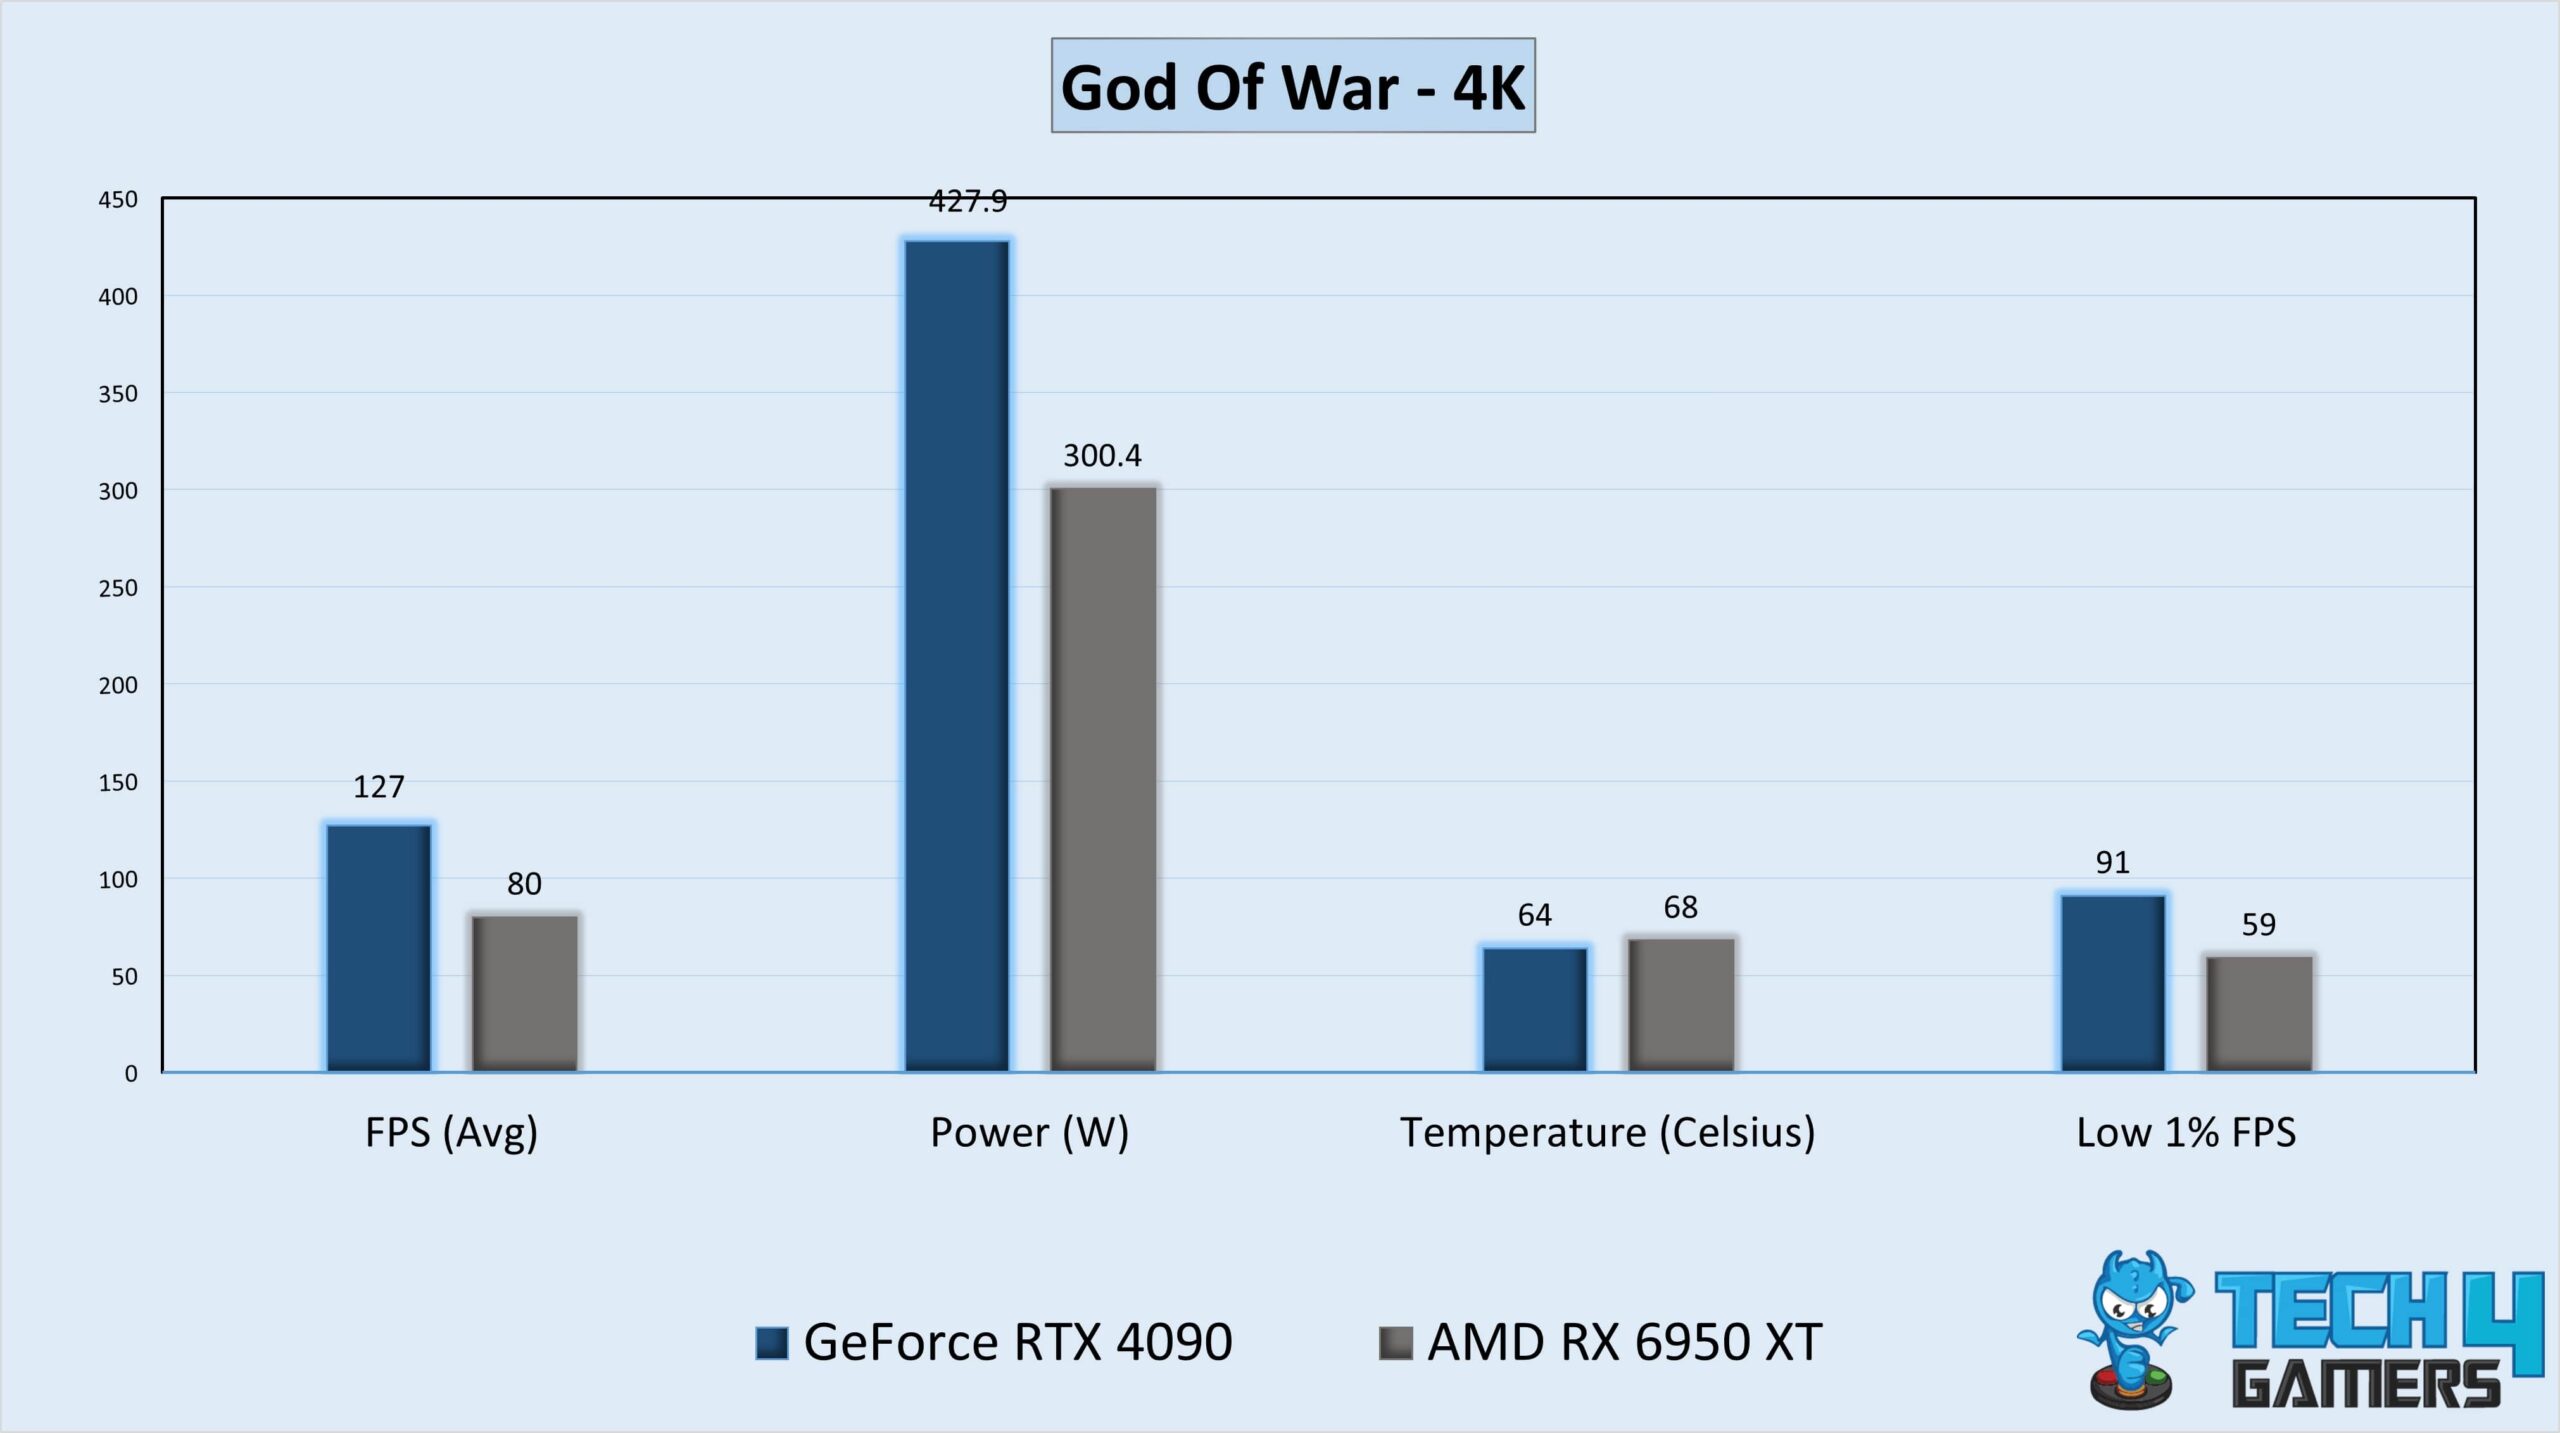
- While playing God of War, I noted that the RTX 4090 exhibited an edge in performance of around 58.8% compared to the RX 6950 XT. Contrary to the RTX 4090’s brilliant frame rate of 127 FPS, the RX 6950 XT could only produce 80 FPS.
- Regarding the low 1% frame rate, the RTX 4090 produced 91 FPS, while the RX 6950 XT produced 59 FPS.
Hitman 3
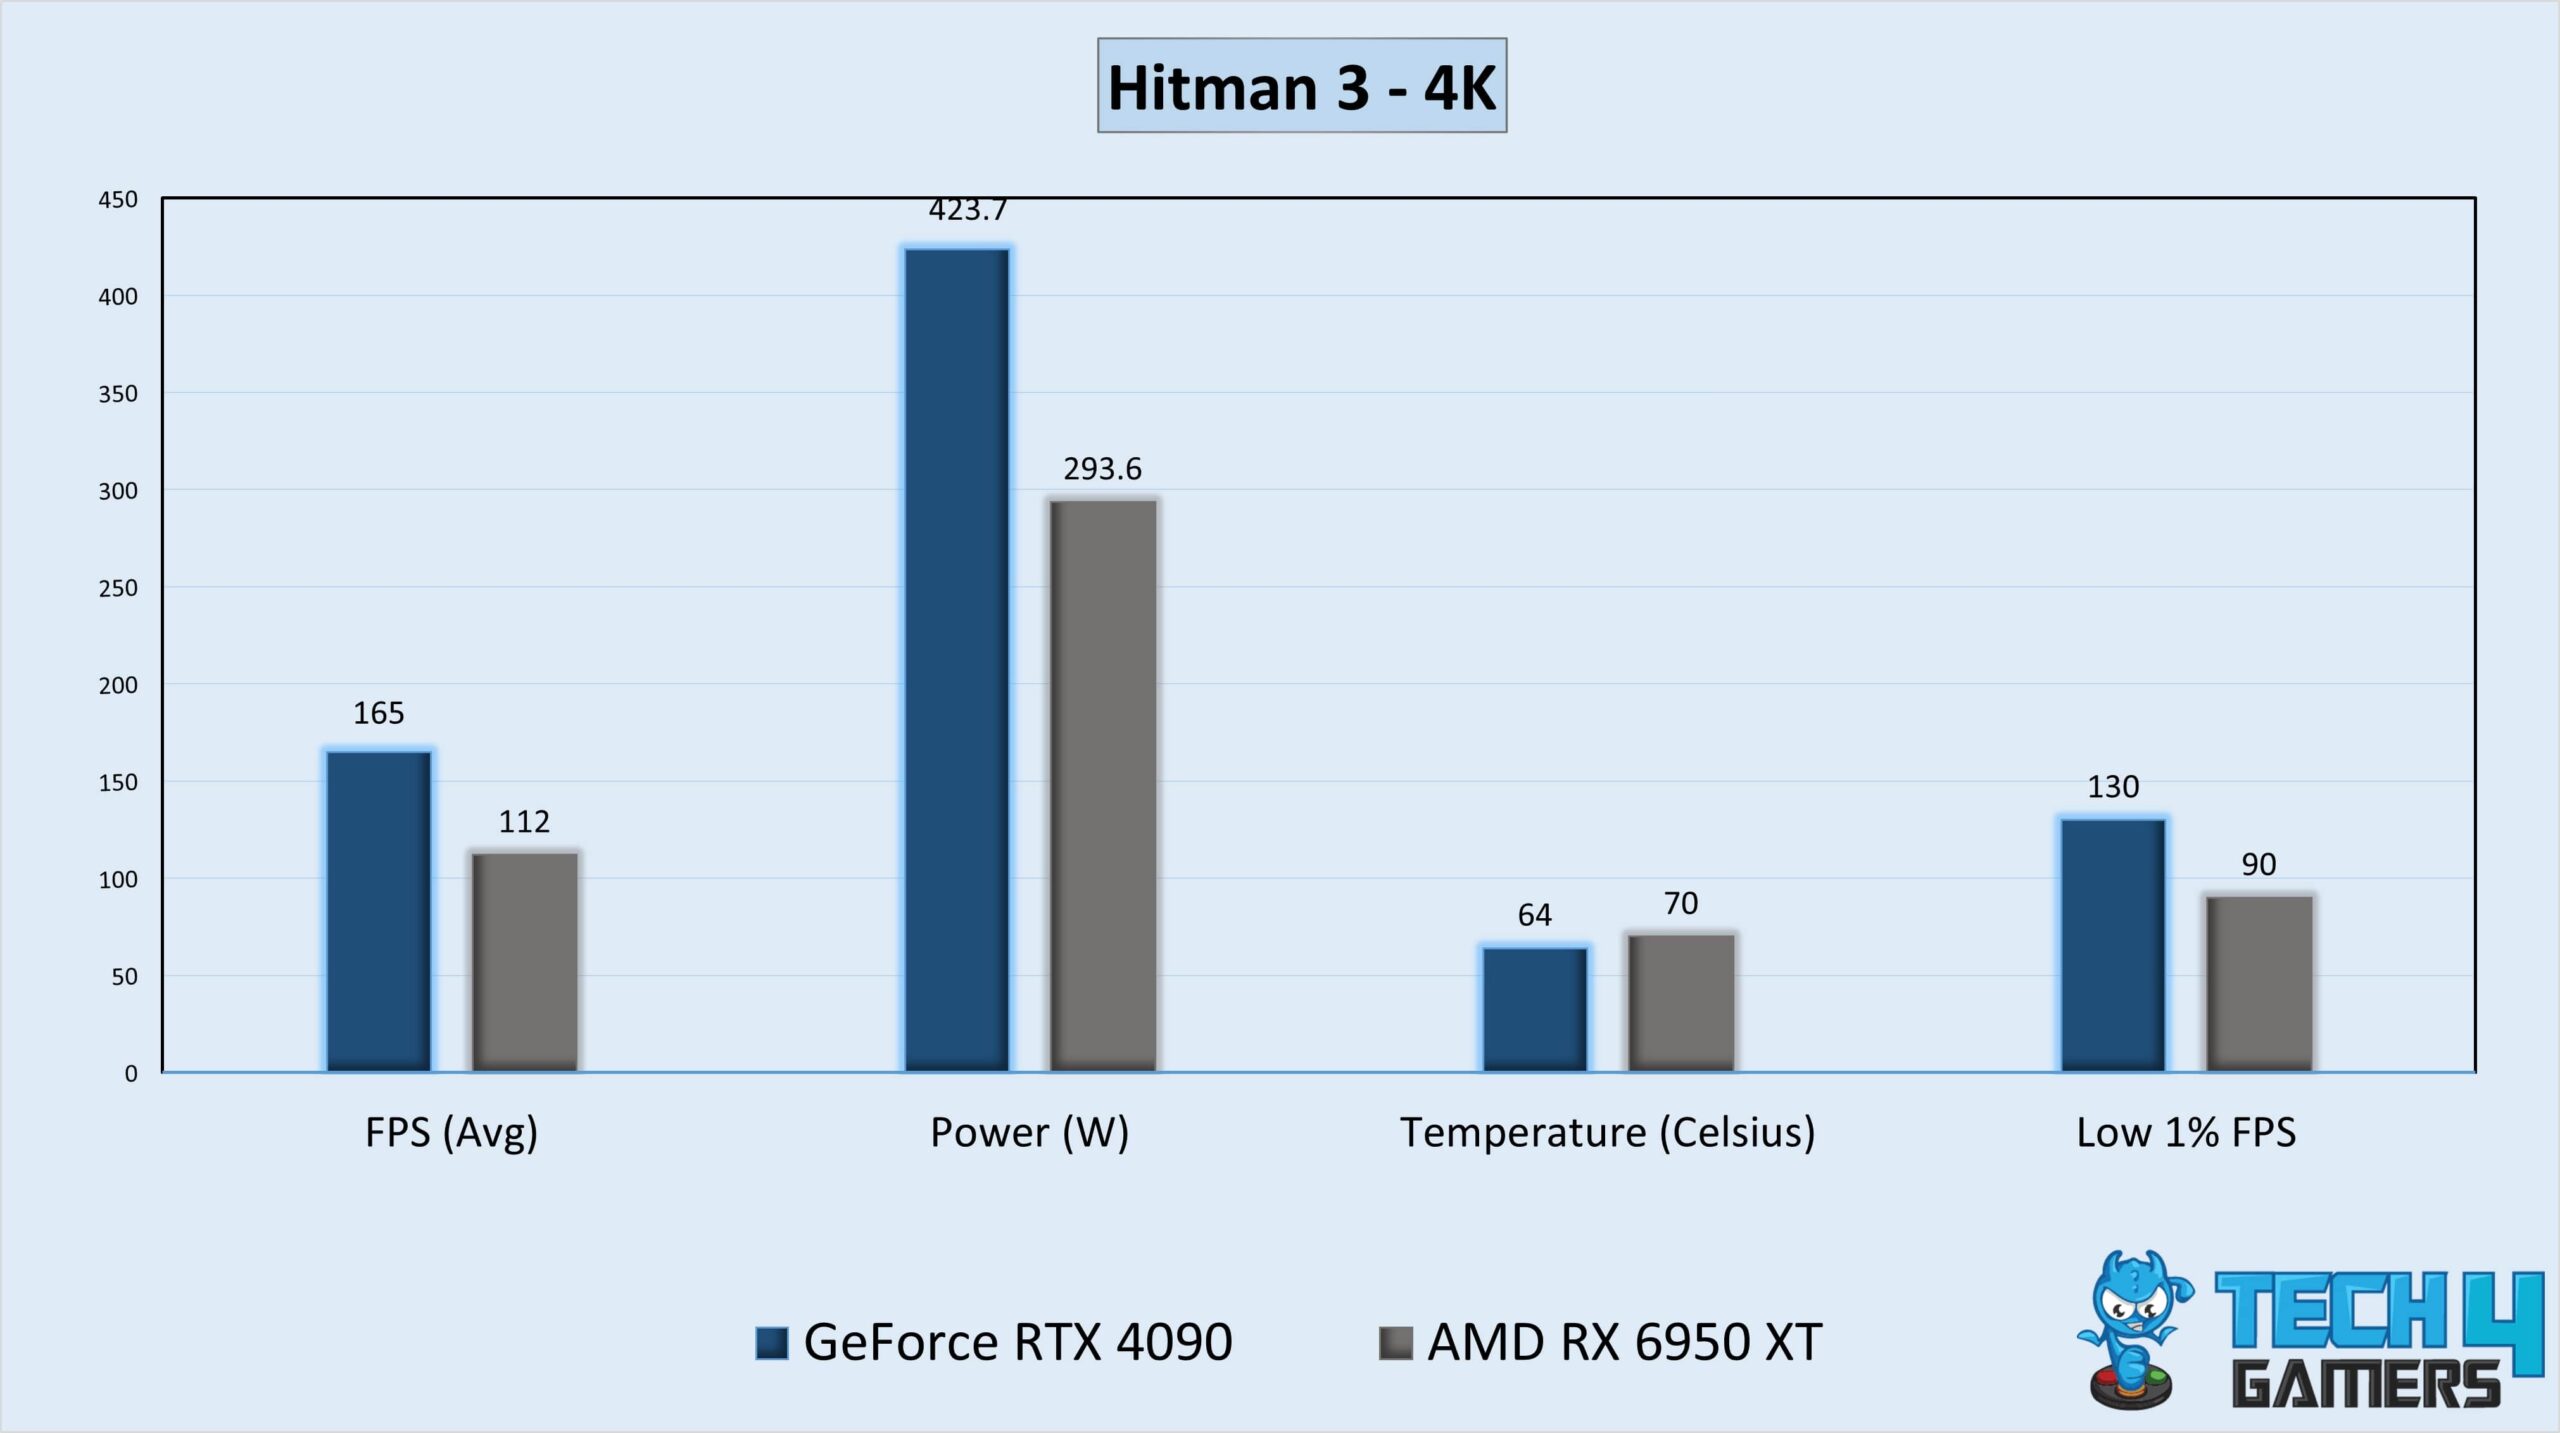
- During my session of Hitman 3, the RTX 4090 surpassed the RX 6950 XT by a substantial performance margin of approximately 47.3%. The RTX 4090 provided a sharp 165 FPS, while the RX 6950 XT could only muster up 112 FPS.
- Considering the low 1% frame rate in Hitman 3, the RTX 4090 submitted 130 frames per second, whereas the RX 6950 XT produced 90 FPS.
Horizon Zero Dawn
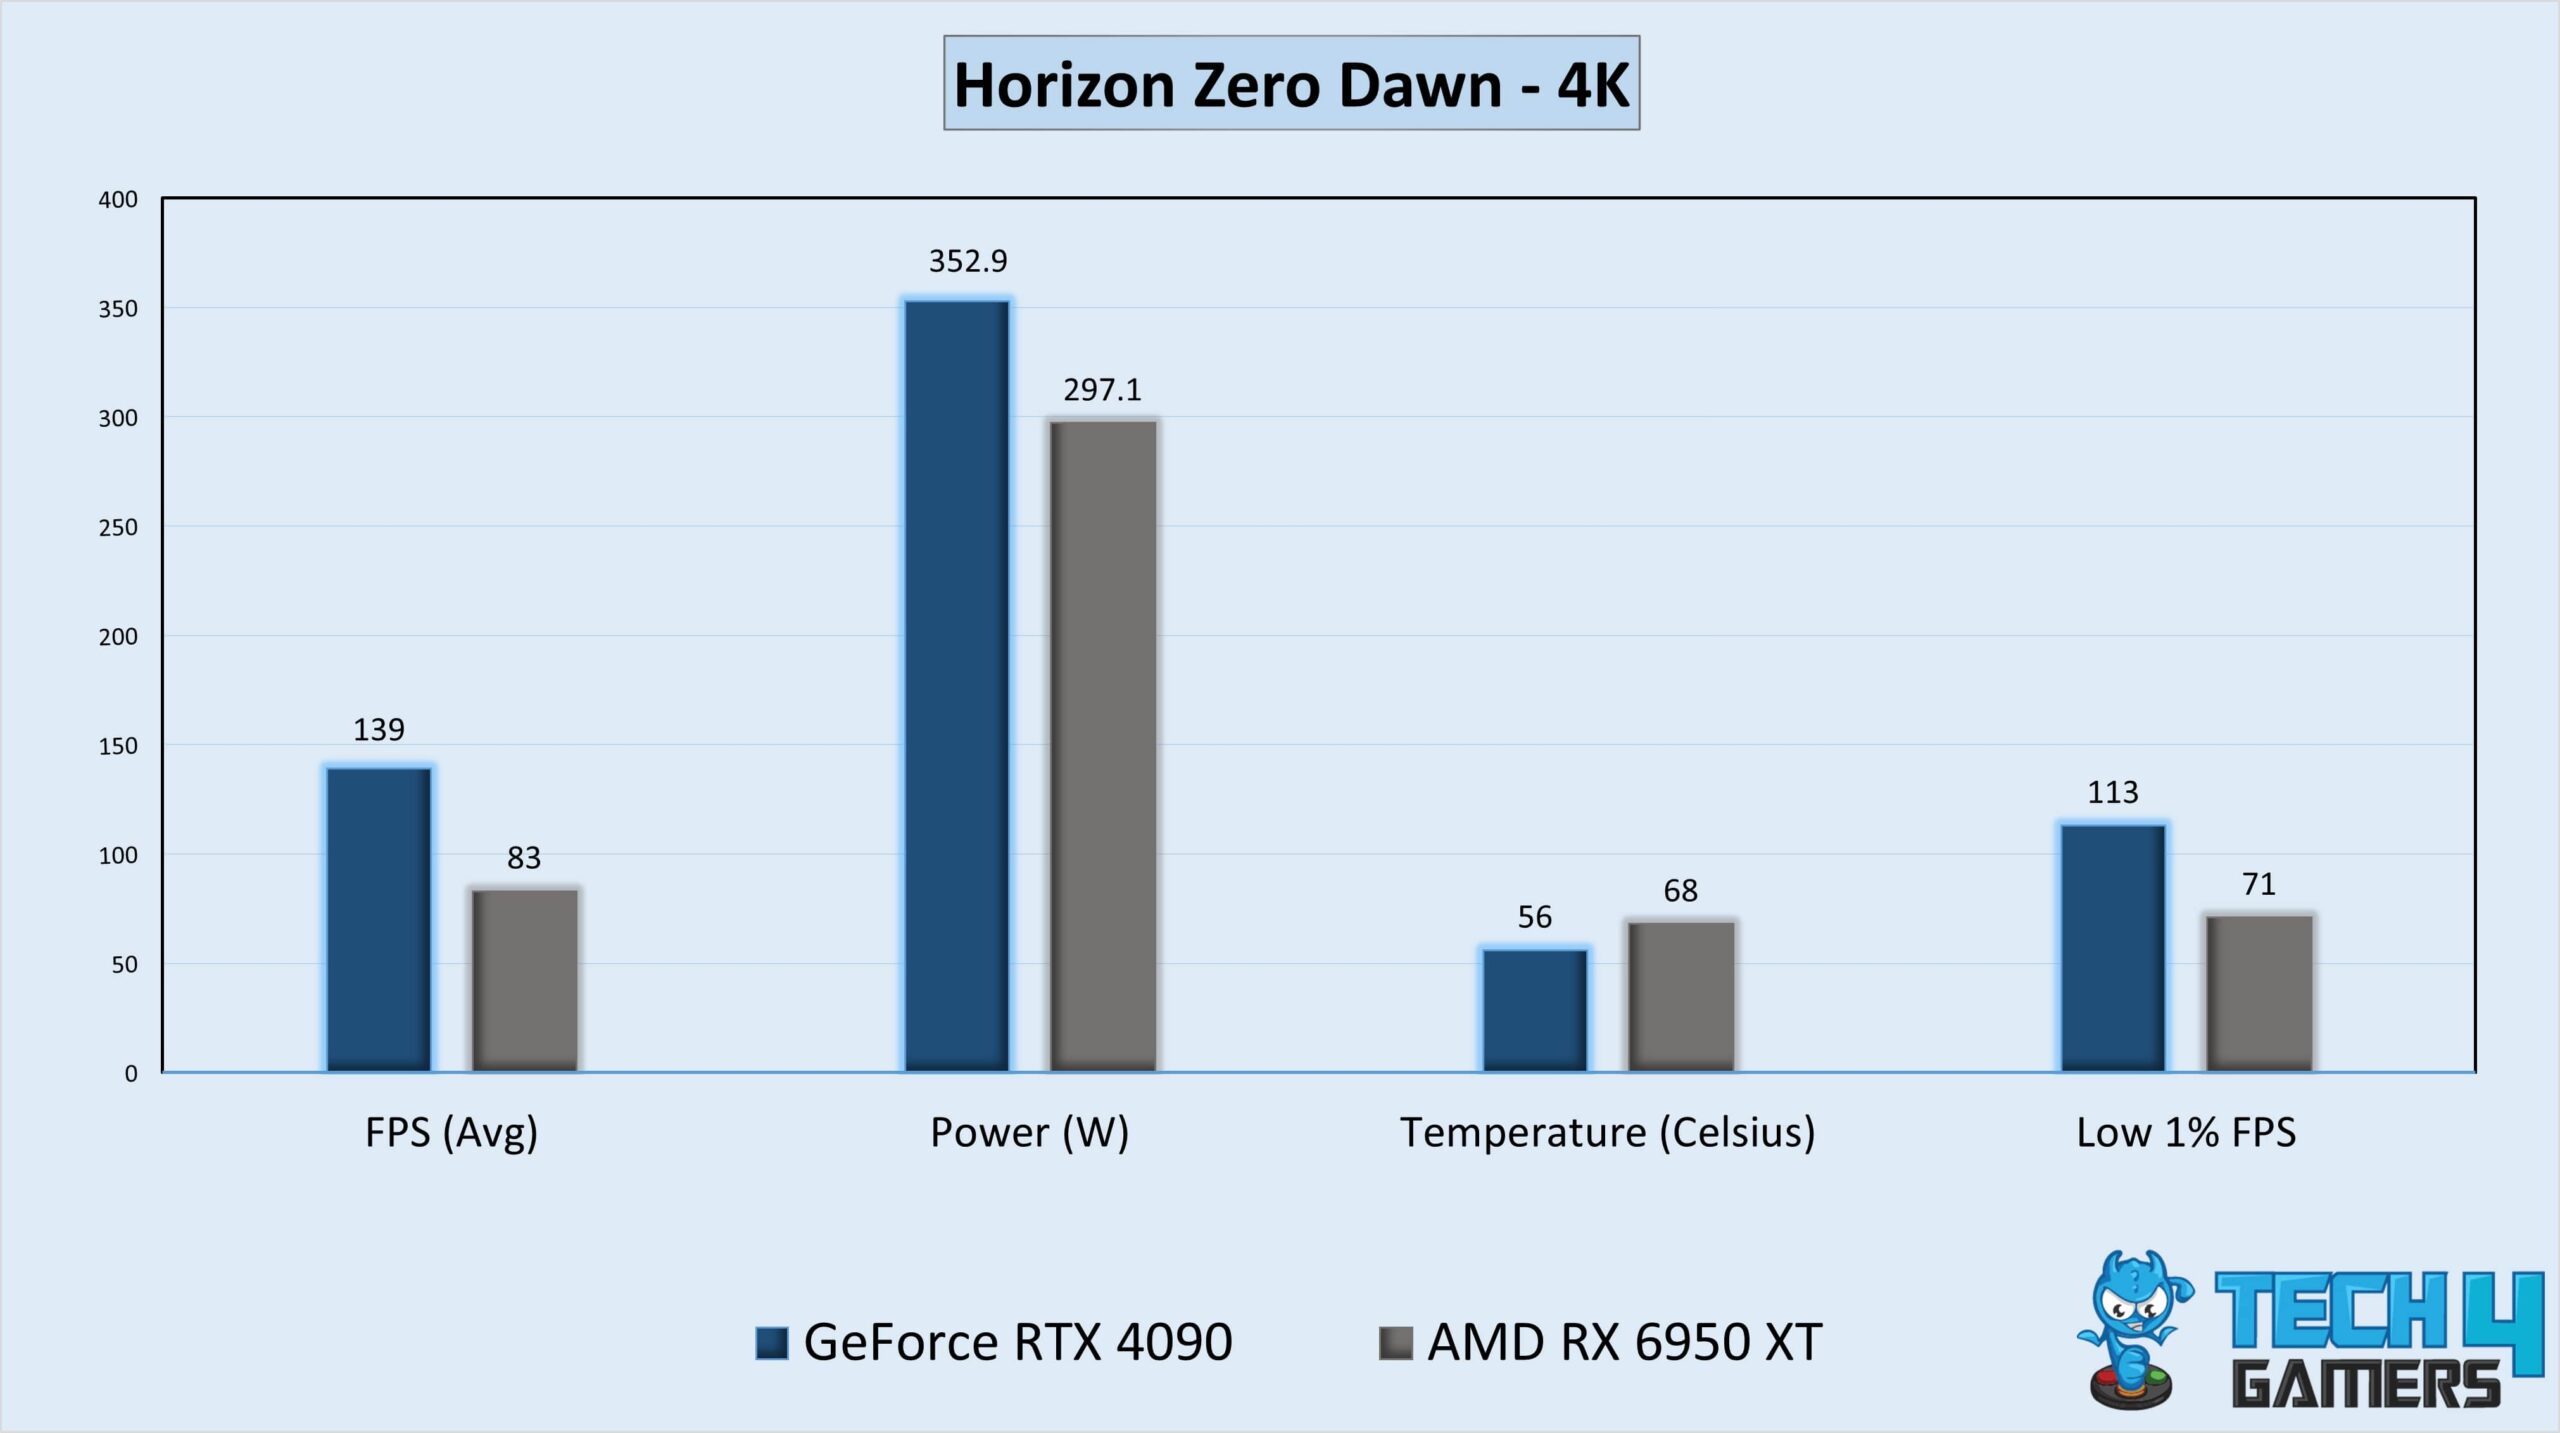
- While playing Horizon Zero Dawn, I saw that the RTX 4090 outperformed the RX 6950 XT by a performance margin of around 67.5%. The RTX 4090 achieved 139 FPS, whereas the RX 6950 XT could only beget 83 FPS.
- At the worst 1% performance, the RTX 4090 managed an exceptional frame rate of 113 FPS, while the RX 6950 XT could only manage 71 FPS.
Microsoft Flight Simulator
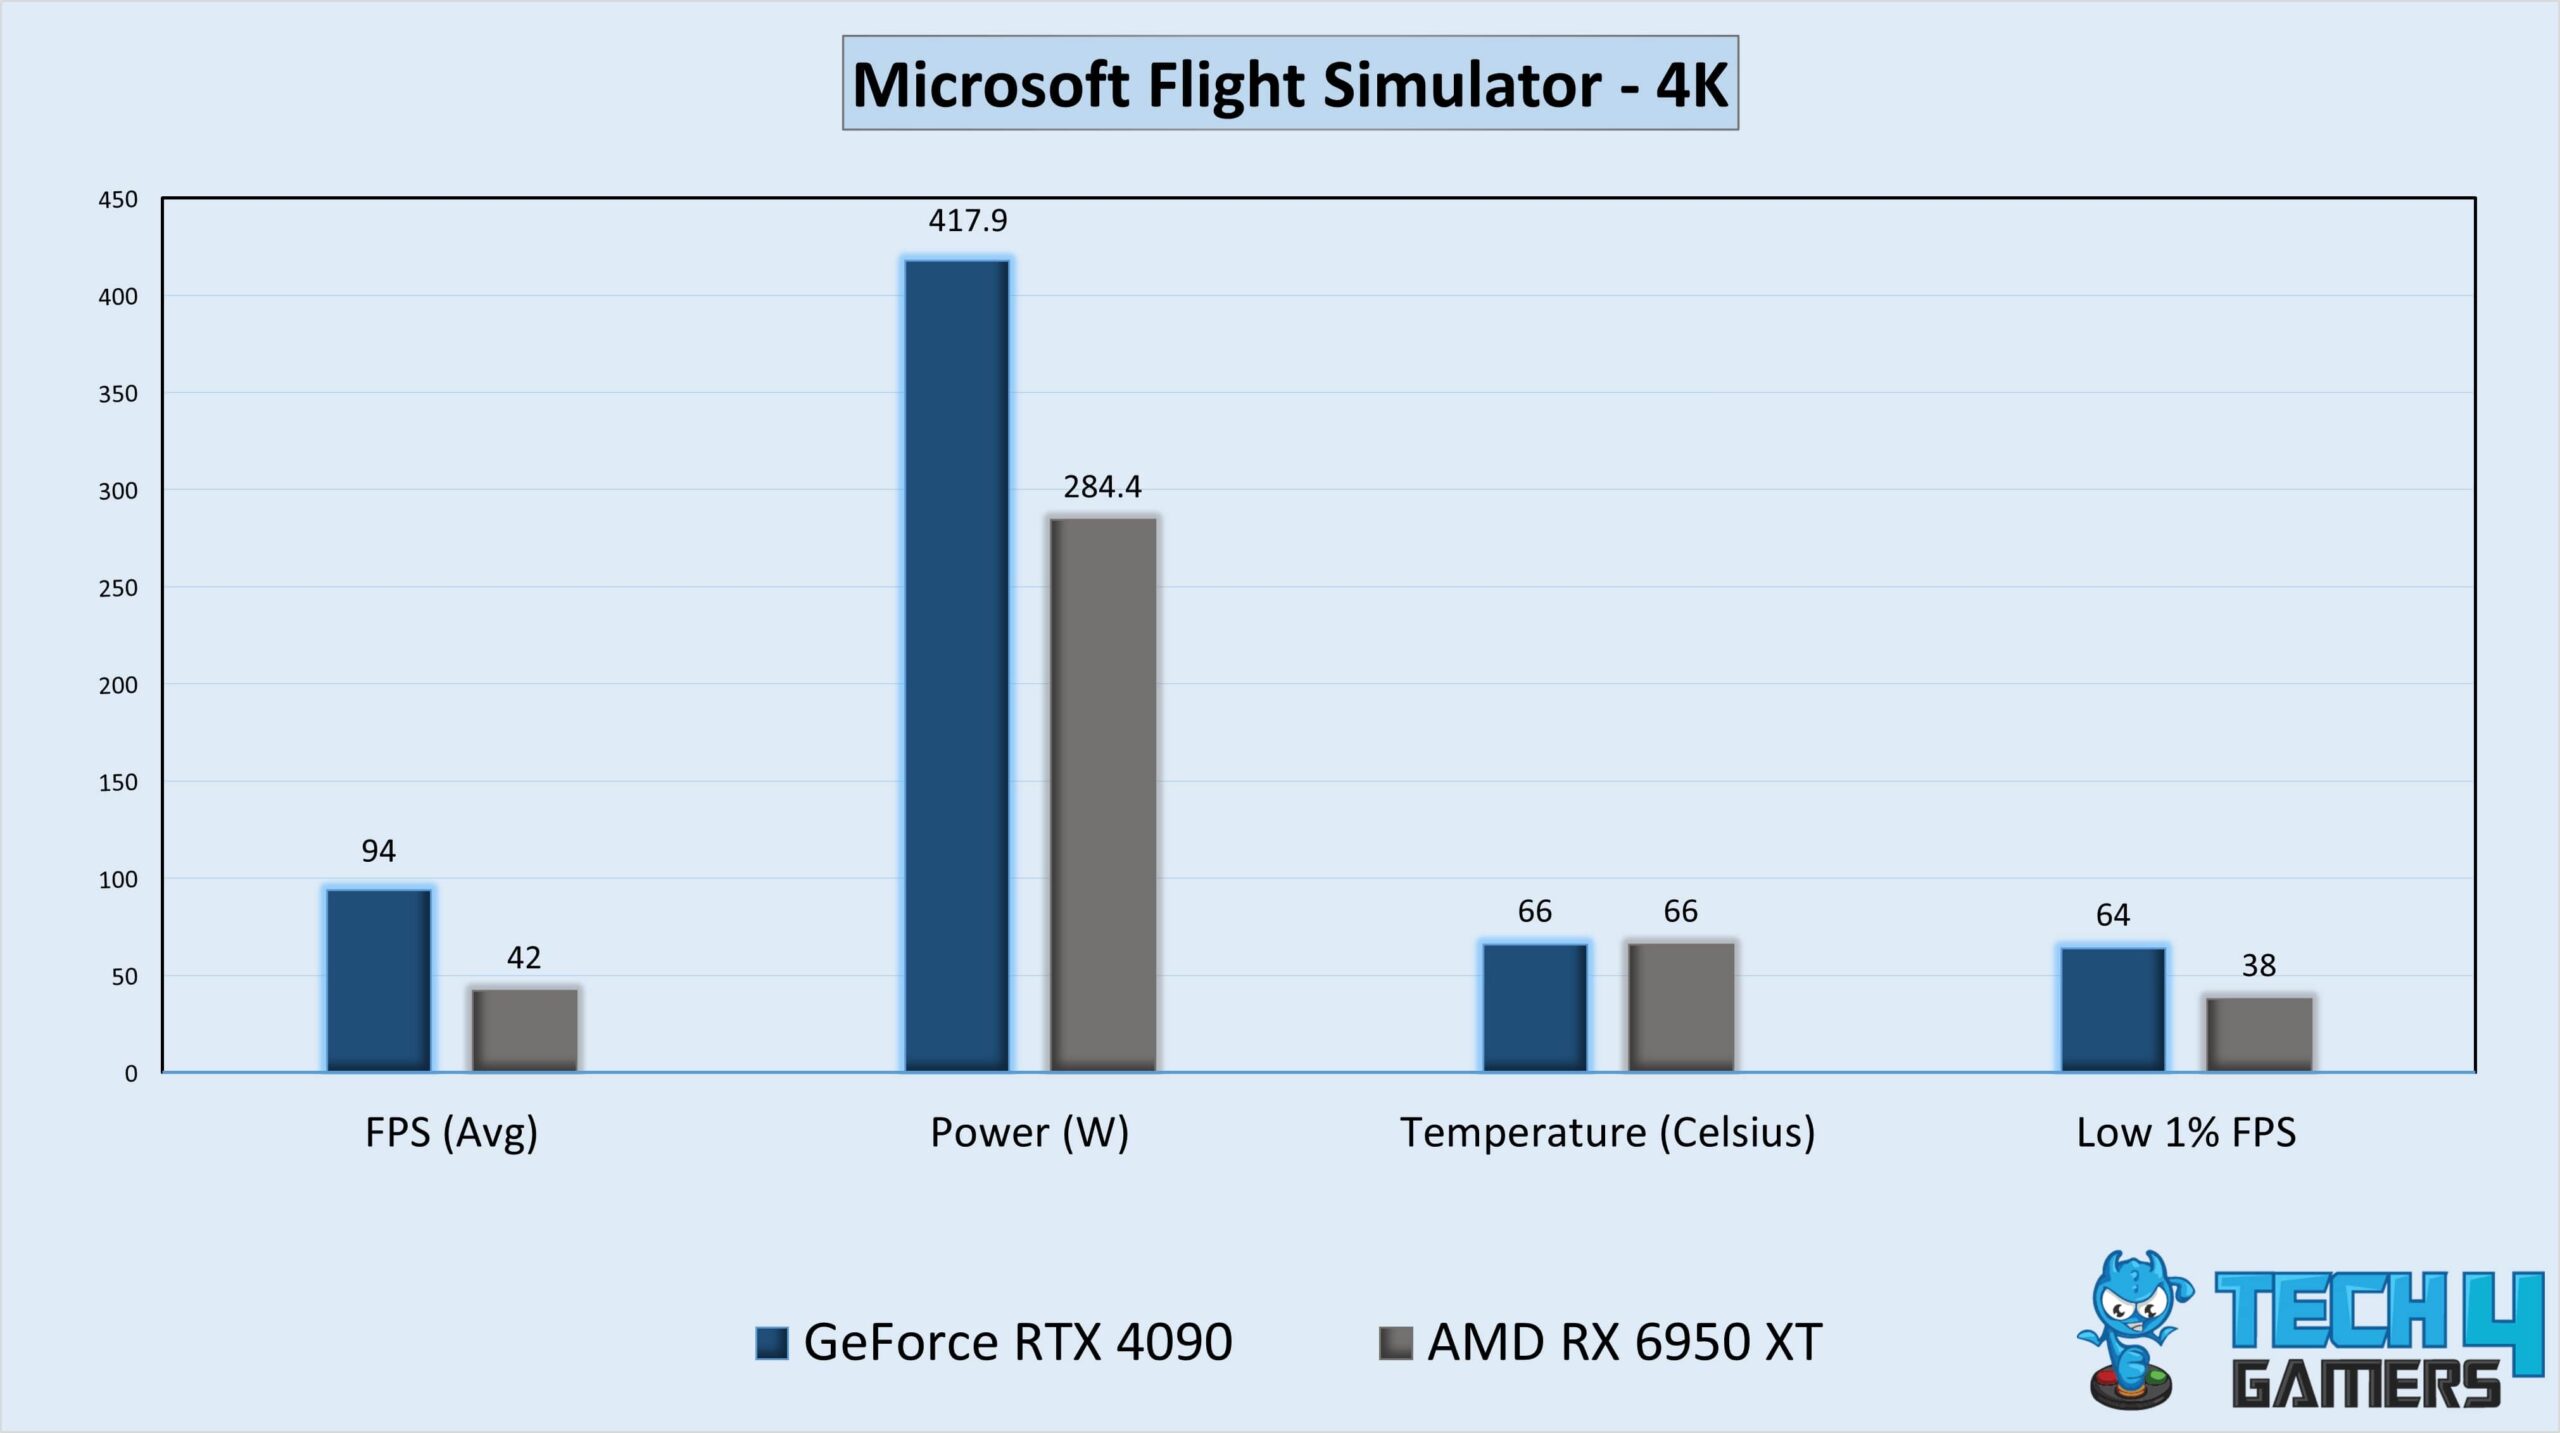
- In my Microsoft Flight Simulator gameplay, the performance of the RTX 4090 was about 124% greater than the RX 6950 XT. While the RX 6950 XT could only manage an average of 42 FPS, the RTX 4090 delivered an astute 94 FPS.
- Regarding the worst 1% performance, the RTX 4090 achieved an outstanding frame rate of 64 FPS, while the RX 6950 XT could only deliver 38 FPS.
PUBG
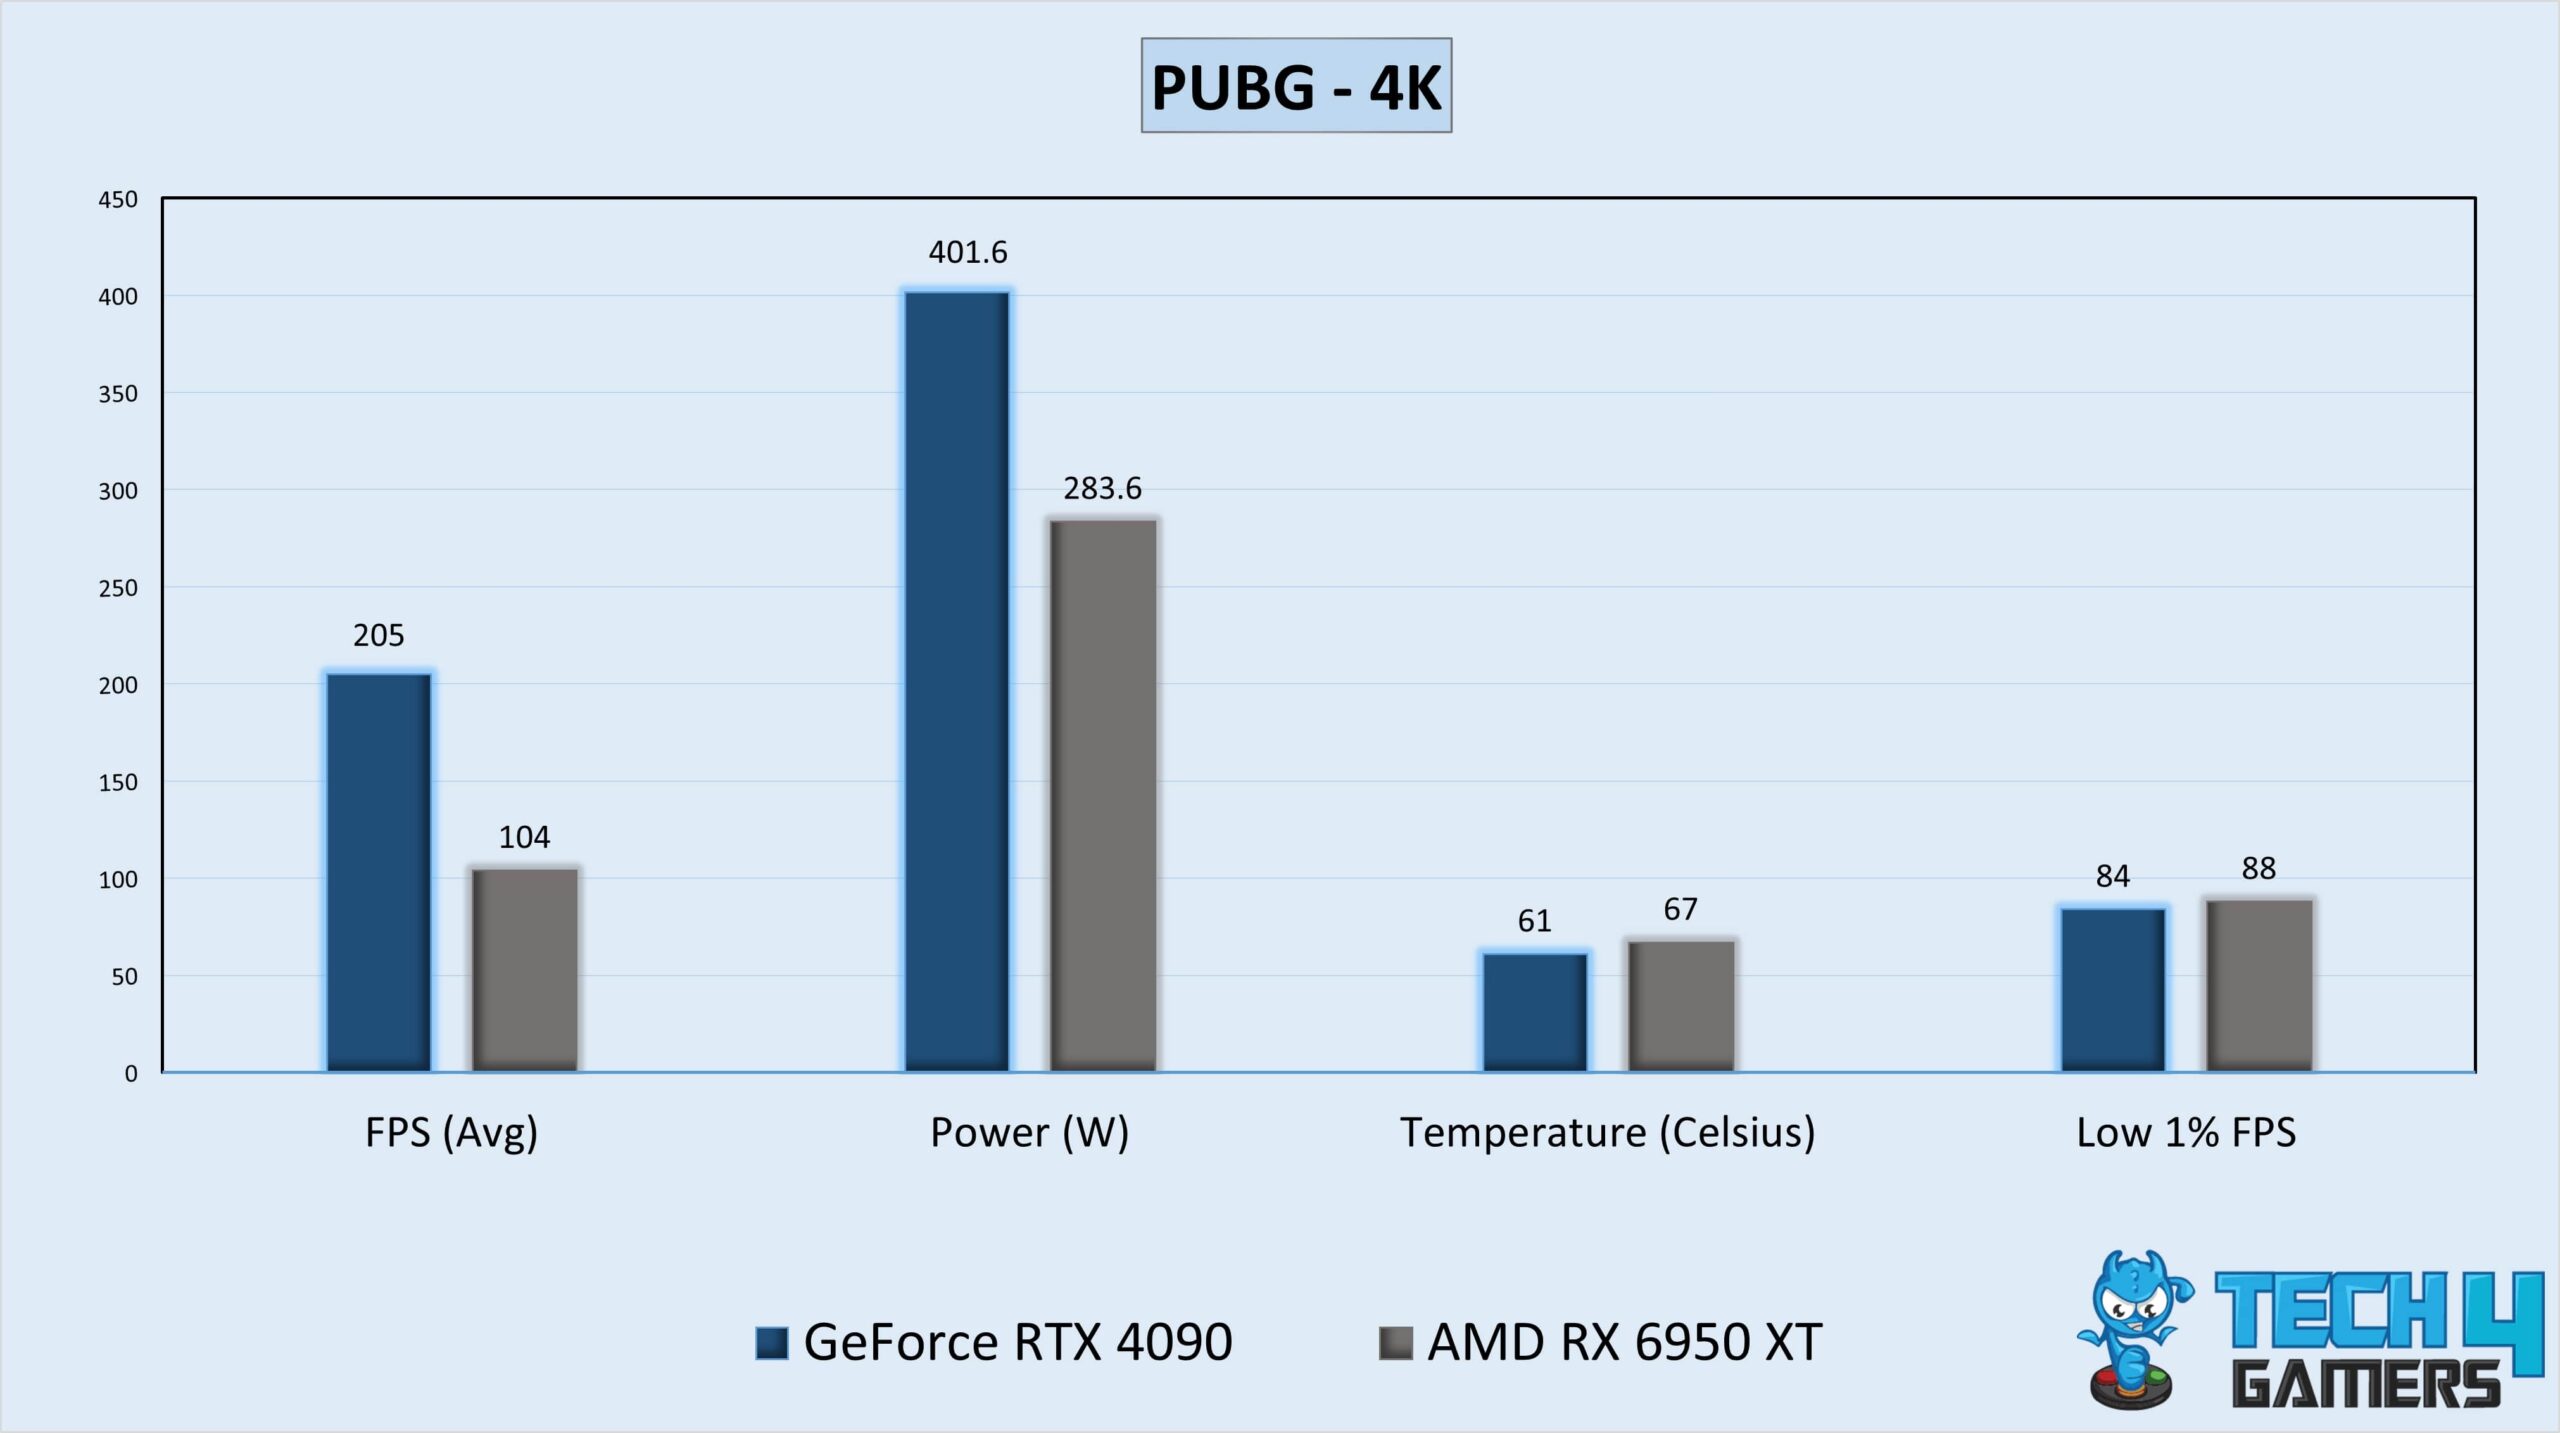
- When running PUBG, I experienced the RTX 4090 achieving a performance advantage of about 97% over the RX 6950 XT. The RTX 4090 delivered an astonishing 205 FPS, whereas the RX 6950 XT could only muster an average of 104 FPS.
- About the low 1% performance, the RX 6950 XT produced 88 FPS, 4 more frames per second than the RTX 4090’s 84 FPS.
Red Dead Redemption 2
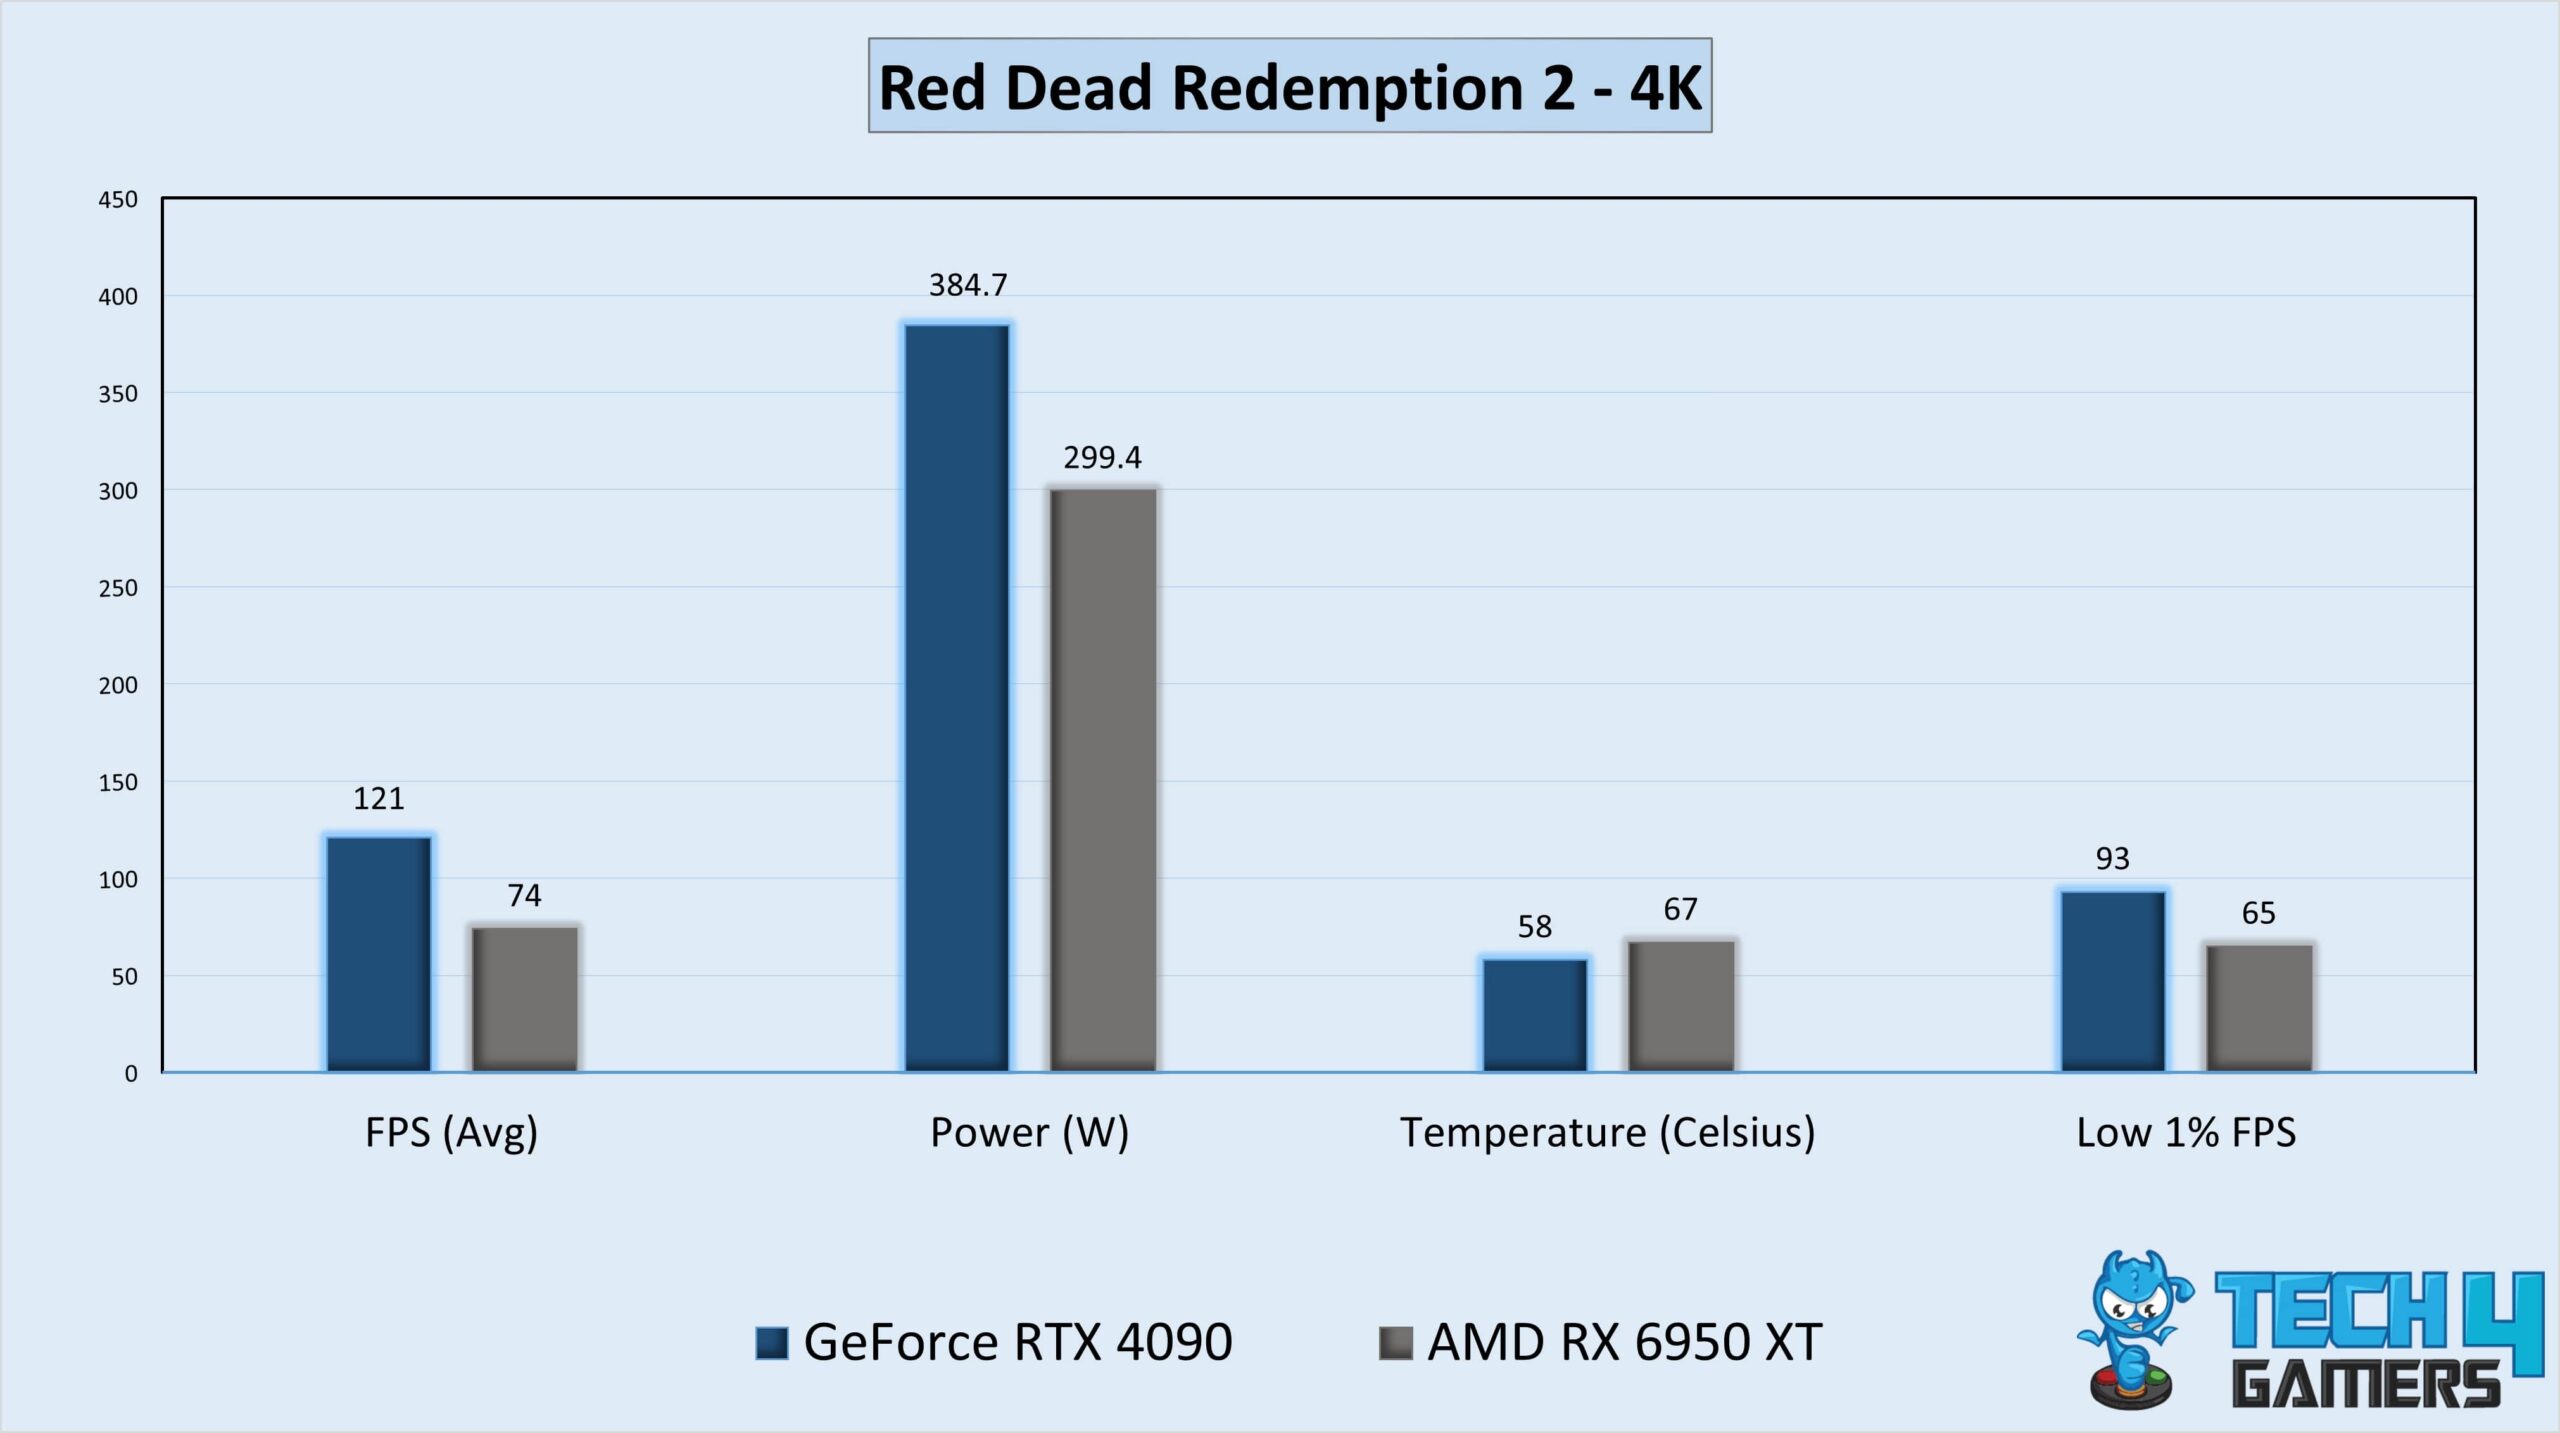
- During my Red Dead Redemption 2 gameplay, the RX 6950 XT lagged behind the RTX 4090 by a performance margin of 63.5%. The RTX 4090 attained an exceptional 121 FPS, whereas the average frame rate for the RX 6950 XT was only 74 FPS.
- With reference to the low 1% frame rate, the RTX 4090 gained 93 frames per second, while the RX 6950 XT furnished 65 FPS.
Spider-Man
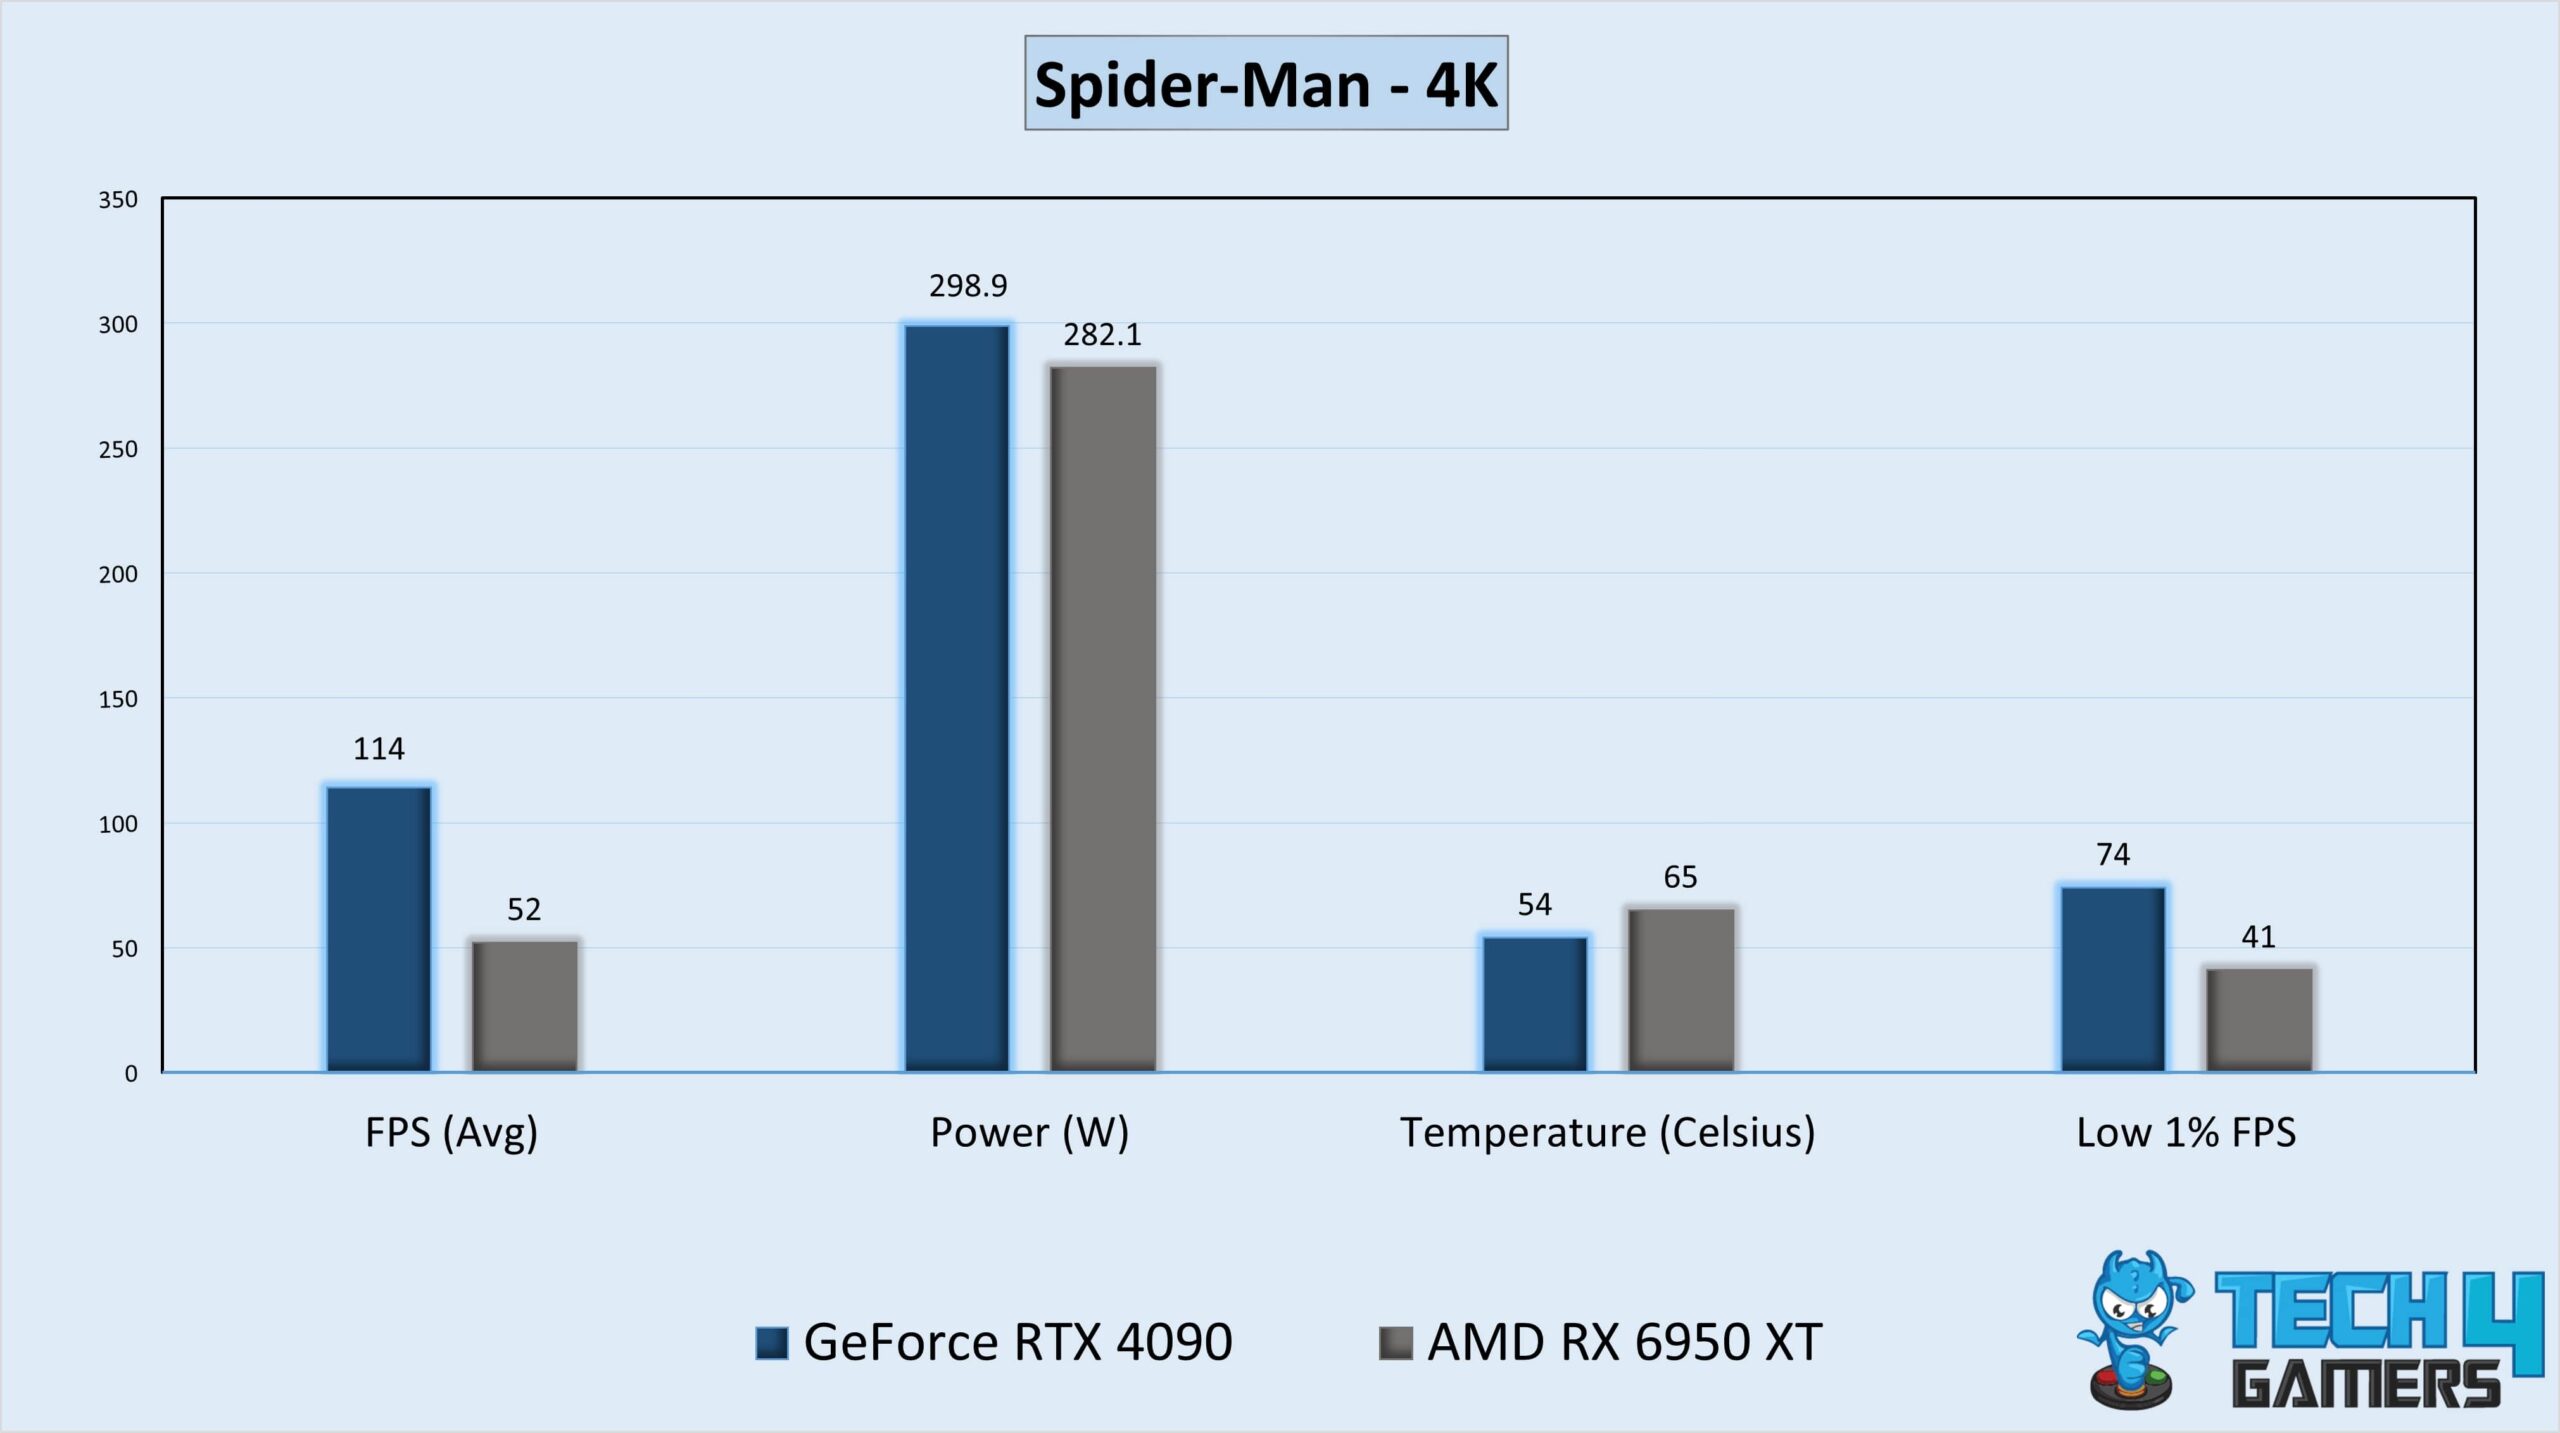
- In my last gameplay of Spider-Man, the RTX 4090 presented a competitive edge of approximately 120% over the RX 6950 XT. In contrast to the RTX 4090’s impressive 114 FPS at 4K, the RX 6950 XT could only turn over 52 FPS on average.
- Per my testing of the low 1% frame rate, the RTX 4090 produced a stunning 74 FPS, while the RX 6950 XT provided only 41 FPS.
Overall Gaming Performance
Average FPS
Based on gaming benchmarks, the Nvidia RTX 4090 emerges as the clear winner in the FPS battle against the RX 6950 XT with an impressive average margin of approximately 45%.
After averaging the FPS for the aforementioned games, the RTX 4090 demonstrated a remarkable 169.5 FPS at 4K resolution, whereas the RX 6950 XT managed only 116.9 FPS. The RX 6950 XT failed to achieve a higher average frame rate than the RTX 4090 in any of the games discussed above.
Low 1% FPS
The RTX 4090 also won the low 1% FPS battle against the RX 6950 XT, with an amazing average lead of around 34.3%. I found that the RTX 4090 yielded an outstanding overall low 1% frame rate of 105.7 FPS, while the RX 6950 XT could only manage 78.7 FPS.
Gaming Power Consumption
Reminder: The TDP of the RTX 4090 is 450W, which is around 35% higher than that of the RX 6950 XT, which is 335W.
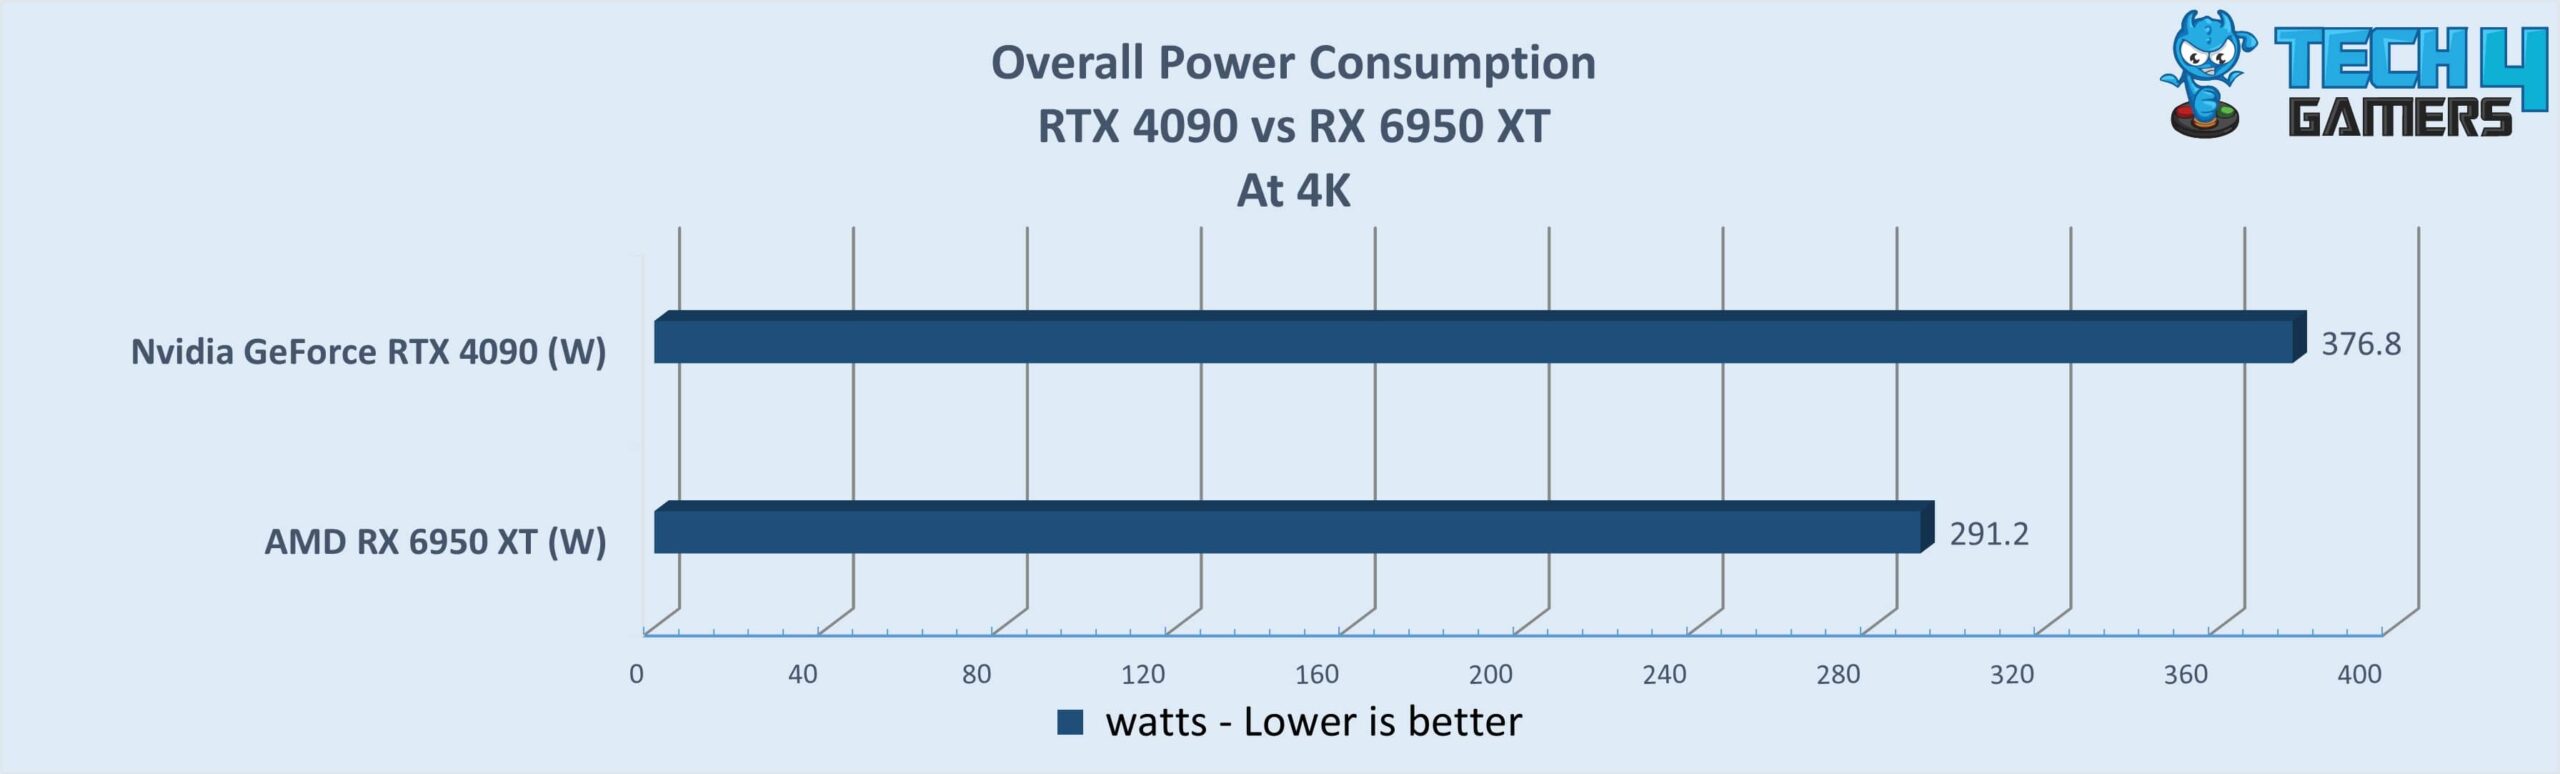
According to my testing of power usage, the RX 6950 XT boasts approximately 29.4% greater power efficiency or lower energy consumption than the RTX 4090. During the aforementioned games I played at 4K resolution, I noted that the RX 6950 XT registered an average power consumption of 291.2 watts. On the other hand, the RTX 4090 consumed more power, averaging 376.8 watts.
Gaming Temperatures
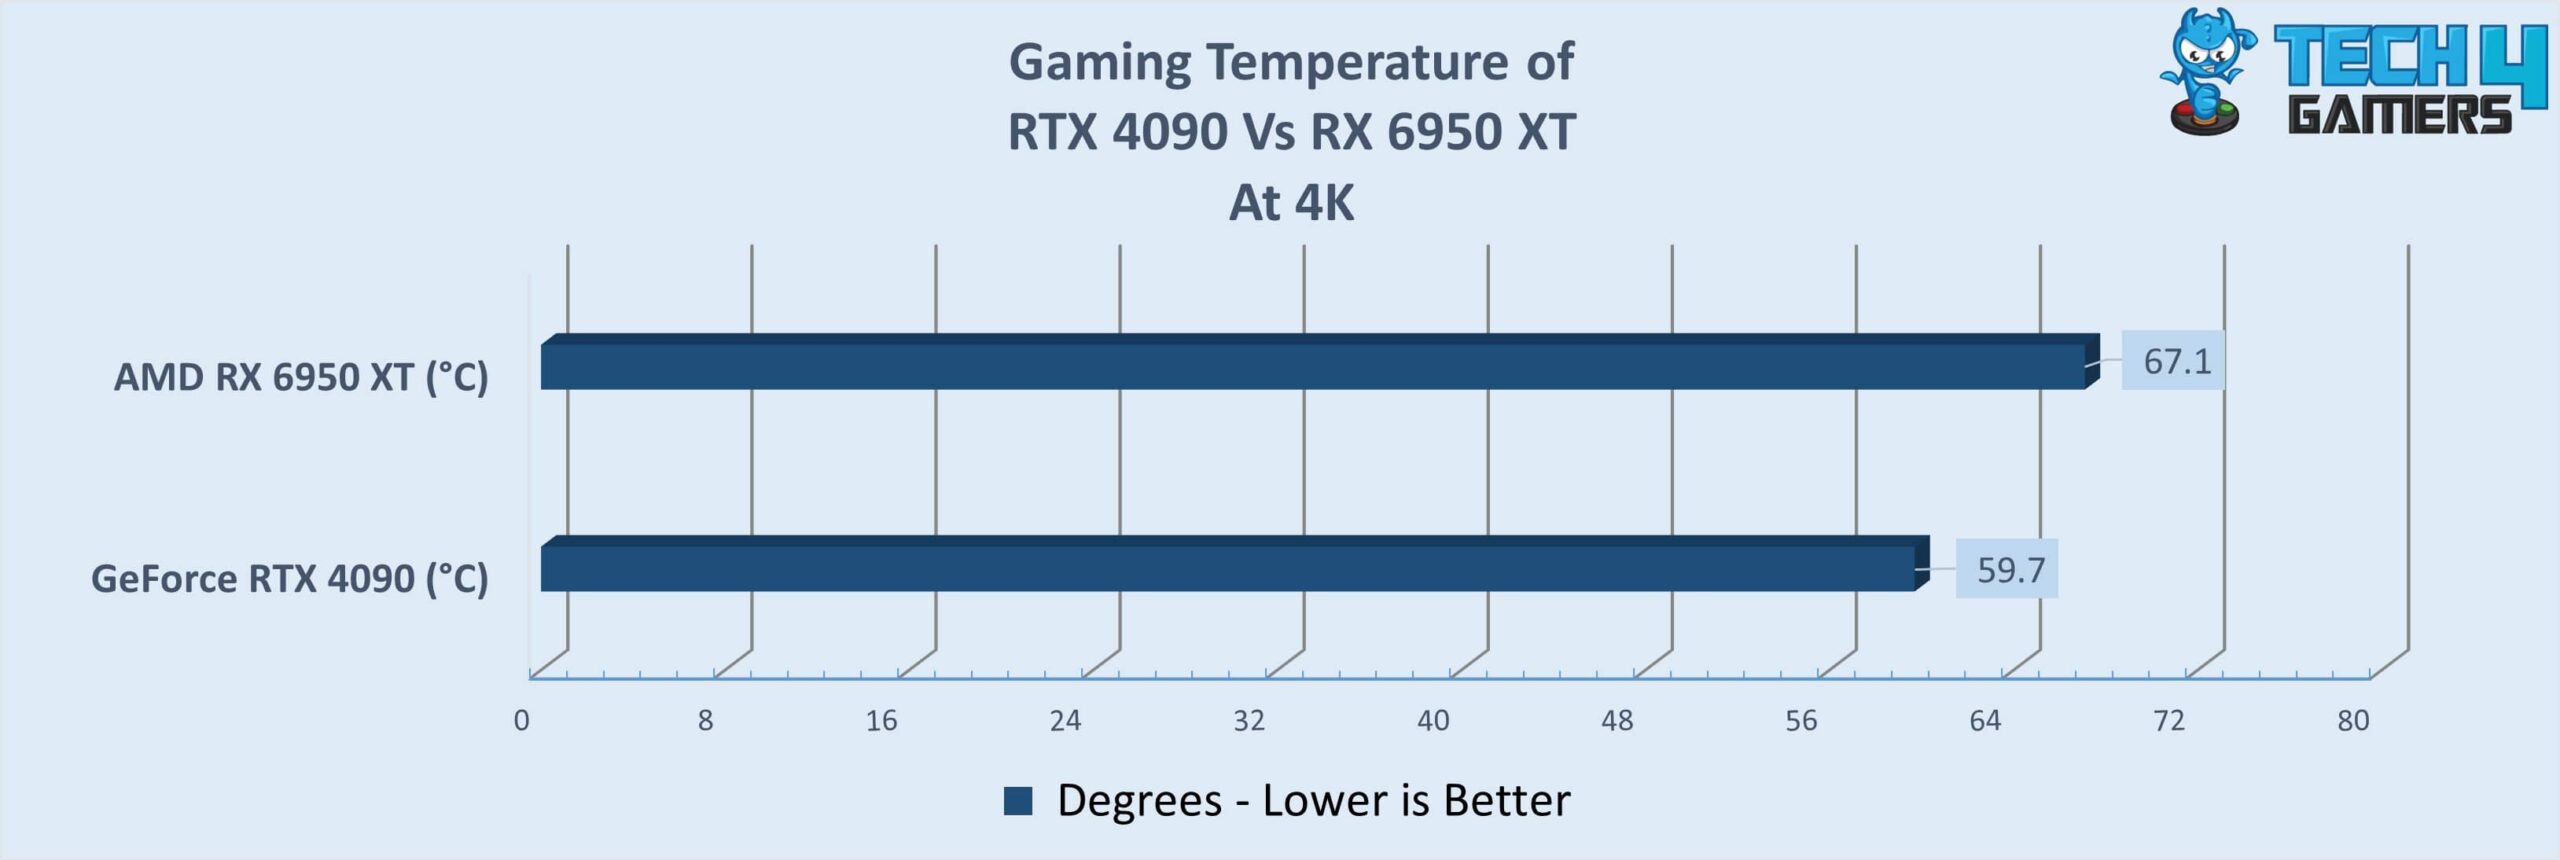
Based on my gaming temperature test, the RTX 4090 outperforms the RX 6950 XT by exhibiting a 12.4% greater thermal efficiency or remaining relatively cooler by 7.4°C. The RTX 4090 maintained an average gaming temperature of approximately 59.7°C, while the RX 6950 XT recorded an average of 67.1°C.
If you are encountering GPU overheating issues, seek help from our guide on How To Lower GPU Temperature.
Price And Availability
Before making a decision on which GPU to choose, it is advisable to take into account both its cost and availability. When considering the launch MSRPs, Nvidia priced the RTX 4090 at $1599 in September 2022, while AMD priced the RX 6950 XT at $1099 in May 2022.
It’s worth noting that the prices of graphics cards are subject to change based on factors such as time and demand. Currently, the RTX 4090 is being sold by various manufacturers at prices ranging from $1900 to $2300. Conversely, the RX 6950 XT is available for purchase at $630 to $780. The RX 6950 XT is now selling below its launch MSRP is likely due to the introduction of AMD’s newer graphics cards into the market.
In terms of availability, both graphics cards are currently widely available through various online and offline retailers. They can be easily ordered online from Amazon, Newegg, and other stores.
Which One Do I Recommend?
After extensively comparing the RTX 4090 vs RX 6950 XT, it is time to decide which GPU is better per individual needs and budget.
If your principal purpose is to relish an unparalleled gaming experience with exceptional performance, and you are unbound by budget constraints, then I recommend the RTX 4090. This GPU stands as the ultimate icon among all available graphics cards.
However, if budget constraints are a consideration and you seek a cost-effective GPU with lower operating costs, I recommend considering the RX 6950 XT. The price of the RX 6950 XT is much lower than that of the RTX 4090 and boasts around 30% greater power efficiency, resulting in reduced electricity costs. When not compared to the RTX 4090, the RX 6950 XT exhibits commendable gaming performance.
Pros And Cons
| GPU | Pros | Cons |
|---|---|---|
| Nvidia GeForce RTX 4090 | ✅ Incredible 4K gaming performance ✅ DLSS 3 significantly accelerates performance ✅ Features Dual AV1 encoders ✅ Superb for content creation | ❌ The price is exorbitantly high ❌ Not much power efficient ❌ Fitting issues due to larger width and length |
| AMD Radeon RX 6950 XT | ✅ Offers a dual BIOS switch and an idle fan stop function ✅ Exhibits remarkable cooling and operates quietly ✅ Efficient power dissipation ✅ More affordable compared to Nvidia cards | ❌ Ray tracing performance lags Nvidia RTX GPUs ❌ Mediocre performance for creative applications ❌ Underwhelming Upgrade from RX 6900 XT |
More From RTX 4090:
More From RX 6950 XT:
Thank you! Please share your positive feedback. 🔋
How could we improve this post? Please Help us. 😔
[Comparisons Expert]
Abdemanaf is a skilled creative writer who has been honing his craft since 2011. While initially working in different fields, he found a passion for technology and has been exploring the tech world since early 2015. Over the years, he has developed an in-depth knowledge of the latest tech trends and product offerings by various companies.
Abdemanaf’s writing reflects his analytical mindset and ability to think critically. He has a knack for breaking down complex technical information into easily digestible pieces, making his articles engaging and accessible to readers from all backgrounds. In February 2022, he joined Tech4Gamers as a blog and product comparison writer, where he has been able to hone his skills further.
As a writer, Abdemanaf is dedicated to staying up-to-date with the latest technological advancements and trends, enabling him to provide readers with the most relevant and accurate information. He is always eager to learn more and is constantly seeking new challenges to improve his skills.
Get In Touch: manaf@tech4gamers.com


