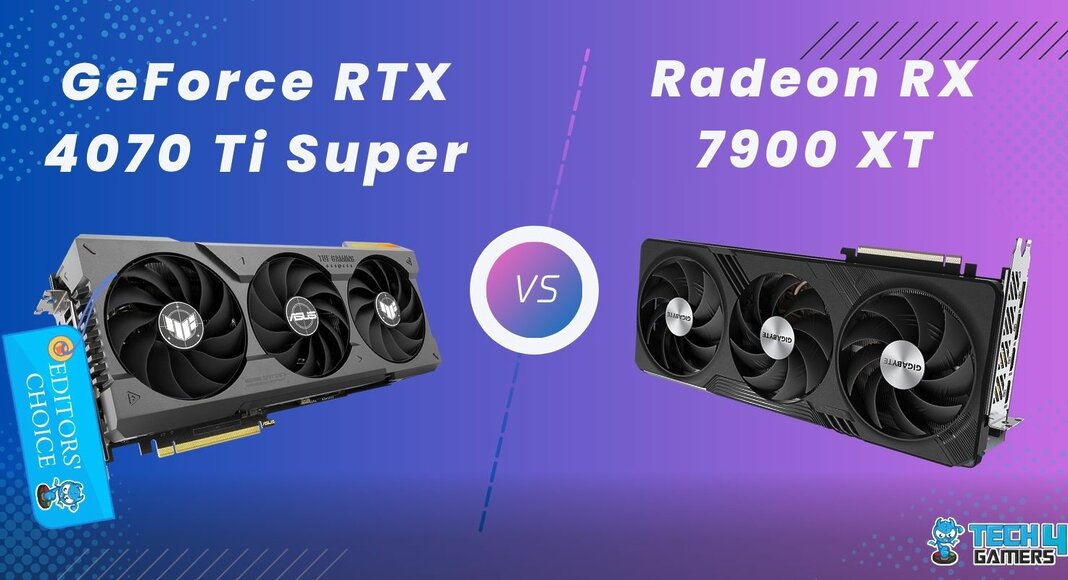
Nvidia GeForce RTX 4070 Ti Super
Rated: 8.5/10
AMD Radeon RX 7900 XT
Rated: 8/10
Pros & Cons
| Graphics Card | Pros | Cons |
|---|---|---|
| RX 7900 XT | ✅ Lower price ✅ Slightly better rasterized performance ✅Larger VRAM buffer | ❌Bad RT performance ❌Less power efficient |
| RTX 4070 Ti Super | ✅ Better RT performance ✅Better power efficiency | ❌Small VRAM buffer |
- In our performance testing at 4k, we saw that the RTX 4070 Ti Super was significantly ahead of the RX 7900 XT in terms of ray-traced gaming while they traded blows in traditionally rasterized games.
- Despite both processors using the same manufacturing nodes, the RTX 4070 Ti Super proved to be significantly more power-efficient.
- In early February 2024, the RTX 4070 Ti Super has a price tag that is 13% higher than the RX 7900 XT.
- The bulk of the performance difference going from the RX 7900 XT to the RTX 4070 Ti Super came from RT gaming, which serves as the pivot point for customers deciding between the two GPUs.
Comparison Table
| Feature | Radeon RX 7900 XT | GeForce RTX 4070 Ti Super |
|---|---|---|
| Architecture | RDNA 3 | Ada Lovelace |
| Design Chip | Navi 31 | AD103 |
| Product Family | AMD Radeon RX 7000 Series | Nvidia GeForce RTX 40 series |
| Steam Processors/Cuda Cores | 5376 | 8448 |
| Compute Units/Tensor Cores | 84 | 264 |
| Ray Accelerators | 84 | 66 |
| ROPs | 192 | 96 |
| Memory Bandwidth | 800.0 GB/s | 672.3 GB/s |
| Best Variants | Best RX 7900 XT Graphics Cards | Best RTX 4070 Ti Super Graphics Cards |
Architectural Differences
- Clock Speed: The RTX 4070 Ti Super leads in clock speeds, with a base of 2340MHz and a boost up to 2610MHz, while the RX 7900 XT trails with a base of 1500MHz and a boost up to 2394MHz.
- VRAM: The RTX 4070 Ti Super has a VRAM buffer of 16GB using DDR6X memory, whereas the RX 7900 XT uses 20GB of GDDR6 VRAM. This difference might prove to be crucial as games become more memory-intensive over the years.
- TDP: The RTX 4070 Ti Super is rated for a TDP of 285 watts, whereas the RX 7900 XT comes packaged with a TDP of 300 watts.
- Processing Nodes: Both the RTX 4070 Ti Super and the RX 7900 XT utilize 5nm processing nodes manufactured by TMSC, which promises similar power efficiency.
- Other Difference: Most premium features of Nvidia’s RTX 40 series are now accessible on AMD cards through open-source software, including AI upscaling and Frame Generation.
Gaming Tests – 4K
To understand the differences between the RTX 4070 Ti Super and RX 7900 XT, we’ve conducted real-world gaming tests using a carefully designed benchmark system, ensuring minimal bottlenecks. See below for the test bench specifications.
Test Bench
- CPU: Core i9-13900K
- Motherboard: ASUS TUF Gaming Z690-Plus
- RAM: G.Skill Ripjaws S5 6000MHz DDR5
- SSD: XPG GAMMIX S70 BLADE 2TB NVMe
- CPU Cooler: Arctic Liquid Freezer II 360 – AIO Water Cooler
- PSU: ENERMAX REVOLUTION D.F. X 1050W
Alan Wake 2

- In Alan Wake without RT or upscaling, the RTX 4070 Ti Super averaged 40 FPS, while the RX 7900 XT closely followed with 39 FPS, a negligible difference for most users to notice.
- The 1% lows of both cards were also brushing up against one another, with the RTX 4070 Ti Super getting lows of 36 FPS while the RX 7900 XT had lows of 35 FPS, once again, a difference most gamers would not be able to tell apart.
Starfield

- With the settings turned up and no upscaling, the RTX 4070 Ti Super took a backseat in this game with an average performance of 51 FPS, while the RX 7900 XT was 8% faster with an average framerate of around 55 FPS.
- The 1% lows also held what we found the averages true, with the RTX 4070 Ti Super getting lows of 43 FPS while the RTX 7900 XT had lows of 46 FPS, securing another 7% lead of the RX 7900 XT.
Cyberpunk 2077 (DLSS/FSR, RT)

- The RTX 4070 Ti Super achieved an average framerate of 49 FPS, leaving the RX 7900 XT far behind at 27 FPS, resulting in an 81% lead for the RTX 4070 Ti Super.
- The apple didn’t fall far from the tree when it came to the 1% lows. The RTX 4070 Ti Super had lows of 39 FPS, while the RX 7900 XT halved that with 1% lows hovering around the 21 FPS mark.
Forza Horizon 5

- The Extreme settings paired with RT were not a challenge for either card in this game. The RTX 4070 Ti Super had an average framerate of 139 FPS, while the RX 7900 XT had an average of 144 FPS, giving the Radeon card a 3.6% lead.
- The minimum framerates in this game were the same on both of our cards at 118 FPS, pushing their perceived performance even closer.
Hogwarts Legacy (RT On, No Upscaling)

- Testing Hogwarts Legacy with RT on and without upscaling, the RTX 4070 Ti achieved an average framerate of 35 FPS, showing a 75% advantage over the RX 7900 XT, which managed only 20 FPS.
- The 1% lows underscored the performance gap, with the RTX 4070 Ti Super at around 23 FPS and the RX 7900 XT trailing at 15 FPS. This represented a 53% advantage in this game.
Avatar Frontiers Of Pandora(DLSS/FSR Q)

- With default RT settings and upscaling assistance, the RTX 4070 Ti Super led with an average framerate of 64 FPS, approximately 10% faster than the RX 7900 XT’s average framerate of 58 FPS.
- As for the 1% lows, the difference once again fell slightly short of 10%, with the RTX 4070 Ti Super getting minimums of 46 FPS, while the RX 7900 XT had lows closer to 42 FPS.
Red Dead Redemption 2

- With no upscaling, RDR2 ran slightly better on the RX 7900 XT, with an average framerate of 92 FPS instead of the 90 FPS average of the RTX 4070 Ti Super. This difference came out to a minute 2%.
- The 1% lows were also the slightest bit different between the two graphics cards, with the RTX 4070 Ti Super getting lows of 74 FPS, only one frame shu of the 75 FPS minimums of the RX 7900 XT.
The Last Of Us Part 1

- Lastly, Ultra settings on the Last Of Us Part 1 had an average framerate of around 66 FPS on the RX 7900 XT, while the RTX 4070 Ti Super had an average framerate of 63 FPS, about 4% slower than the Radeon card.
- The 1% lows were also slightly higher on the RX 7900 XT at around 56 FPS, while the RTX 4070 Ti Super had lows of 55 FPS.
Overall Gaming Performance
| Featured | RTX 4070 Ti Super | RX 7900 XT |
|---|---|---|
| Average FPS | 66 📈 | 63 📈 |
| %1 lows | 54 📉 | 51 📉 |
| Winner: Nvidia's RTX 4070 Ti Super | ||
In our testing, the RTX 4070 Ti Super surpasses the RX 7900 XT by 6%, particularly excelling in ray-traced games, despite a 1.6% advantage for the RX 7900 XT in non-ray-traced scenarios. With a notable lead in 1% lows due to superior ray-traced performance, the RTX 4070 Ti Super emerges as the overall winner.
Power Consumption
| Game | RTX 4070 Ti Super (W) | RX 7900 XT (W) |
|---|---|---|
| Alan Wake 2 | 289 | 328 |
| Starfield | 272 | 308 |
| Cyberpunk 2077 | 281 | 323 |
| Forza Horizon 5 | 249 | 317 |
| Hogwarts Legacy | 268 | 308 |
| Avatar Frontiers Of Pandora | 282 | 328 |
| Red Dead Redemption 2 | 280 | 307 |
| The Last Of Us Part 1 | 277 | 308 |
| Average Power Consumption | 275 | 316 |
| Winner: Nvidia's RTX 4070 Ti Super | ||
Even though the RTX 4070 Ti Super took the crown in gaming performance, it also managed to use much less power than the RX 7900 XT. The RX 7900 XT put out comparable performance as the RTX 4070 Ti while taking 15% more power from the wall. Safe to say, Nvidia holds its title as best in terms of power efficiency.
Price And Value
| Graphics Card | Launch MSRP | Current Price |
|---|---|---|
| RTX 4070 Ti Super | 💲799 | 💲799 |
| RX 7900 XT | 💲899 | 💲729 |
| Difference | 13% | 10% |
The RX 7900 XT, initially pricier than the RTX 4070 Ti Super, has seen a significant price drop, now being around 10% cheaper. This, coupled with potential additional discounts in the used market, makes it a compelling and better-value choice for consumers.
What We Recommend
RX 7900 XT: If real-time ray tracing isn’t crucial, the RX 7900 XT offers better value than the RTX 4070 Ti Super. Its larger VRAM, solid performance for 4K gaming, and compatibility with AMD’s open-source software make it a compelling choice.
RTX 4070 Ti Super: Deciding if RT is worth the extra $70 is challenging, but if your budget allows, we recommend the RTX 4070 Ti Super over the RX 7900 XT. As games increasingly adopt ray tracing, the RTX card’s lower power draw and potential for widespread use make it an attractive choice.
To conclude our analysis of the RTX 4070 Ti Super vs RX 7900 XT, the decision between the two cards more or less boils down to your preference for ray-traced gaming. Both cards offer solid value against each other, so be sure to evaluate the nuances before making your purchasing decision.
Frequently Asked Questions
Yes, the RTX 4070 Ti has 57% more Cuda cores than AMD’s card has stream processors, but this isn’t an apples-to-apples comparison as both are designed differently.
The RTX 4070 Ti Super uses a single 16-pin connector, whereas the Radeon RX 7900 XT uses a dual 8-pin connector.
The Radeon RX 7900 XT has two DP 2.1 ports, whereas the RTX 4070 Ti Super has three DP 1.4a ports.
More From RTX 7900 XT
Thank you! Please share your positive feedback. 🔋
How could we improve this post? Please Help us. 😔
[Comparisons Expert]
Shehryar Khan, a seasoned PC hardware expert, brings over three years of extensive experience and a deep passion for the world of technology. With a love for building PCs and a genuine enthusiasm for exploring the latest advancements in components, his expertise shines through his work and dedication towards this field. Currently, Shehryar is rocking a custom loop setup for his built.
Get In Touch: shehryar@tech4gamers.com


