


Intel Core i5-10400
Rated: 8.0/10
Intel Core i5-13400
Rated: 8.5/10
Pros And Cons
| CPU | Pros | Cons |
|---|---|---|
| Intel Core i5-13400 | ✅ Good price-to-performance ratio ✅ Supports a lot of motherboards | ❌ Not good for 4K gaming |
| Intel Core i5-10400 | ✅ Decent FPS for a budget CPU ✅ Low power draw | ❌ LGA 1200 adoption is mandatory |
- In our gaming trials, the Core i5-13400 exhibits a performance boost of 44.2% at 1080p, surpassing the Core i5 10400.
- As per our testing, the Core i5-10400 outperforms the Core i5-13400, consuming 56% less power, while the Core i5-13400 excels in thermal performance, with 2.3% lower temperatures.
- In the current market of February, the Core i5 13400 is available for around $182, while the Core i5 10400 costs around $115.
- I suggest considering the Core i5 13400 for its notably enhanced gaming capabilities, compatibility with DDR5, and excellent overall value.
Comparison Table
| Feature | Intel Core i5-13400 | Intel Core i5-10400 |
|---|---|---|
| Codename | Raptor Lake-S | Comet Lake |
| CPU Socket | Intel Socket 1700 | Intel Socket 1200 |
| Cores | 10 (6 P-cores, 4 E-cores) | 6 |
| Threads | 16 | 12 |
| Integrated Graphics | UHD Graphics 730 | UHD Graphics 630 |
| Max. Operating Temperature | 100°C | 100°C |
| PCIe Express Version | Gen 5 | Gen 3 |
| Memory Type & Speed | DDR4, Up to 3200 MHz DDR5, Up to 4800 MHz | DDR4, Up to 2666 MHz Dual-channel |
| Release Date | Jan 4th, 2023 | Apr 30th, 2020 |
Architectural Difference
- Architecture: The Core i5-13400 features Intel’s Raptor Lake architecture, distinguishing itself from the Core i5 10400 based on the Comet Lake architecture.
- Process Node: Starting off, going over process nodes, the Core i5-13400 sets itself apart by employing the advanced Intel 10nm process, whereas the Core i5 10400 utilizes the Intel 14nm process
- Frequency: Furthermore, the Core i5-13400 showcases a frequency of 2.5 GHz and a turbo clock of up to 4.6 GHz. While the Core i5 10400 has a base clock of 2.9 GHz and a turbo clock of up to 4.3 GHz.
- TDP: The Core i5-13400 and Core i5 10400 share a similar thermal design power of 65W, while the Core i5-13400 can operate up to 148W at its turbo power.
In this analysis, we will explore the detailed specifications and differences in performance and features of the Core i5 13400 compared to the Core i5 10400, revealing the upgrades and gains after 3 generations of Intel’s processors.
Gaming Benchmarks
To test the real performance of the Core i5 13400 vs Core i5 10400, we played CPU-intensive games at 1080p resolution. Our aim is to thoroughly evaluate their performance difference in gaming scenarios.
Testing Rig
- GPU: GeForce RTX 4090 24GB
- Motherboard: MSI MEG Z790 ACE MAX Motherboard, MSI Mag Z490 Tomahawk
- Memory: XPG Lancer RGB 32GB 7200MHz DDR5, Patriot Viper LED DDR4-3600 16GB
- CPU Cooler: XIGMATEK Aurora 360 Cooler
- Power Supply: ENERMAX REVOLUTION D.F. X 1050W
- Storage Drive: XPG GAMMIX S70 BLADE 2TB NVMe SSD
1080p
Hogwarts Legacy
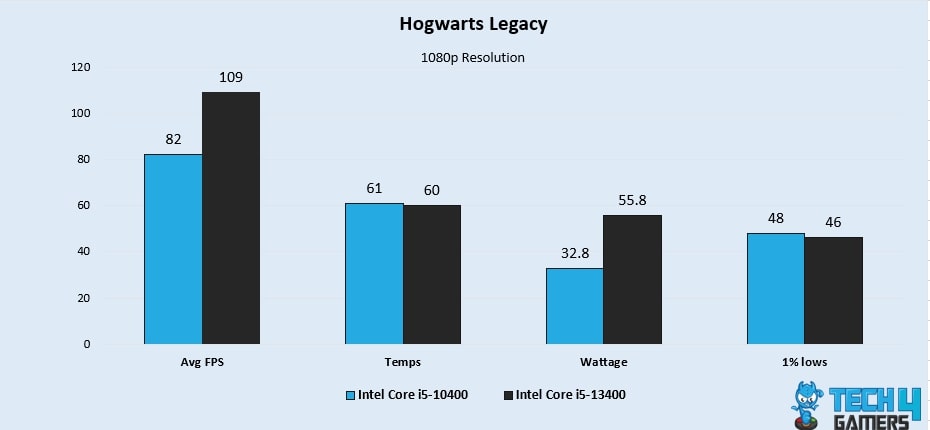
- In our first Hogwarts Legacy gameplay at 1080p, the Core i5 13400 shows its dominance by achieving an average of 109 FPS, surpassing the Core i5 10400’s 82 FPS, resulting in a 28.2% lead.
- In addition, the Core i5 13400 surpasses the Core i5 10400 with a 2.1% advantage in 1% lows, achieving 47 FPS compared to the latter’s 46 FPS.
Fortnite
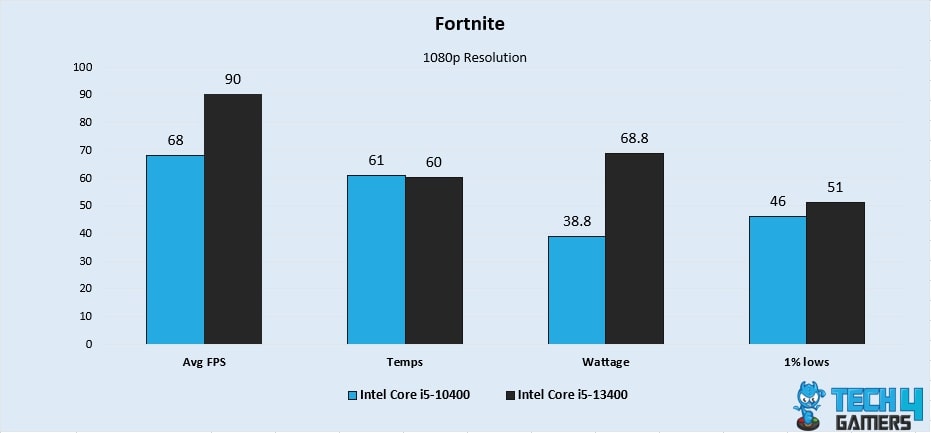
- Taking the lead in Fortnite, the Core i5 13400 outshines the Core i5 10400 with an average FPS of 90, leaving its counterpart trailing at 68, demonstrating a significant 27.8% advantage.
- Furthermore, the Core i5 13400 exhibits superior performance in 1% lows, recording 51 FPS, which results in an impressive difference of 10.3% compared to the Core i5 10400’s 46 FPS.
Mount & Blade 2 Bannerlord
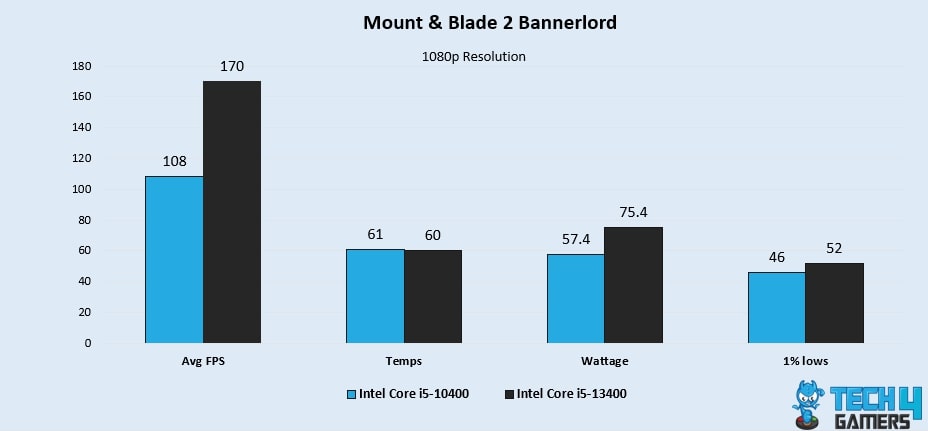
- During our Mount & Blade 2 Bannerlord gameplay at 1080p, the Core i5 13400 delivers an outstanding average FPS of 170, leaving the Core i5 10400’s 108 FPS 44.6% behind.
- Furthermore, the Core i5 13400 showcases remarkable performance in 1% lows, achieving 52 FPS, leading to a significant difference of 12.2% compared to the Core i5 10400’s 46 FPS.
Cyberpunk 2077
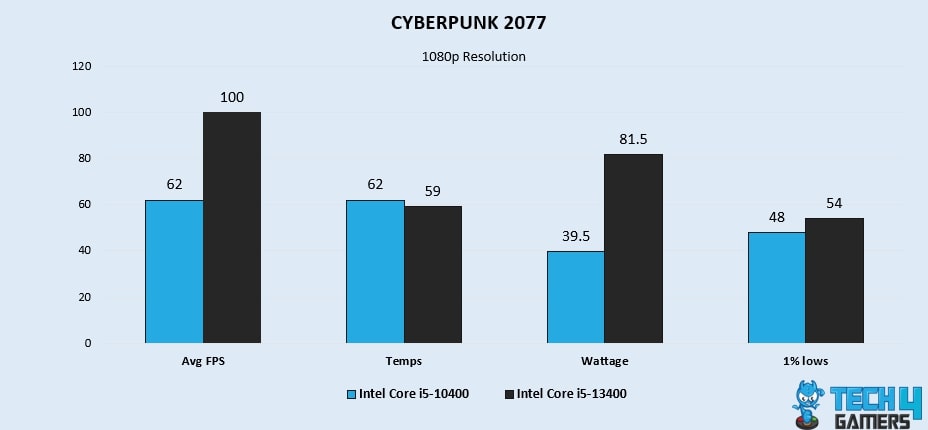
- While playing Cyberpunk 2077, the Core i5 13400 leaves the Core i5 10400 in its wake, achieving an average of 100 FPS, while its competitor falls short at 62 FPS, resulting in a substantial 46.9% disparity.
- Furthermore, the Core i5 13400 outperforms the Core i5 10400 in 1% lows with 54 FPS, showcasing an 11.7% advantage over the latter’s 48 FPS.
Far Cry 6
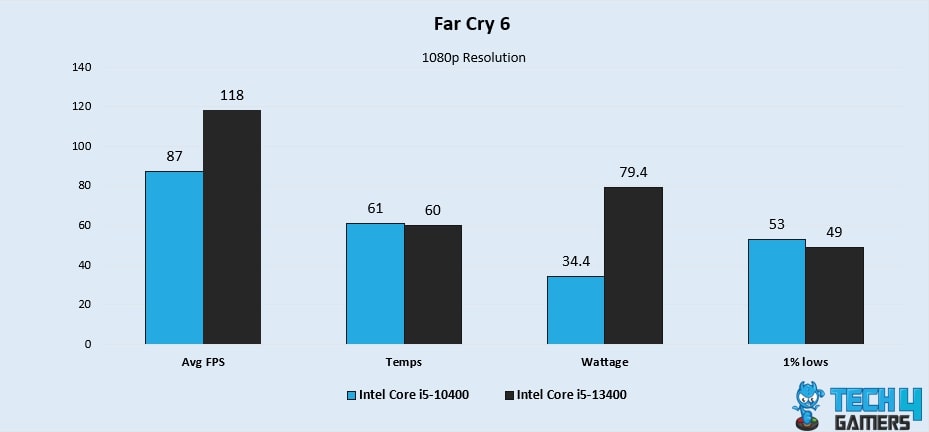
- During our Far Cry 6 session at 1080p, the Core i5 13400 establishes its superiority with an average of 118 FPS, outperforming the Core i5 10400’s 87 FPS, showcasing an impressive 30.2% lead.
- Moreover, the Core i5 13400 delivers improved performance in 1% lows, recording 52 FPS, resulting in a notable difference of 5.9% compared to the Core i5 10400’s 49 FPS.
Overall Gaming Performance

Our gaming benchmarks reveal that the Core i5 13400 outshines the Core i5 10400, delivering an impressive average FPS of 117.4 compared to the latter’s 81.4 FPS across various tested games. Throughout the benchmark testing process, the Core i5 13400 made an average performance lead of 44.2% over the Core i5-10400.
Winner: Intel Core i5-13400
Average Power Consumption
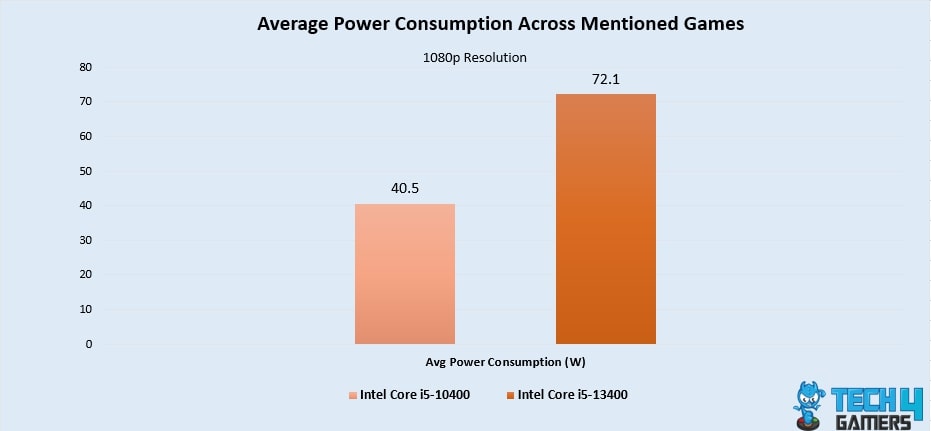
According to our power usage tests, the Core i5 10400 is significantly more power efficient than the Core i5 13400, using 56% less power. The Core i5 13400 consumes 72.1W on average in our gaming session compared to the Core i5 10400’s 40.5W.
Winner: Intel Core i5-10400
Average Thermal Statistics
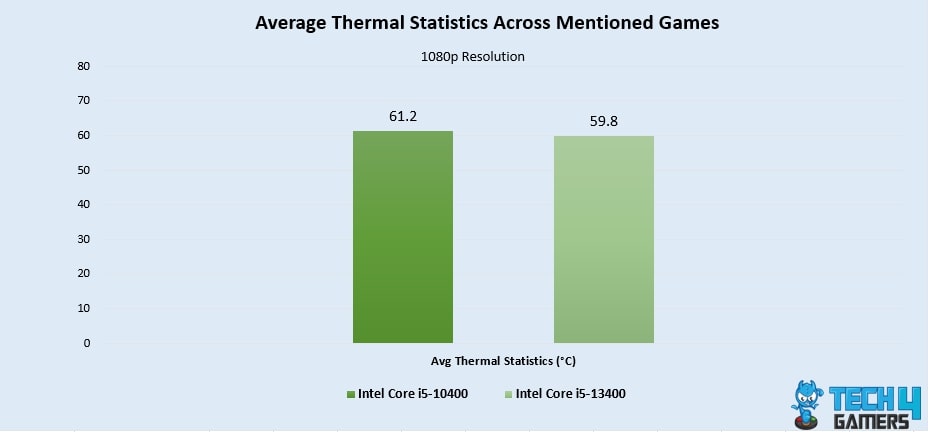
Based on our CPU gaming temperature tests, the Core i5 13400 demonstrated superior thermal performance, maintaining an average temperature of 59.8°C, while the Core i5 10400 fell behind at 61.2°C, showcasing a notable 2.3% difference.
Winner: Intel Core i5-13400
Pricing And Availability
| CPU | Launch MSRP | Current Price |
|---|---|---|
| Intel Core i5-13400 | 💲221 | 💲180 |
| Intel Core i5-10400 | 💲182 | 💲115 |
| Price Difference | 21.4% | 56.5% |
Considering the current prices, the Core i5 10400 costs around 56.5% less than the COre i5 13400, but the performance difference is about 44.3%. So, the Core i5-10400 provides better value. Additionally, the availability of these CPUs may vary depending on the region, so it’s advisable to check reputable retailers or online marketplaces.
Final Verdict: What Do We Recommend?
Intel Core i5 13400: The core i5-13400 is a very good processor from Intel’s 13th generation. It supports DDR5 memory for faster processing, and it is compatible with PCI Gen 5. Its LGA1700 socket is also better than the Core i5 10400’s LGA1200.
Intel Core i5 10400: The Core i5 10400 is a base variant desktop processor from Intel’s 10th generation with good 1080p gaming performance. It uses very little energy, so it’s efficient. Its current price is very low, and its performance justifies it, making it an excellent CPU for low-budget users.
If you are looking for a new processor under $200 with better gaming performance, the Core i5 13400 is a top pick for you.
More From Core i5-13400:
Thank you! Please share your positive feedback. 🔋
How could we improve this post? Please Help us. 😔
[Comparisons Expert]
Shehryar Khan, a seasoned PC hardware expert, brings over five years of extensive experience and a deep passion for the world of technology. With a love for building PCs and a genuine enthusiasm for exploring the latest advancements in components, his expertise shines through his work and dedication towards this field. Currently, Shehryar is rocking a custom loop setup for his built.
Get In Touch: shehryar@tech4gamers.com


