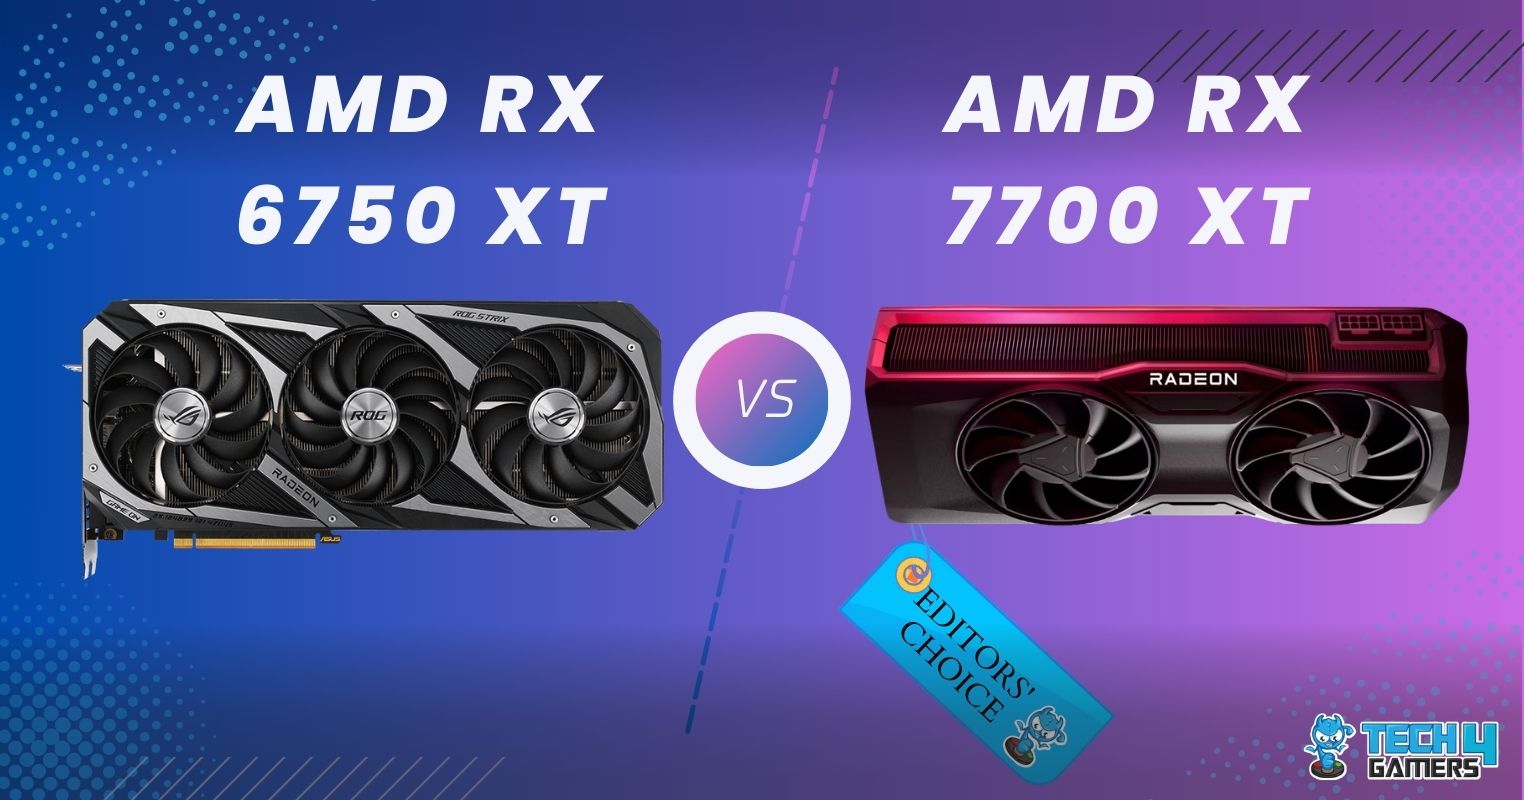
AMD RX 6750 XT
Rated: 8.2/10
AMD RX 7700 XT
Rated: 8.8/10
Pros And Cons
| GPU | Pros | Cons |
|---|---|---|
| AMD Radeon RX 7700 XT | ✅ Great 1080p and 1440p Performance ✅ Effective Temperature Mangement | ❌ Lacks in DXR and AI performance ❌ High Power Draw |
| AMD Radeon RX 6750 XT | ✅ Acceptable Performance for lower current cost ✅ Low Power Consumption | ❌ Launched too Expensive ❌ Ray Tracing not good |
Key Takeaways
- During my 1080p gaming session, the Radeon RX 7700 XT outperforms the Radeon RX 6750 XT by an impressive 11.6% lead in average frame rates.
- The RX 6750 XT consumed 7.1% less energy than the RX 7700 XT in my testing. However, the RX 7700 XT demonstrates a 14.0% superior thermal efficiency.
- In December 2023, the RX 7700 XT costs $449, whereas the RX 6750 XT is selling for only $349.
- The RX 7700 XT offers comparatively better gaming performance, whereas the RX 6750 XT provides budget-friendly performance.
Specifications Table
| Feature | AMD Radeon RX 7700 XT | AMD Radeon RX 6750 XT |
|---|---|---|
| Shading Units | 3456 (Stream Processors) | 2560 (Stream Processors) |
| Ray Tracing Cores | 54 | 40 |
| ROPs | 96 | 64 |
| Base Clock | 1700 MHz | 2150 MHz |
| Boost Clock | Up to 2544 MHz | Up to 2600 MHz |
| Standard Memory Config | 12GB GDDR6 | 12GB GDDR6 |
| GPU TDP | 245W | 250W |
| Launch Date | Sep 06th, 2023 | Mar 23th, 2020 |
| MSRP | $449 | $549 |
| Best Variants | BEST RX 7700 XT Graphics Cards | - |
Architectural Differences
- Architecture: The RX 6750 XT showcases AMD’s cutting-edge RDNA 2.0 architecture, whereas the RX 7700 XT elevates the experience with AMD’s most advanced RDNA 3.0 architecture, offering the latest upgrades.
- GPU Chip: AMD’s RX 7700 XT features a cutting-edge Navi 32 chip crafted through the advanced 5nm manufacturing process at TSMC. In contrast, the RX 6750 XT integrates AMD’s Navi 22 chip, crafted using a 7nm process at TSMC.
- VRAM: The RX 6750 XT and the RX 7700 XT feature the same 192-bit 12GB GDDR6 memory. They have a max memory speed of up to 18 Gbps. Additionally, both GPUs exhibit the same memory bandwidth, peaking at a max of 432 GB/s.
- Clock Speed: Regarding GPU clock speeds, the RX 6750 XT boasts approximately 26.5% greater base clock, along with a turbo clock elevated by 56 MHz or 2.2% more than that of the RX 7700 XT.
- Advanced Technologies: While addressing technological advancements, the RX 7700 XT comes on top with its cutting-edge upscaling FSR 3.0 technology. In contrast, the RX 6750 XT employs the earlier iteration, FSR 2.0.
The RX 7700 XT and the RX 6750 XT represent mid-tier GPUs of the AMD lineup, each from a different generation. These GPUs offer impressive technical specifications and the potential for significant impact in the gaming and professional graphics arenas. In RX 7700 XT vs RX 6750 XT, we will examine the technical and performance characteristics of the two GPUs.
Gaming Benchmarks
As gaming benchmarks are the optimal metric for assessing the performance of graphics cards, let’s subject these GPUs to comprehensive gaming benchmark examinations to gain a more profound understanding of their respective performances. I tested the gaming performance of the RX 7700 XT vs RX 6750 XT by playing 11 demanding games at 1080p.
Test Bench
- OS: Windows 10 Pro
- CPU: AMD Ryzen 7 7800X3D
- Motherboard: GIGABYTE B650 AORUS Elite AX
- RAM: G.Skill Ripjaws S5 6000MHz DDR5
- Storage: XPG GAMMIX S70 BLADE 2TB NVMe SSD
- PSU: ENERMAX REVOLUTION D.F. X 1050W
- CPU Cooler: MSI MAG CORELIQUID E360 CPU Liquid Cooler
Call Of Duty: Modern Warfare II

- In my first gameplay of Call of Duty: Modern Warfare II, I experienced 27.1% enhanced performance employing the RX 7700 XT, yielding an average of 164 FPS, in contrast to the RX 6750 XT’s 129 FPS average.
- Coming to the worst 1% performance matrics, I noted that the RX 6750 XT could only provide 95 FPS, while the RX 7700 XT mustered an amazing 123 FPS.
Counter-Strike 2

- During my assessment of Counter-Strike 2, the RX 7700 XT demonstrated an average FPS of 329, outperforming the RX 6750 XT, which scored 314 FPS by 4.8%.
- Considering the low 1% performance, I observed the RX 6750 XT achieving a remarkable 283 FPS, whereas the RX 7700 XT supplied only 276 FPS.
Cyberpunk 2077

- While playing Cyberpunk 2077, I noted that the RX 7700 XT achieved an average of 38 FPS, surpassing the RX 6750 XT’s 27 FPS performance by 40.7%.
- The worst 1% performance metrics showed that the RX 6750 XT reached only 22 FPS, while the RX 7700 XT excelled with an impressive 31 FPS.
Dota 2

- My testing of Dota 2 revealed that the RX 6750 XT maintained a higher average framerate of 295 FPS, showcasing a 1.7% performance gain over the RX 7700 XT, which recorded 290 FPS.
- In the context of the low 1% framerates, the RX 6750 XT recorded an outstanding 189 FPS, while the RX 7700 XT generated 168 FPS.
Escape From Tarkov

- In my session of Escape from Tarkov, the RX 7700 XT executed an average of 160 FPS, outshining the performance of the RX 6750 XT at 132 FPS by a notable 21.2%.
- Looking at the short 1% of performance metrics, it was evident that the RX 6750 XT struggled with a mere 108 FPS, while the RX 7700 XT excelled at 120 FPS.
F1 2023

- When I evaluated the performance of two GPUs in F1 2023, the RX 7700 XT recorded an average of 243 FPS, showcasing a 20.9% performance boost compared to the RX 6750 XT’s 201 FPS.
- Examining the worst 1% performance results, I noticed that the RX 6750 XT fell short at 164 FPS, whereas the RX 7700 XT showcased an exceptional 193 FPS.
PUBG

- My PUBG gameplay revealed that the RX 7700 XT outperformed the RX 6750 XT, delivering an average of 203 FPS compared to 185 FPS, marking a 9.7% improvement.
- In the worst 1% performance measurements, the RX 6750 XT clocked in at 132 FPS, contrasting with the remarkable 145 FPS achieved by the RX 7700 XT.
Rainbow Six Siege

- In my analysis of Rainbow Six Siege, the RX 7700 XT achieved an average FPS of 371, exhibiting a meaningful 8.5% performance advantage over the RX 6750 XT, which scored 342 FPS.
- Looking closer at the bottom 1% performance figures, the RX 6750 XT struggled with 278 FPS, while the RX 7700 XT demonstrated a remarkable 298 FPS.
Red Dead Redemption 2

- According to my Red Dead Redemption 2 test results, the RX 7700 XT achieved an average of 110 FPS, showcasing a 13.4% performance gain over the RX 6750 XT’s 97 FPS.
- When I evaluated the low 1% performance in Red Dead Redemption 2, the RX 6750 XT yielded only 77 FPS, whereas the RX 7700 XT excelled with an impressive 92 FPS.
Starfield

- While testing Starfield, I observed that the RX 7700 XT achieved an average of 73 FPS, exhibiting a 23.7% performance gain over the RX 6750 XT’s 59 FPS.
- Per my low 1% performance testing, the RX 6750 XT delivered 48 FPS, while the RX 7700 XT demonstrated an outstanding 57 FPS in this game.
The Last Of Us: Part 1

- In my last gameplay of The Last of Us: Part 1, the RX 7700 XT outpaced the RX 6750 XT, registering an average of 96 FPS compared to 80 FPS, paying a 20.0% performance boost.
- When assessing the bottom 1% of performance benchmarks, I observed that the RX 6750 XT only attained 64 FPS, while the RX 7700 XT skyrocketed with an impressive 68 FPS.
The RX 7700 XT excels in gaming due to its advanced architecture and GPU chip, making it a better choice for gamers. On the other hand, the RX 6750 XT provides budget-friendly performance with greater power efficiency, offering a cost-effective alternative. Check out more about the performance of the RX 7700 XT in RX 7700 XT Vs RX 6700 XT.
– Abde Manaf
Overall Gaming Performance

Average FPS
Following a comprehensive evaluation of my gaming benchmarks, I found that the Radeon RX 7700 XT demonstrates exceptional expertise in gaming implementation, achieving a significant average frame rate of 188.8 FPS at 1080p resolution. In contrast, the RX 6750 XT managed a good but lower average of 169.2 FPS.
In direct gaming performance battles, the RX 6750 XT could surpass the RX 7700 XT only in Dota 2. However, when evaluating overall performance based on average frame rates, the Radeon RX 7700 XT defeats the Radeon RX 6750 XT by an impressive performance gain of 11.6%.
You can catch a glimpse of our gameplays to compile these results:
Low 1% FPS
While evaluating the low 1% framerates, the RX 7700 XT demonstrated a commendable average of 142.8 FPS, outperforming the RX 6750 XT’s 132.7 FPS. So, in this sphere of reduced performance, the RX 7700 XT leads the RX 6750 XT by a significant 7.6% margin.
Winner: AMD Radeon RX 7700 XT
Gaming Power Consumption
Considering the critical impact of graphics card power consumption on overall system performance, it’s important to discuss the power usage of the RX 7700 XT vs RX 6750 XT.
| Game | AMD Radeon RX 7700 XT (W) | AMD Radeon RX 6750 XT (W) |
|---|---|---|
| Call of Duty: Modern Warfare II | 210 | 202 |
| Counter-Strike 2 | 201 | 185 |
| Cyberpunk 2077 | 207 | 188 |
| Dota 2 | 198 | 199 |
| Escape from Tarkov | 229 | 216 |
| F1 2023 | 223 | 210 |
| PUBG | 211 | 197 |
| Rainbow Six Siege | 234 | 221 |
| Red Dead Redemption 2 | 215 | 196 |
| Starfield | 194 | 178 |
| The Last of Us: Part 1 | 208 | 184 |
| Average Power Draw | 211.8 | 197.8 |
| Winner: AMD Radeon RX 6750 XT | ||
The actual power consumption of the GPUs differs from expectations. During my 1080p gaming session, the RX 7700 XT had an average power draw of 211.8 watts, while the RX 6750 XT operated with a comparatively lower power draw of 197.8 watts. Thus, the RX 6750 XT is 7.1% more power-efficient than the RX 7700 XT, catering to the needs of 1080p gaming.
Analyzing performance per watt is crucial. In my gaming sessions, the RX 6750 XT delivered 0.8554 FPS per watt on average, while the RX 7700 XT achieved 0.8914 FPS per watt. These statistics show that the RX 7700 XT offers about 4.2% higher performance relative to its power consumption than the RX 6750 XT.
Gaming Temperatures
The following table illustrates the temperatures I recorded for two graphics cards.
| Game | AMD Radeon RX 7700 XT (°C) | AMD Radeon RX 6750 XT (°C) |
|---|---|---|
| Call of Duty: Modern Warfare II | 56 | 64 |
| Counter-Strike 2 | 57 | 67 |
| Cyberpunk 2077 | 50 | 59 |
| Dota 2 | 53 | 62 |
| Escape from Tarkov | 60 | 64 |
| F1 2023 | 61 | 69 |
| PUBG | 58 | 66 |
| Rainbow Six Siege | 51 | 57 |
| Red Dead Redemption 2 | 62 | 68 |
| Starfield | 54 | 65 |
| The Last of Us: Part 1 | 52 | 59 |
| Average Gaming Temperture | 55.8 | 63.6 |
| Winner: AMD Radeon RX 7700 XT | ||
During my gaming session at 1080p resolution, the RX 7700 XT maintained an average temperature of 55.8°C, demonstrating excellent heat regulation. On the other hand, the temperature of the RX 6750 XT was rather higher, reaching a maximum of 63.6°C. Thus, the Radeon RX 7700 XT has better thermal efficiency than the RX 6750 XT, with a significant 14.0% edge in temperature control.
To overcome GPU overheating issues, you can seek valuable tips in our extensive guide on How To Lower GPU Temperature.
Price And Availability
| Graphics Card | MSRP | Current Price |
|---|---|---|
| Radeon RX 7700 XT | 💲 449 | 💲 449 |
| Radeon RX 6750 XT | 💲 549 | 💲 349 |
| Price Difference | 22.2% | 28.6% |
From the initial launch of the RX 6750 XT, there has been a substantial drop in its market value of almost 40%. However, the RX 7700 XT is still selling around its launch MSRP. Concerning market availability, these graphics cards are easily attainable from well-regarded online retailers, including Newegg and Amazon. You can also order them from AMD’s official store.
What Do I Recommend?
Radeon RX 7700 XT: I strongly recommend the RX 7700 XT to anyone looking for better gaming performance. With unmatched performance and thermal capability, this graphics card easily handles challenging workloads and gaming settings.
Radeon RX 6750 XT: To enhance your graphics processing power on a budget, consider the cost-effective RX 6750 XT, which is $100 cheaper than the RX 7700 XT. With standout gaming performance and 7.1% greater energy efficiency, it can also save you on electricity costs.
The key factor lies in aligning your distinctive needs and preferences when contemplating the choice of the RX 7700 XT vs RX 6750 XT.
More From Radeon RX 7700 XT:
More From Radeon RX 6750 XT:
Thank you! Please share your positive feedback. 🔋
How could we improve this post? Please Help us. 😔
[Comparisons Expert]
Abdemanaf is a skilled creative writer who has been honing his craft since 2011. While initially working in different fields, he found a passion for technology and has been exploring the tech world since early 2015. Over the years, he has developed an in-depth knowledge of the latest tech trends and product offerings by various companies.
Abdemanaf’s writing reflects his analytical mindset and ability to think critically. He has a knack for breaking down complex technical information into easily digestible pieces, making his articles engaging and accessible to readers from all backgrounds. In February 2022, he joined Tech4Gamers as a blog and product comparison writer, where he has been able to hone his skills further.
As a writer, Abdemanaf is dedicated to staying up-to-date with the latest technological advancements and trends, enabling him to provide readers with the most relevant and accurate information. He is always eager to learn more and is constantly seeking new challenges to improve his skills.
Get In Touch: manaf@tech4gamers.com


 Threads