


Intel Core i9-12900KS
Rated: 8/10
AMD Ryzen 7 5800X3D
Rated: 7.5/10
Pros & Cons
| CPU | Pros | Cons |
|---|---|---|
| Intel Core i9-12900KS | ✅ High count of cores & threads ✅ High Performance Results | ❌ High priced ❌ Consumes more power |
| AMD Ryzen 7 5800X3D | ✅ Intelligent workload management ✅ Energy-efficient | ❌ Limited overclocking ❌ No support for DDR5. |
- Regarding the performance, we found out that the Core i9-12900KS is just 1.8% faster than the Ryzen 7 5800X3D in our 1080P gaming benchmarks.
- Moreover, the Ryzen 7 5800X3D proved to be 25.6% more power efficient than the i9-12900KS. The Ryzen 7 5800X3D is 8.3% more thermally efficient than its Alder Lake rival.
- Looking at the costs, the Ryzen 7 5800X3D is at least 27% cheaper than the i9-12900KS and will also save you money in the long term as it’s more power efficient.
- We recommend users consider the Core i9 12900KS as it offers a stretch over the competitor with a slightly higher price tag.
Core i9-12900KS vs Ryzen 7 5800X3D: Specifications Comparison
| CPU | Core i9-12900KS | Ryzen 7 5800X3D |
|---|---|---|
| Architecture | Hybrid Core | Zen 4 |
| Codename | Alder Lake | Vermeer |
| Supporting Chipsets | Intel 600 Series Intel 700 Series | AMD 300 Series AMD 400 Series AMD 500 Series |
| Base Clock | 3.40 GHz (P cores) 2.50 GHz (E cores) | 3.4 GHz |
| Boost Clock | 5.20 GHz (P cores) 4.0 GHz (E cores) | 4.5 GHz |
| Memory Support | DDR4 (up to 3200 MT/s) DDR5 (up to 4800 MT/s) | DDR4 (up to 3200 MT/s) |
| Integrated Graphics | Yes | No |
| Max Operating Temperature | 90°C | 90°C |
| Launch MSRP (Current MSRP) | $819-$829 ($419) | $449 ($329) |
| Launch Date (Approximate) | Q1'2022 | Q2'2022 |
| Best CPU Coolers | Best CPU Coolers for Core i9-12900KS | Best CPU Coolers for Ryzen 7 5800X3D |
| Best Motherboard | Best Motherboards for Core i9-12900KS | Best Motherboards for Ryzen 7 5800X3D |
| Best RAM | - | Best RAM for Ryzen 7 5800X3D |
Architectural Differences
- Processing Node: The Core i9-12900KS uses Intel’s 10nm node. Conversely, the Ryzen 7 5800X3D uses TSMC’s node 7nm mentioned above, but the transistor density is similar. So both processors have no advantage over each other regarding the processing node.
- Socket: The Ryzen 7 5800X3D uses the AM4, a PGA socket (the pins are located on the motherboard). It’s the last AMD CPU to be based on the AM4 socket. Conversely, the Core i9-12900KS uses the LGA1700 socket (the pins are located on the CPU itself).
- Cores & Thread Count: Both the CPUs are similar in terms of the number of full-power cores, which is 8. However, the Core i9-12900KS employs 8 extra E-cores. Thus, the i9-12900KS features 16 cores with 24 threads, while AMD’s Ryzen 7 5800X3D is limited to 8 cores and 16 threads.
- Cache: Another major difference between the two CPUs is their L2 and L3 cache counts. Regarding the L2 cache, the Core i9-12900KS has 16MB of it, while the Ryzen 7 5800X3D only has 4MB. However, the Ryzen 7 5800X3D bests the i9-12900KS with its massive 96MB of L3 cache – the Core i9 CPU only has 30MB.
- TDP: The Ryzen 7 5800X3D is rated at a modest 105 watts of TDP at base clocks. Its Intel rival, i9-12900KS, is rated at 150 watts, nearly 43% higher. The i9-12900KS also has a boost TDP rating, which can take the i9-12900KS to a massive 251 watts of power consumption.
Core i9-12900KS vs Ryzen 7 5800X3D: Gaming Benchmarks
Let’s compare the gaming performance of the two graphics cards. We’ll look at their performance across 7 games, all tested at 1080P resolution and ultra (or equivalent preset). A look at the test benches:
Test Bench
- OS: Windows 10 pro
- CPU 1: AMD Ryzen 7 5800X3D
- Motherboard 1: Gigabyte X570 Aorus Pro Wifi
- RAM 1: Patriot Viper LED DDR4-3600 16GB RAM
- CPU 2: Intel Core i9-12900KS
- Motherboard 2: MSI MPG Z790 Carbon WiFi II
- RAM 2: Corsair Dominator Platinum RGB 32GB DDR5 6000MHz RAM
- GPU: GIGABYTE RTX 4090 Gaming OC 24G
- SSD: XPG GAMMIX S70 BLADE 2TB NVMe
- PSU: be quiet! Dark Power Pro 13 1300W
- Cooler: Cosair ICUE H150I Elite
Now, without any further due, let us dive into Core i9-12900KS vs Ryzen 7 5800X3D gaming benchmarks.
Cyberpunk 2077
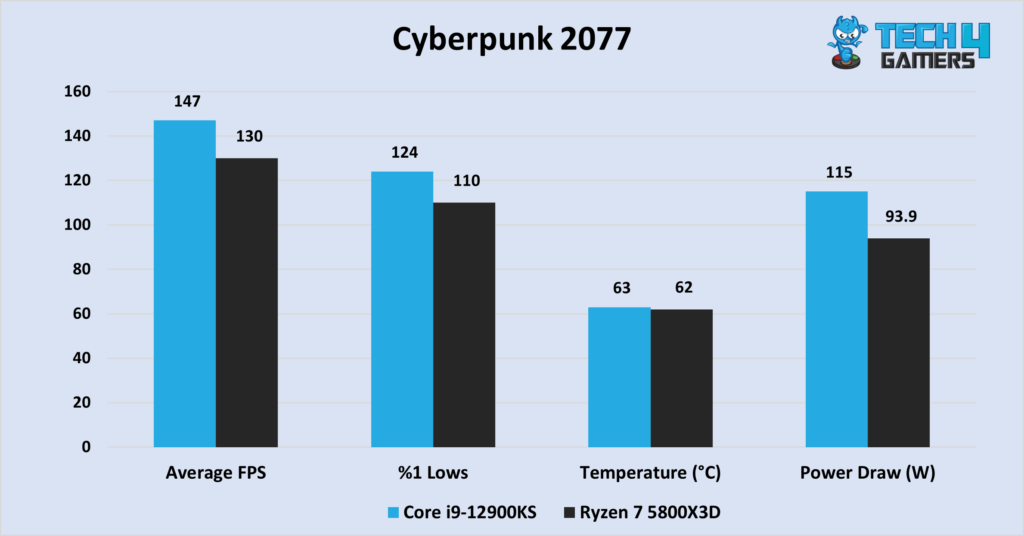
- The i9-12900KS starts with an average of 147 FPS in Cyberpunk 2077. The Ryzen 7 5800X3D trails with 130 FPS – a 13% difference.
- Looking at the %1 low, we observed the i9-12900KS recording 124 FPS, and the Ryzen 7 5800X3D following with a framerate of 110 FPS.
Hitman 3
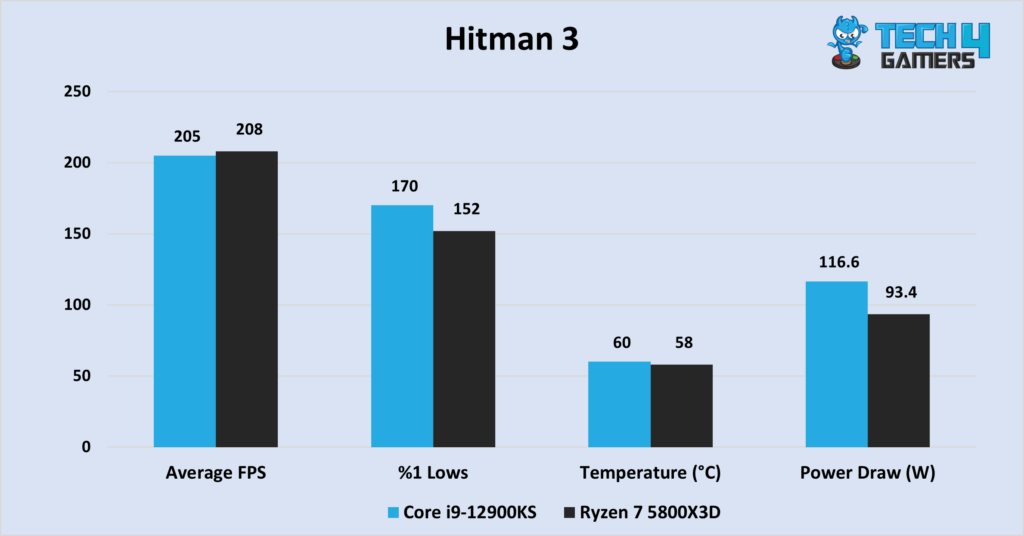
- In our Hitman 3 benchmarks, the Ryzen 7 5800X3D takes the lead here with 208 FPS on average, compared to i9-12900KS’s score of 205 FPS.
- Things take a turn in the %1 low figure. The i9-12900KS scores 170 FPS, while the Ryzen 7 5800X3D trails by 11.8%.
God of War
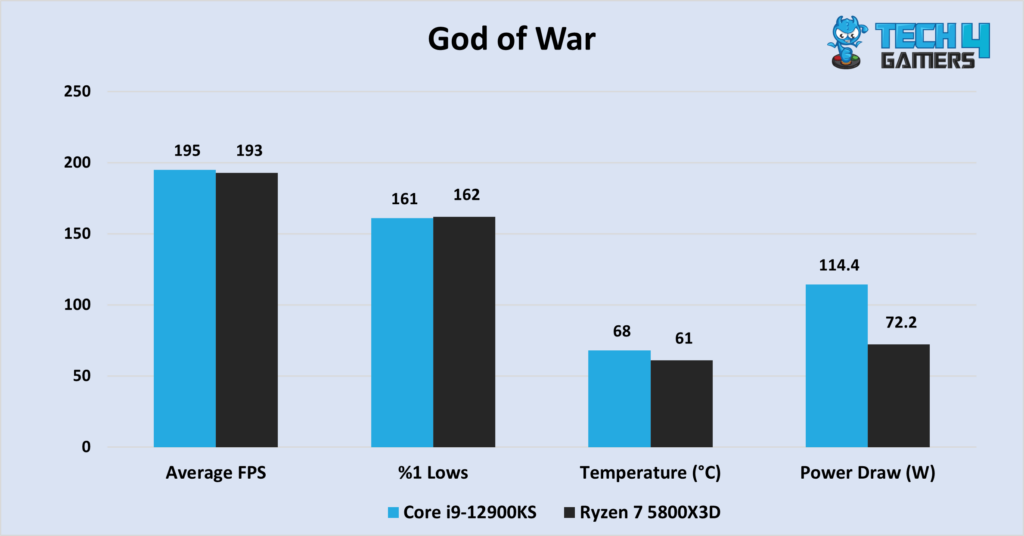
- In God of War, we notice that the two CPUs are neck and neck again. The Core i9-12900KS averages 195 FPS, while AMD’s Ryzen 7 5800X3D averages 193 FPS.
- In terms of our recorded %1 lows, the Ryzen 7 5800X3D betters its Intel rival by just 1 FPS.
Far Cry 6
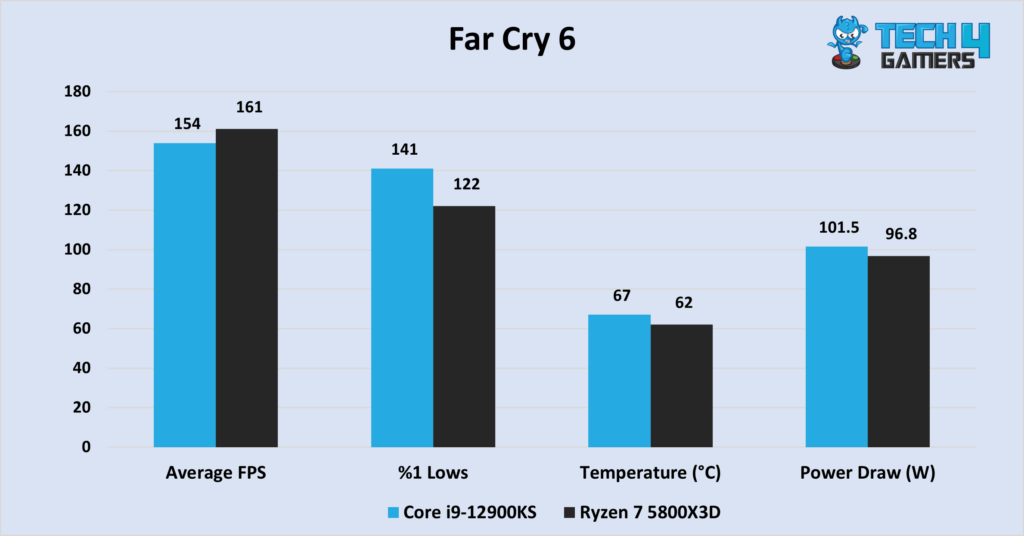
- Our next benchmark test was the Far Cry 6, where the Ryzen 7 5800X3D averages 161 FPS compared to the Core i9-12900KS, which scores 154 FPS.
- Again, the i9-12900KS turns the tables in terms of the %1 low figures, recording 141 FPS. The Ryzen 7 5800X3D scores 122 FPS.
Assassin’s Creed: Valhalla
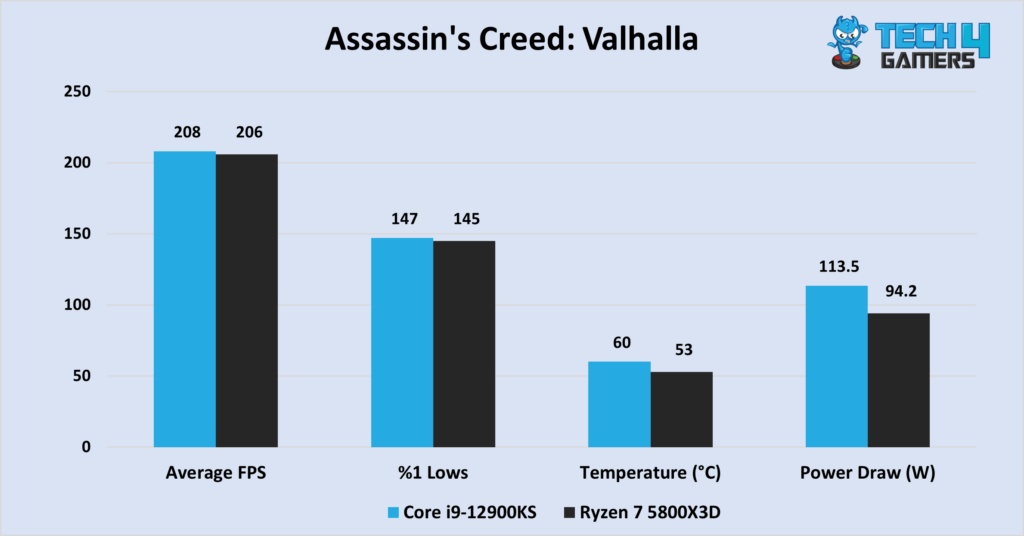
- In Assassin’s Creed Valhalla, yet again, the two CPUs show similar performance. The i9-12900KS averages 208 FPS compared to the 206 FPS of the Ryzen 7 5800X3D.
- The i9-12900KS scores 147 FPS when it comes to the %1 low. We also saw that the Ryzen 7 5800X3D trails just behind with 145 FPS.
Horizon Zero Dawn
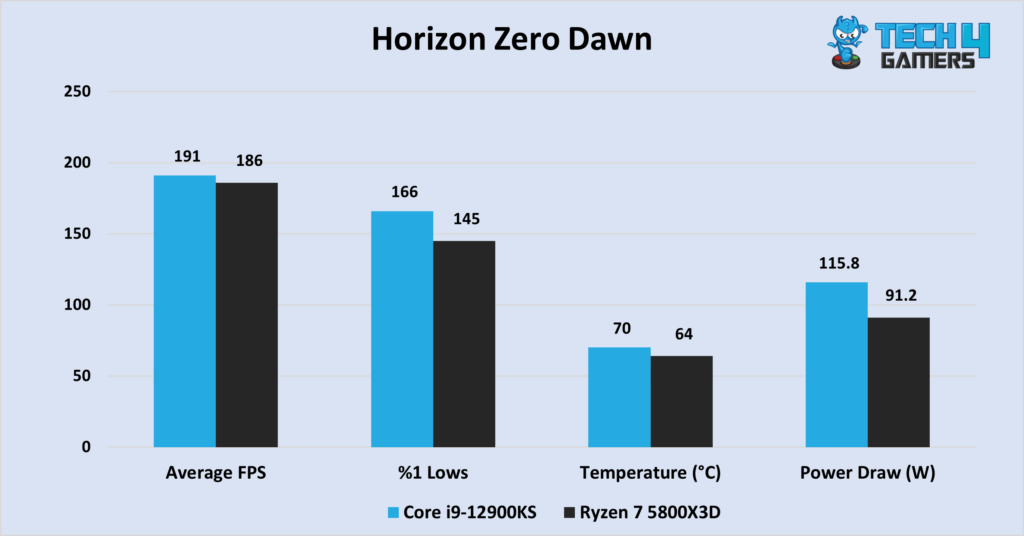
- The Core i9-12900KS averages 191 FPS in our Horizon Zero Dawn benchmark. The Ryzen 7 5800X3D fights back with 186 FPS, much to our surprise.
- In terms of the %1 low, we witnessed the usual scenario where the i9-12900KS is 14.4% faster than its AMD Ryzen competitor.
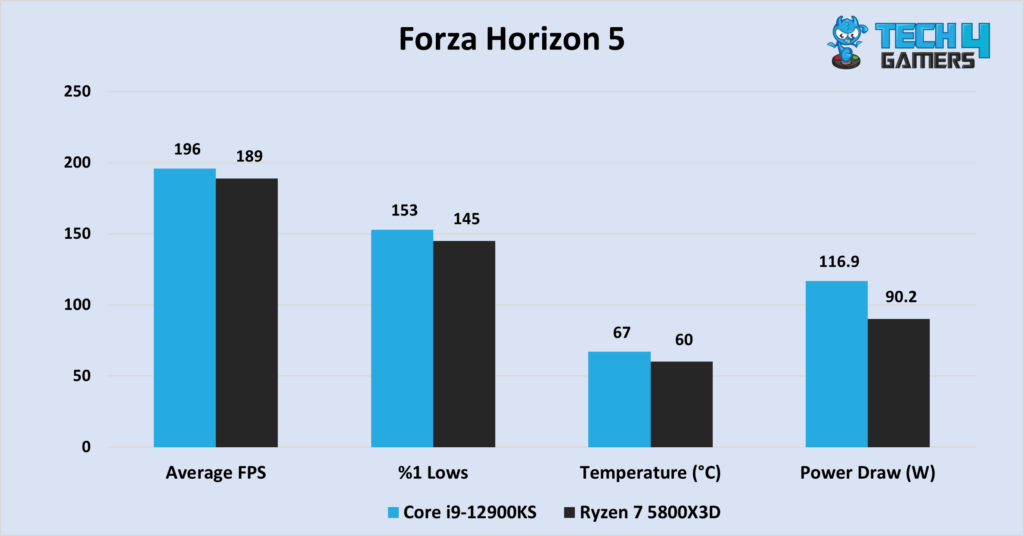
- The last benchmark we ran was Forza Horizon 5, in which the i9-12900KS took another marginal lead, with 196 FPS on average. The Ryzen 7 5800X3D scores 189 FPS in reply.
- The Ryzen 7 5800X3D manages 145 FPS as far as the %1 low score is concerned. The i9-12900KS scores 153 FPS.
Overall Gaming Performance
| Processor | Average FPS | 1% Lows |
|---|---|---|
| Core i9-12900KS | 📈 185.1 | 📉 181.8 |
| AMD Ryzen 7 5800X3D | 📈 151.7 | 📉 140.1 |
| Winner: Intel Core i9-12900KS | ||
Observing the gaming performance in our benchmarks, we saw that the Core i9-12900KS is, therefore, 1.8% faster than the Ryzen 7 5800X3D in 1080P gaming. Moreover, in terms of the %1 low, the i9-12900KS scores 151.7 FPS, and the Ryzen 7 5800X3D recorded 140.1 FPS. Thus, the i9-12900KS has a bigger lead here at 8.2%.
Average Power Consumption
| Processor | Intel Core i9-12900KS | AMD Ryzen 7 5800X3D |
|---|---|---|
| Average Power Consumption | 113.3 ⚡️ | 90.2 ⚡️ |
| Winner: AMD Ryzen 7 5800X3D | ||
Next, we noticed that the i9-12900KS had a TDP rating of 150 watts, and the Ryzen 7 5800X3D rated at 105 watts. (42.8% higher). Consequently, the Ryzen 7 5800X3D is 25.6% more power efficient than the Core i9-12900KS in 1080P gaming. Both the CPUs were fairly underutilized in 1080P gaming, drawing much less than their TDP ratings.
Average Thermal Performance
| Processor | Intel Core i9-12900KS | AMD Ryzen 7 5800X3D |
|---|---|---|
| Average Power Consumption | 65 🌡️ | 60 🌡️ |
| Winner: AMD Ryzen 7 5800X3D | ||
Regarding the thermal efficiencies of the processors across our benchmarks, Intel’s Core i9-12900KS ran at 65°C on average. As for the Ryzen 7 5800X3D, it ran much cooler at 60°C. Thus, the benchmarks have shown us that the Ryzen 7 5800X3D is 8.3% more thermally efficient in 1080P gaming.
CPU, Power, And Platform Costs
| Processor | Launch MSRP | Current Price |
|---|---|---|
| Intel Core i9-12900KS | 💲 829 | 💲 405 |
| AMD Ryzen 7 5800X3D | 💲 449 | 💲 315 |
| Price Difference | 84.63% | 31.74% |
Looking at the current market prices, we analyzed that the Ryzen 7 5800X3D was about 31.74% more economical than the Intel Core i9 12900KS. This puts the Ryzen processor forward for users looking to incorporate good results, coupled with better power and thermal efficiencies in an economical budget.
Core i9-12900KS vs Ryzen 7 5800X3D: Final Thoughts
Intel Core i9 12900KS: The Core i9-12900KS has a 42.8% higher base TDP rating than the Ryzen 7 5800X3D and drew 25.6% more power during the 1080P benchmarks. However, it had a brilliant output in our benchmarks, which tilts the scales in its favor for users looking for premium performance.
AMD Ryzen 7 5800X3D: Conversely, we noticed promising results from the Ryzen 7 5800X3D, despite being far behind the Core i9 12900KS. However, what lagged in its framerates was made up by the lower power and thermal levels, ensuring an economical choice for budget-conscious users.
As we’ve discussed, there are plenty of differences between them, and you should take note of all of them before making a choice. However, we recommend the Intel Core i9 12900KS for users looking to get all the framerates they can get. Although they have to pay higher for it
Frequently Asked Questions
Yes. The Core i9-12900KS has support for both DDR4 and DDR5 memory. You only need to make sure you get a DDR4-supporting motherboard.
No. The Ryzen 7 5800X3D does not have integrated graphics and requires a dedicated graphics card.
More From Ryzen 7 5800X3D:
- Ryzen 7 5800X3D Vs. Core i5-13600K
- Ryzen 7-5800X3D Vs Core i9-12900K
- Ryzen 7 5800X3D vs Ryzen 9 5900X
More From Core i9-12900KS:
- Core i9-12900KS Vs Core i7-13700K
- Core i9-12900KS Vs Core i9-13900K
- Core i9-12900K Vs Core i9-13900K
Thank you! Please share your positive feedback. 🔋
How could we improve this post? Please Help us. 😔
[Comparisons Expert]
Abdemanaf is a skilled creative writer who has been honing his craft since 2011. While initially working in different fields, he found a passion for technology and has been exploring the tech world since early 2015. Over the years, he has developed an in-depth knowledge of the latest tech trends and product offerings by various companies.
Abdemanaf’s writing reflects his analytical mindset and ability to think critically. He has a knack for breaking down complex technical information into easily digestible pieces, making his articles engaging and accessible to readers from all backgrounds. In February 2022, he joined Tech4Gamers as a blog and product comparison writer, where he has been able to hone his skills further.
As a writer, Abdemanaf is dedicated to staying up-to-date with the latest technological advancements and trends, enabling him to provide readers with the most relevant and accurate information. He is always eager to learn more and is constantly seeking new challenges to improve his skills.
Get In Touch: manaf@tech4gamers.com


