 Threads

Previously, we conducted a comparison between AMD’s RX 7900 XTX and NVIDIA’s 4070 Ti, where the former had shown superior performance over the latter. In this analysis, we will shift our focus toward NVIDIA’s previous graphics card generations and compare the GeForce RTX 2060 vs GTX 1660 Ti.
Key Takeaways
- The RTX 2060 had a 15.9% higher performance on average than the GTX 1660 Ti in our testing.
- Moreover, we found the GTX 1660 Ti consumed 32.9% less power than the RTX 2060 in our benchmarks on average.
- In addition, the GTX 1660 Ti remained 8.8% cooler than our RTX 2060 in our performance testing.
Comparison Table
| Technical Specs | GeForce RTX 2060 | GeForce GTX 1660 Ti |
|---|---|---|
| GPU Name | TU106 | TU116 |
| Architecture | Turing | Turing |
| CUDA Cores | 1920 | 1536 |
| Tensor Cores | 240 | NA |
| RT Cores | 30 | NA |
| TMUs | 120 | 96 |
| ROPs | 48 | 48 |
| Suggested PSU | 450 W | 300 W |
| Release Date | Oct 17th, 2018 | Feb 22nd, 2019 |
Architectural Difference
- Process Node: Both cards have the same 12nm processing nodes, which are far from the cutting edge today.
- Clock Speed: The base clock of the RTX 2060 is around 1365MHz, while the GTX 1660 Ti has a base of around 1500MHz. The boost clock is also higher on the GTX card, around 1770MHz than the 1680MHz on the RTX 2060.
- VRAM: Both graphics cards come with 6GB of GDDR6 VRAM, with a bus width of 192-bit.
- TDP: The RTX 2060 sucks back more power than the GTX 1660 Ti, 160 watts instead of 120 watts.
- Other Features: The RTX family of graphics cards brought a slew of features with them, which include hard-accelerated ray tracing and DLSS AI upscaling.
Gaming Performance
Now that we have gone through the hardware specifications of the GeForce RTX 2060 vs GTX 1660 Ti, it’s time to take a deeper dive into their real-world performance when it comes to modern gaming.
A comprehensive and thorough analysis will help us evaluate the strengths and limitations of both graphics cards in various modern games and ultimately determine which one comes out on top.
Testing Rig
Here are the specs of the testing rig:
- OS: Windows 11
- CPU: Intel Core i7-13700K
- Motherboards: ASRock Z790 Taichi Lite Motherboard
- RAM: Kingston Fury Renegade RGB DDR5 32GB 7200MHz
- SSD: XPG GAMMIX S70 BLADE 2TB NVMe SSD
- PSU: Enermax Revolution D.F. X 1050W
- CPU Cooler: MSI MAG CORELIQUID E360 CPU Liquid Cooler
Death Stranding
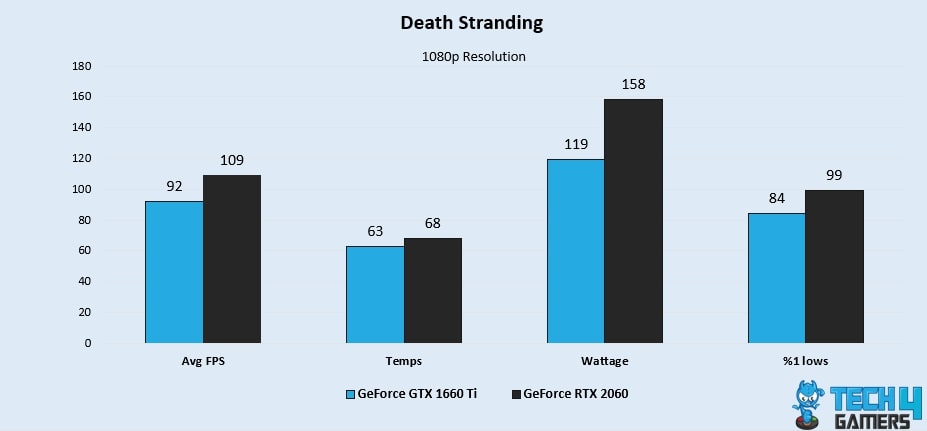
- In our performance testing, Death Stranding had a 16.9% higher performance on the RTX 2060 at an average framerate of 109 FPS, while the GTX 1660 Ti had an average framerate of around 92 FPS.
- Furthermore, the RTX 2060 displays a superior 1% low performance in comparison to the GTX 1660 Ti, indicating a 16.3% boost with 99 FPS over 84 FPS.
Red Dead Redemption 2
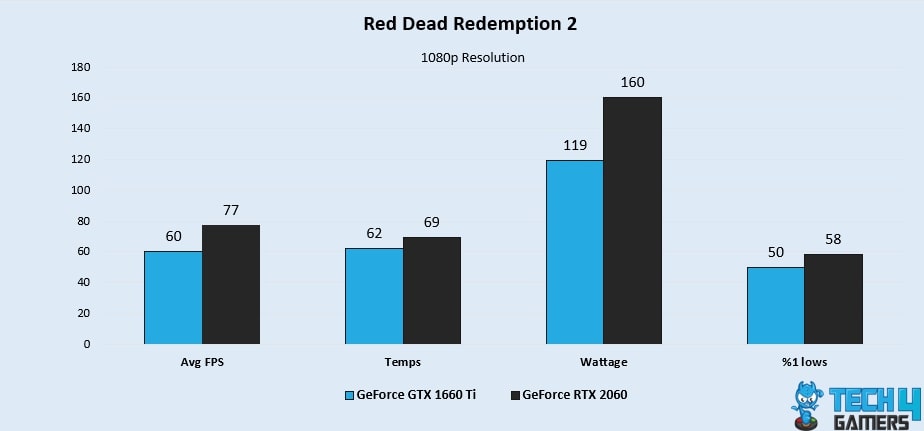
- Travelling through the forests of Red Dead Redemption 2 had a performance of 77 FPS on average on the RTX 2060, while the GTX 1660 Ti had an average performance of 60 FPS, which comes to a 24.8% performance uplift for the RDR 2.
- The RTX 2060 showed lows of around 58 FPS, while the GTX 1660 Ti had a minimum performance of 50 FPS, which computes a 14.8% advantage for the RTX card.
Doom Eternal
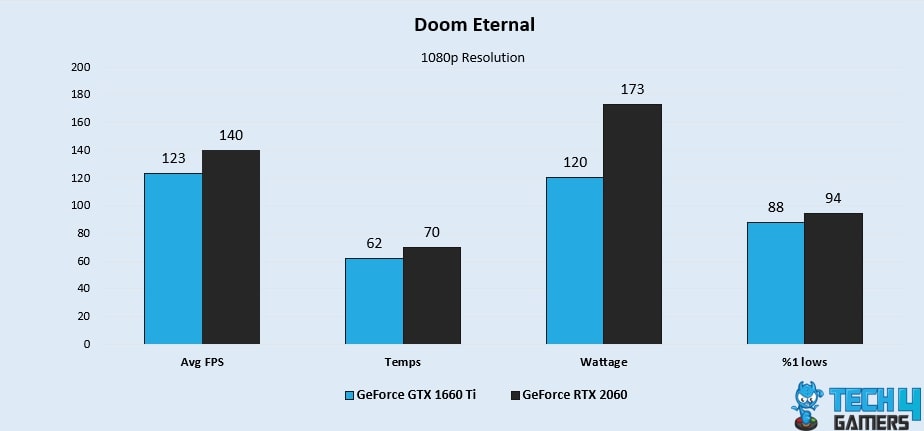
- There was a difference of around 12.9% in our test of Doom Eternal, with the RTX 2060 being in the advantage with an average framerate of 140 FPS, while the GTX 1660 Ti had a performance of 123 FPS.
- In addition, the RTX 2060 outshines the GTX 1660 Ti in 1% low performance, resulting in a 6.5% improvement with 94 FPS compared to 88 FPS.
Star Wars Jedi Fallen Order
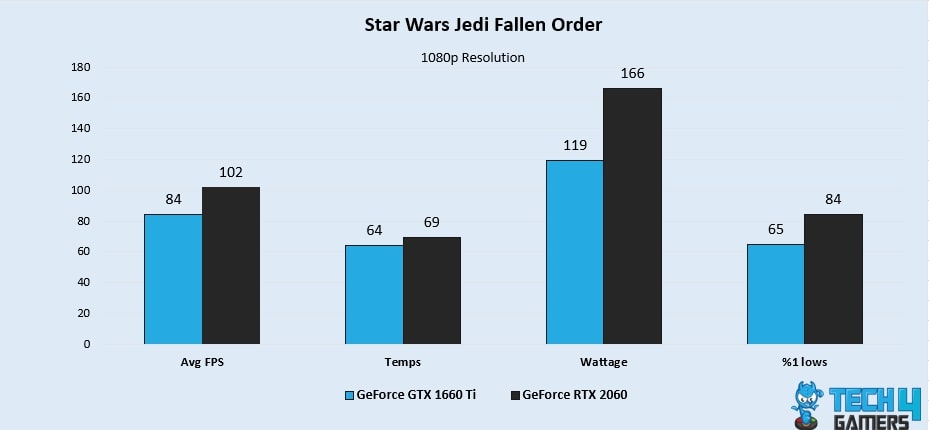
- The large performance gap continued in our test of Star Wars Jedi: Fallen order, with the RTX 2060 being in a lead of around 19.3% in this game. The average for this card was around 102 FPS, while the GTX 1660 Ti had an average of only 84 FPS.
- This also translated into a 25.5% difference in 1% lows, with the RTX 2060 dipping to around 84 FPS, while the GTX 1660 Ti got down to around 65 FPS.
Warzone
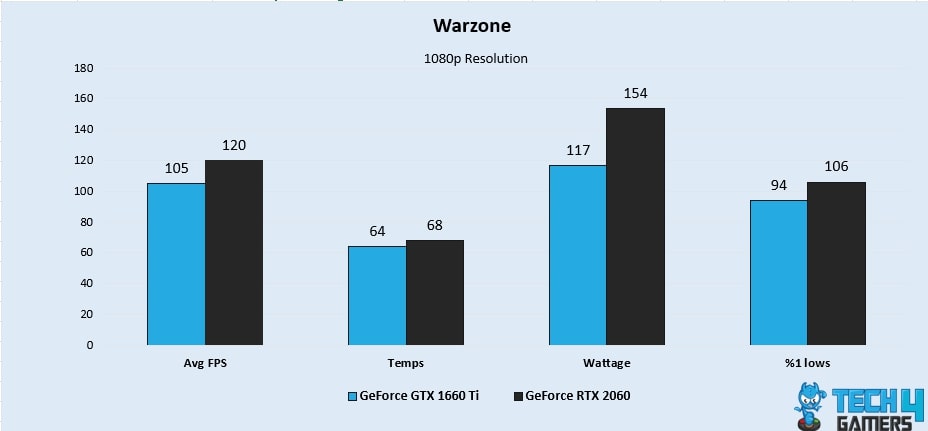
- Warzone held a 13.3% advantage for the RTX 2060 in our test of the game, with an average framerate of 120 FPS, while the GTX 1660 Ti had an average of 105 FPS.
- 1% lows showed a 12% difference between the two cards, with the RTX 2060 going down to around 106 FPS, while the GTX 1660 Ti had a minimum framerate of around 94 FPS.
Battlefield V
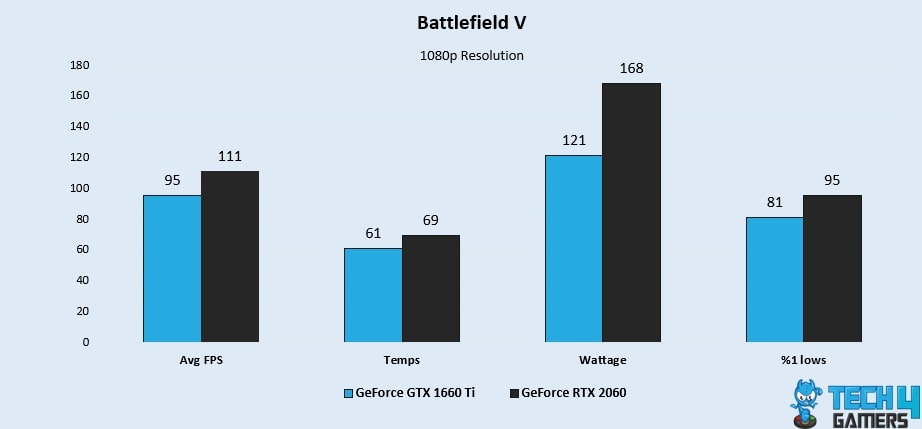
- The beatdown on the 1660 Ti continued into our run of Battlefield V, with an average framerate of 95 FPS for the aforementioned card, while the RTX 2060 had a performance of 111 FPS on average. This comes out to a 15.5% advantage for the RTX 2060.
- Furthermore, the RTX 2060 offers a stronger 1% low performance than the GTX 1660 Ti, with a 15.9% boost in 95 FPS as opposed to 81 FPS.
Fortnite
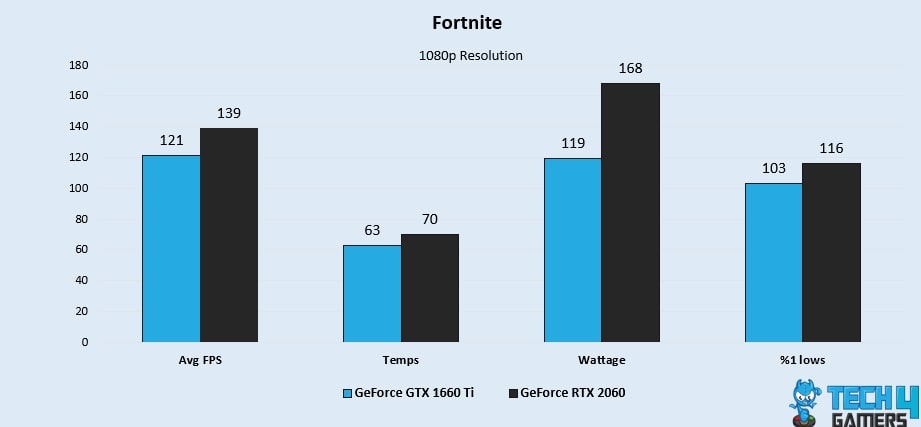
- Our benchmark of Fortnite Battle Royal also had a 13.8% performance advantage on the RTX 2060. The mentioned card had an average framerate of around 139 FPS, while the GTX 1660 Ti had an average of around 121 FPS.
- 1% lows were also 11.8% stronger on the RTX 2060, with a minimum of 116 FPS, while the GTX 1660 Ti had a minimum framerate of 103 FPS.
F1 2020
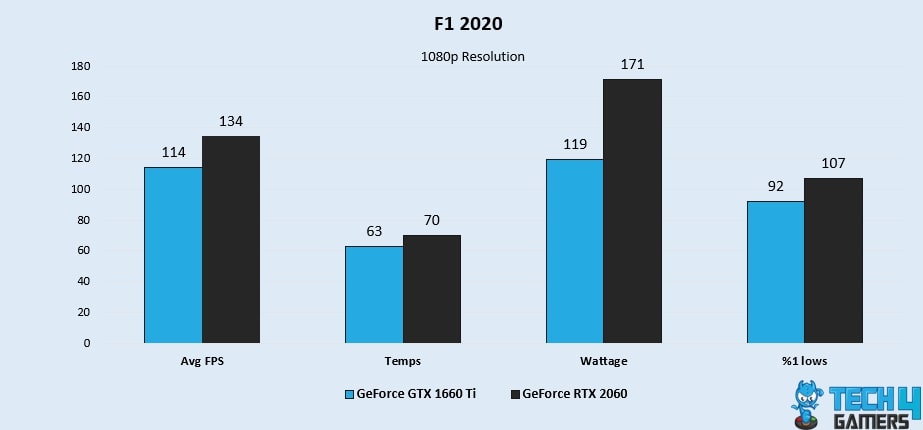
- The GTX 1660 Ti took another loss in our test of F1 2020, with an average performance of 114 FPS, while the RTX 2060 had a performance of around 134 FPS on average, which equates to a 16.1% average.
- The lows were around 15% higher on the RTX 2060 at 107 FPS, while the GTX 1660 Ti had lows of around 92 FPS.
Rainbow Six Siege
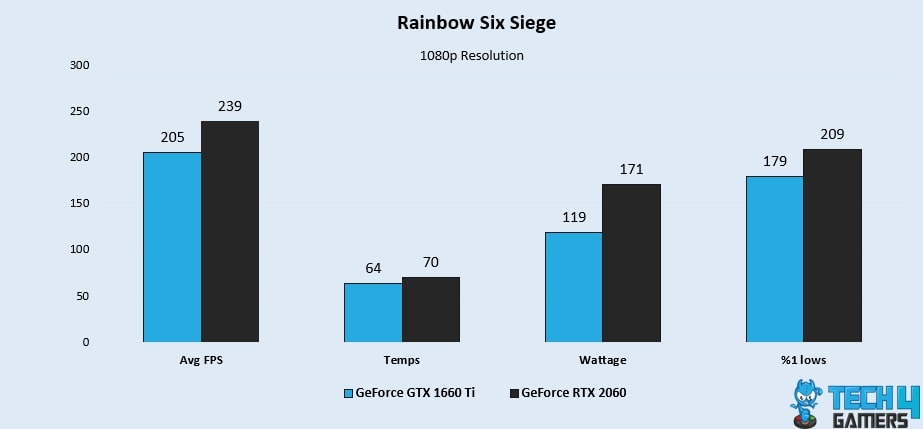
- The RTX 2060 had an average framerate of around 239 FPS, while the GTX 1660 Ti had a performance of 205 FPS in our test of Rainbow Six Siege. This difference comes out to around a 15.3% advantage for the RTX 2060.
- Additionally, the GTX 1660 Ti trails behind the RTX 2060 in 1% low performance, demonstrating a 15.4% drop in 179 FPS compared to 209 FPS.
Shadow of The Tomb Raider

- Finally, the last game of our test also had the RTX 2060 winning by a substantial margin. The RTX 2060 had an average framerate of 98 FPS, while the GTX 1660 Ti had an average of 83 FPS. This comes out to a difference of 16.5%.
- Moreover, the RTX 2060 exhibits a stronger 1% low performance than the GTX 1660 Ti, with an improvement of 17% in 89 FPS versus 75 FPS.
Overall Gaming Performance
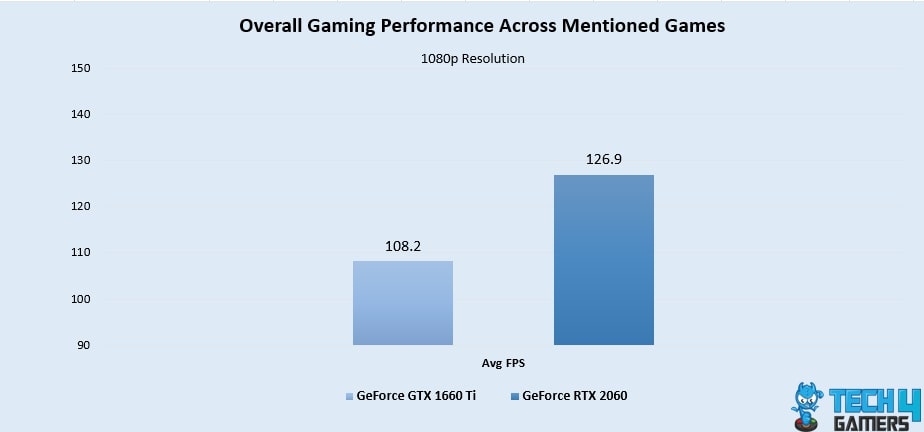
Our benchmarks showed that the RTX 2060 had an average framerate of 126.9 FPS, which is around 17.5% greater than the GTX 1660 Ti’s 108.2 FPS average.
The RTX 2060 clearly wins in terms of gaming performance in our tests, as the difference in 1% lows also sustained around the same difference as the averages. This came out as the GTX 1660 Ti being relatively much more choppy, significantly reducing the enjoyment of games.
Average Power Consumption
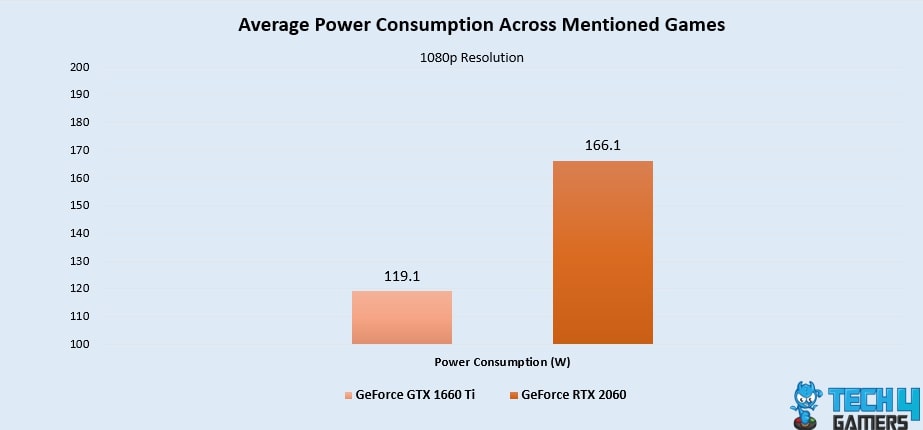
On average, in our tests, the GTX 1660 Ti consumed around 119 watts of power, while the RTX 2060 took back around 166 watts. This comes out to a difference of around 32.9%, which is very significant.
A major drawback to the RTX 2060’s higher power consumption is the increased power bill it induces, meaning going for the GTX 1660 Ti will result in significant savings over the lifespan of that card in your system.
Average Thermal Statistics
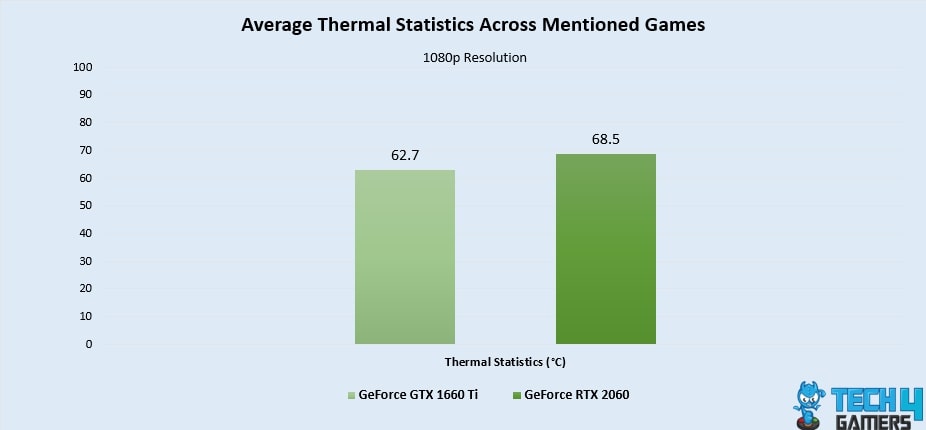
The RTX 2060 also ran significantly hotter than the GTX card in our testing, averaging a temperature of around 68.5°C, which is around 8.8% greater than the 62.7°C temperature that the GTX 1660 Ti had on average.
The temperatures of your graphics card are highly dependent on various factors, specifically in the setup you use, so the difference might be less or more apparent in your experience.
Pricing And Availability
As of late November 2023, the RTX 2060 has a price tag of around $170 on the used market, while the GTX 1660 Ti goes for around $140. The price point of these cards makes them excellent starter graphics cards for 1080p gaming.
As for availability, these cards are being phased out by most retailers because of their age, but there is plenty of supply in the used market.
What We Recommend
Now that we have a point of reference to judge the RTX 2060 vs GTX 1660 Ti, this section of the comparison will highlight the winner of our comparison.
Going through all the points of the comparison, the RTX 2060 comes out as the obvious victor. It costs about the same as the GTX 1660 Ti while giving a significant boost in performance.
In addition to this, the use of DLSS upscaling in this card makes it very hard to make a case for its competitor.
Pros And Cons
| GPU | Pros | Cons |
|---|---|---|
| GeForce RTX 2060 | Better performance than the GTX 1070 Ti Sleek design for the Founders Edition | More expensive than the last gen GPUs |
| GeForce GTX 1660 Ti | High performance at 1920 x 1080 resolution Reasonable price point | No RTX ray tracing features are available |
More From RTX 2060
More From GTX 1660 Ti
Thank you! Please share your positive feedback. 🔋
How could we improve this post? Please Help us. 😔
[Comparisons Expert]
Shehryar Khan, a seasoned PC hardware expert, brings over five years of extensive experience and a deep passion for the world of technology. With a love for building PCs and a genuine enthusiasm for exploring the latest advancements in components, his expertise shines through his work and dedication towards this field. Currently, Shehryar is rocking a custom loop setup for his built.
Get In Touch: shehryar@tech4gamers.com


