 Threads

In our recent comparison, we put the latest RTX 4070 Ti against the RX 7900 XTX and saw the latter providing an 11% boost. But this time, we will be putting the older models on the table and see which card comes out on top during the RX 5700 XT vs RTX 3080 benchmark tests.
Key Takeaways
- Starting off, The Radeon RX 5700 XT is based on the older RDNA 1.0 architecture. In contrast, the GeForce RTX 3080 is built on NVIDIA’s Ampere design.
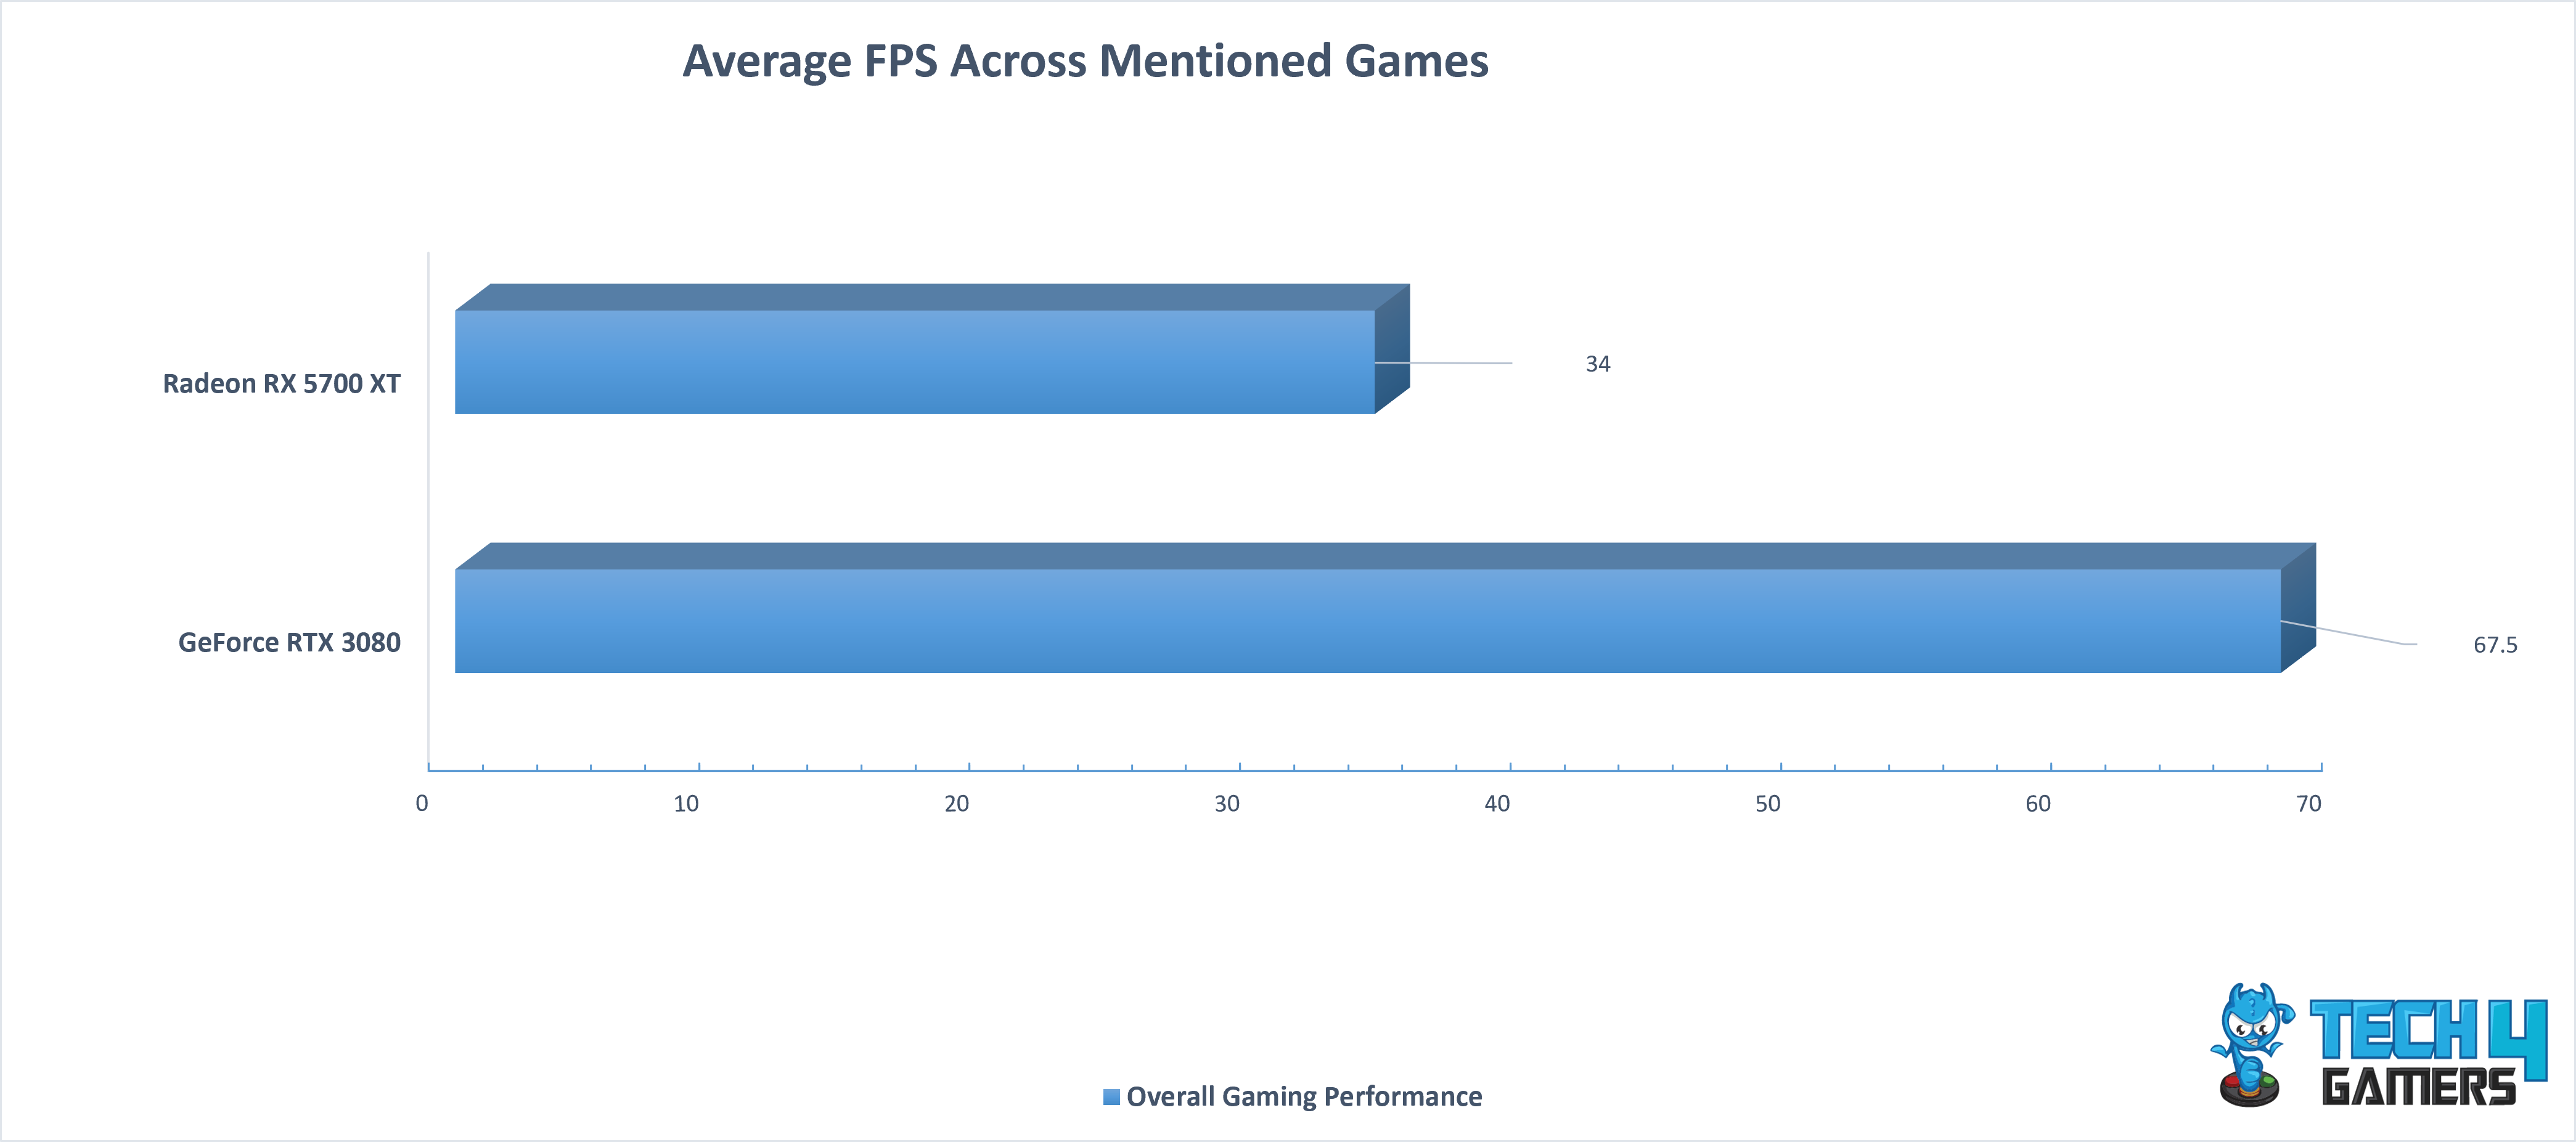
- During our benchmarks, the average FPS for the Radeon RX 5700 XT was 34, while the NVIDIA RTX 3080 ran at 67.5 FPS, giving the RTX 3080 a significant 66% advantage in gaming performance.
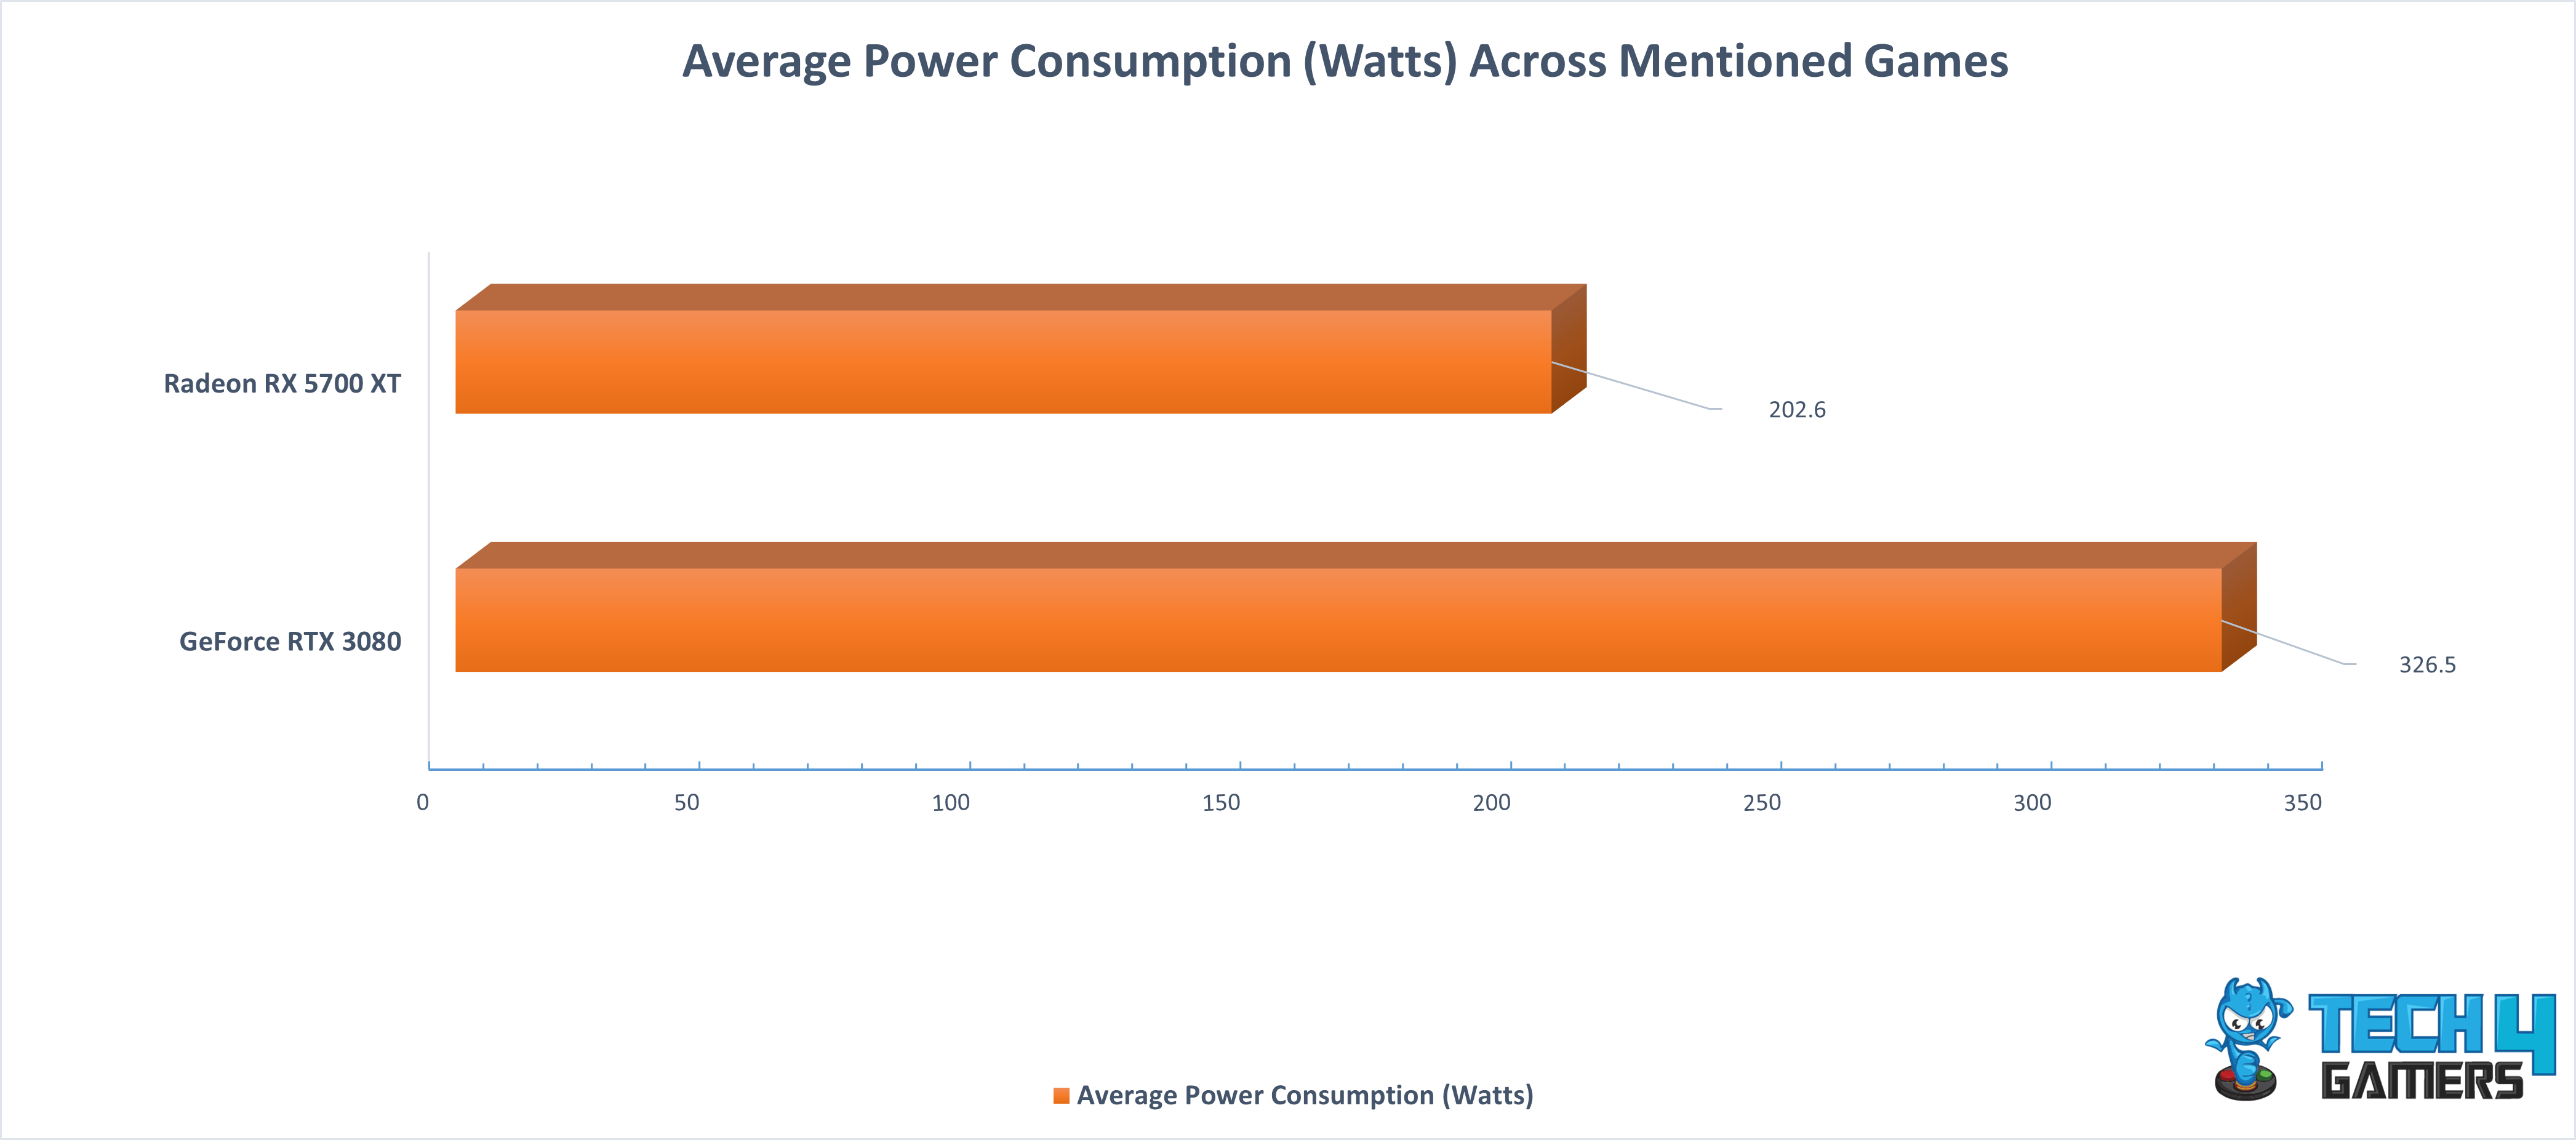
- According to our testing results, the Radeon RX 5700 XT is approximately 46.8% more power-efficient than the GeForce RTX 3080, consuming less power.
-
Moreover, the RX 5700 XT maintained 13.9% higher thermal efficiency than the GeForce RTX 3080, as per our benchmark results.
Comparison Table
| Technical Specs | GeForce RTX 3080 | Radeon RX 5700 XT |
| GPU Name | GA102 | Navi 10 |
| Architecture | Ampere | RDNA 1.0 |
| Transistors | 28,300 million | 10,300 million |
| Shading Units | 8704 | 2560 |
| Tensor Cores | 272 | NA |
| RT Cores | 68 | NA |
| TMUs | 272 | 160 |
| ROPs | 96 | 64 |
| L1 Cache | 128 KB (per SM) | TBD |
| L2 Cache | 5 MB | 4 MB |
| Memory Bus Width | 320 bit | 256 bit |
| Memory Bandwidth | 760.3 GB/s | 256.0 GB/s |
| Suggested PSU | 700W | 550W |
| Release Date | Sep 1st, 2020 | Jul 7th, 2019 |
| Approximated Price | 800 USD | 140 USD |
| Best Variants | BEST RTX 3080 Cards | – |
Architectural Differences
- Process Node: The RX 5700 XT utilizes a 7nm process node, while the RTX 3080 employs an 8nm process node, showcasing differences in semiconductor technology.
- Clock Speed: The RX 5700 XT boasts clock speeds of 1605 MHz Base and 1905 MHz Boost, whereas the RTX 3080 operates at 1440 MHz Base and 1710 MHz Boost, impacting performance and responsiveness.
- VRAM: With 8GB of GDDR6 VRAM, the RX 5700 XT provides ample memory for gaming and graphics tasks, while the RTX 3080 offers a more substantial 10GB of faster GDDR6X VRAM, ideal for demanding workloads.
- TDP: The RX 5700 XT has a 225W TDP, showcasing its power efficiency, while the RTX 3080 consumes more power with a 320W TDP, affecting energy consumption and thermal output.
- Supported Technologies: The RX 5700 XT implies the usage of FidelityFX Super Resolution (FSR) for improved visual fidelity, while the RTX 3080 features Deep Learning Super Sampling (DLSS) for enhanced gaming experiences.
RX 5700 XT Vs RTX 3080: Gaming Benchmarks
After thoroughly discussing the critical aspects of the graphics cards, it’s time to put them to the test and check their actual performance in games. We will be deeply scrutinizing both of these cards. Our testing process will involve a thorough examination of several key factors, including 1% lows, temperature, power consumption, and average FPS on ultra settings at 4K.
Testing Rig
- OS: Windows 11
- CPU: Intel Core i7-13700K
- Motherboards: ASRock Z790 Taichi Lite Motherboard
- RAM: Kingston Fury Renegade RGB DDR5 32GB 7200MHz
- SSD: XPG GAMMIX S70 BLADE 2TB NVMe SSD
- PSU: Enermax Revolution D.F. X 1050W
- CPU Cooler: MSI MAG CORELIQUID E360 CPU Liquid Cooler
Note: Keep in mind that benchmarks are influenced by various external factors, so it’s best to use them as a general reference for performance comparisons rather than relying solely on them for absolute accuracy.
Horizon Zero Dawn
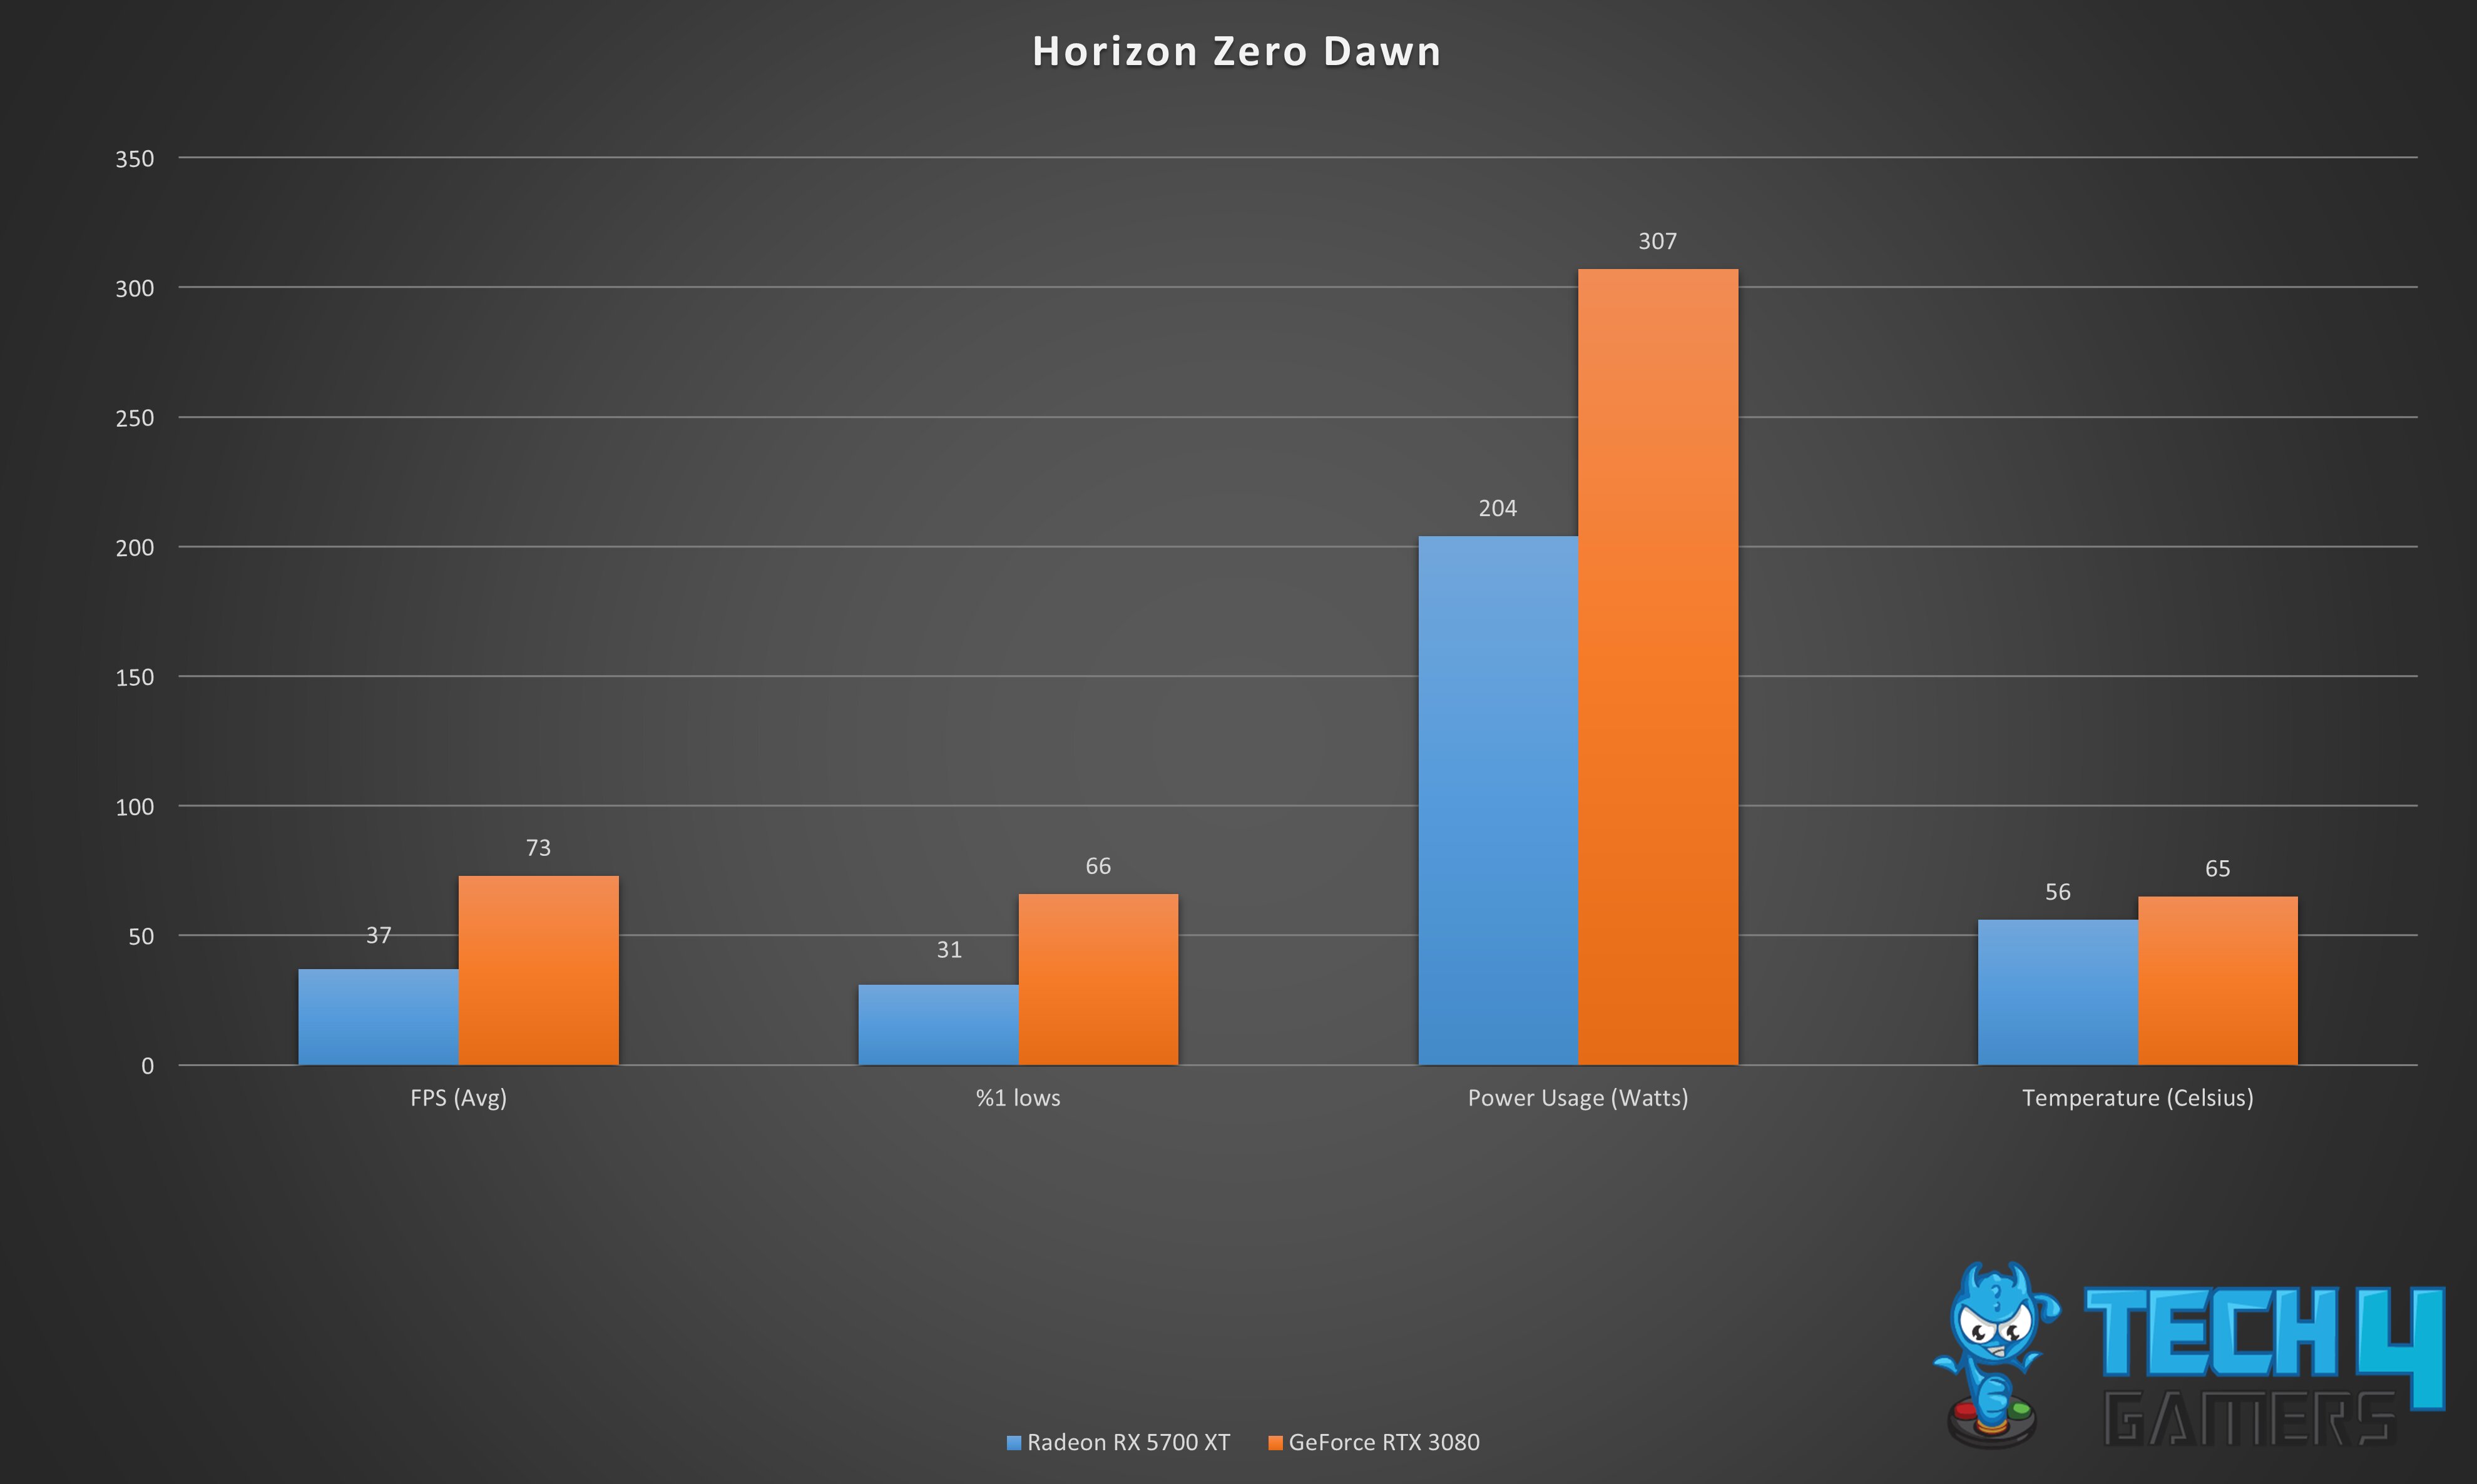
- FPS Performance: RTX 3080 outperforms RX 5700 XT by 65.4% with an impressive 73 FPS vs. 37 FPS in Horizon Zero Dawn.
- 1% Lows: RTX 3080 maintains a significant lead with 66 FPS, while RX 5700 XT lags at 31 FPS, showing a 72.1% performance advantage.
- Power Efficiency: RX 5700 XT is 40.3% more power-efficient, consuming only 204 W compared to RTX 3080’s 307 W.
- Thermal Efficiency: While RTX 3080 offers superior performance, it runs hotter at 65°C, which is 9°C or 14.8% higher than RX 5700 XT’s 56°C average temperature.
Microsoft Flight Simulator
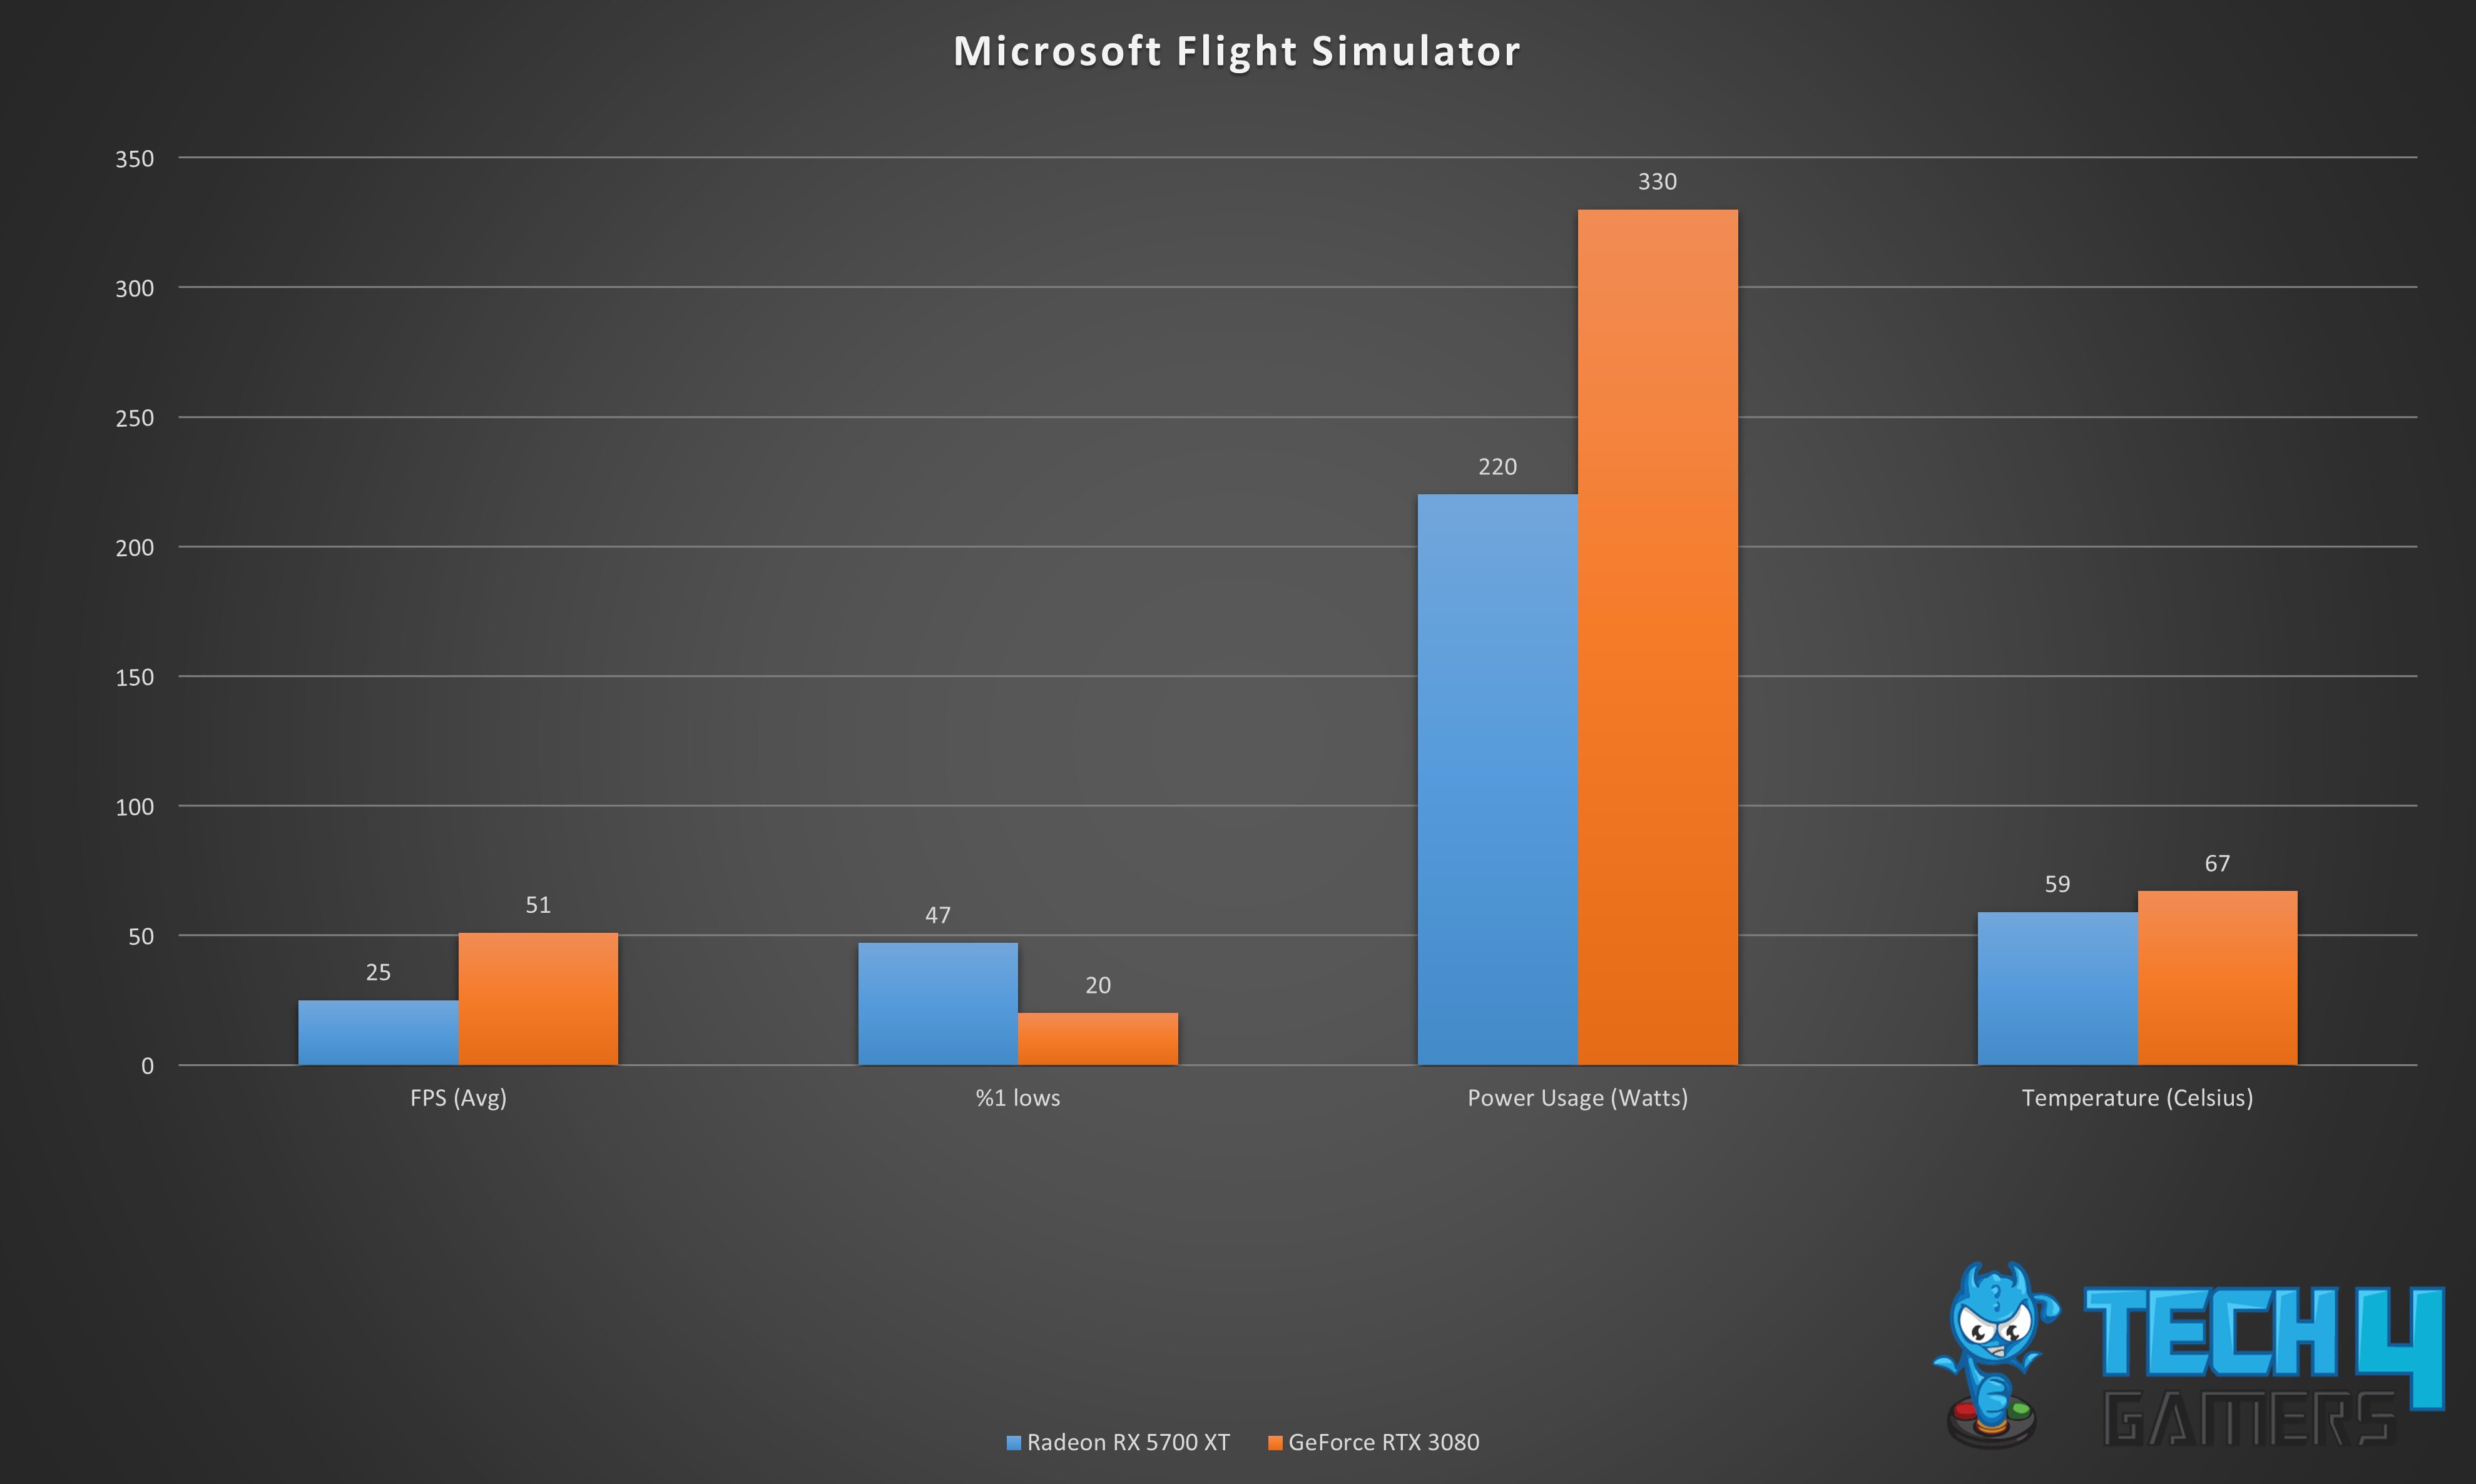
- FPS Performance: RTX 3080 impresses with a 68.4% performance boost, delivering 51 FPS, while RX 5700 XT lags at 25 FPS.
- 1% Lows: RTX 3080 maintains a significant lead with 47 FPS, leaving RX 5700 XT far behind at 20 FPS, showcasing an 80.5% difference.
- Power Efficiency: RX 5700 XT consumes 49% less power, drawing only 220 W compared to RTX 3080’s 330 W.
- Thermal Efficiency: RX 5700 XT runs cooler at 59°C, while RTX 3080 averages 67°C, making it 8°C or 12.6% hotter.
Assassin’s Creed Odyssey
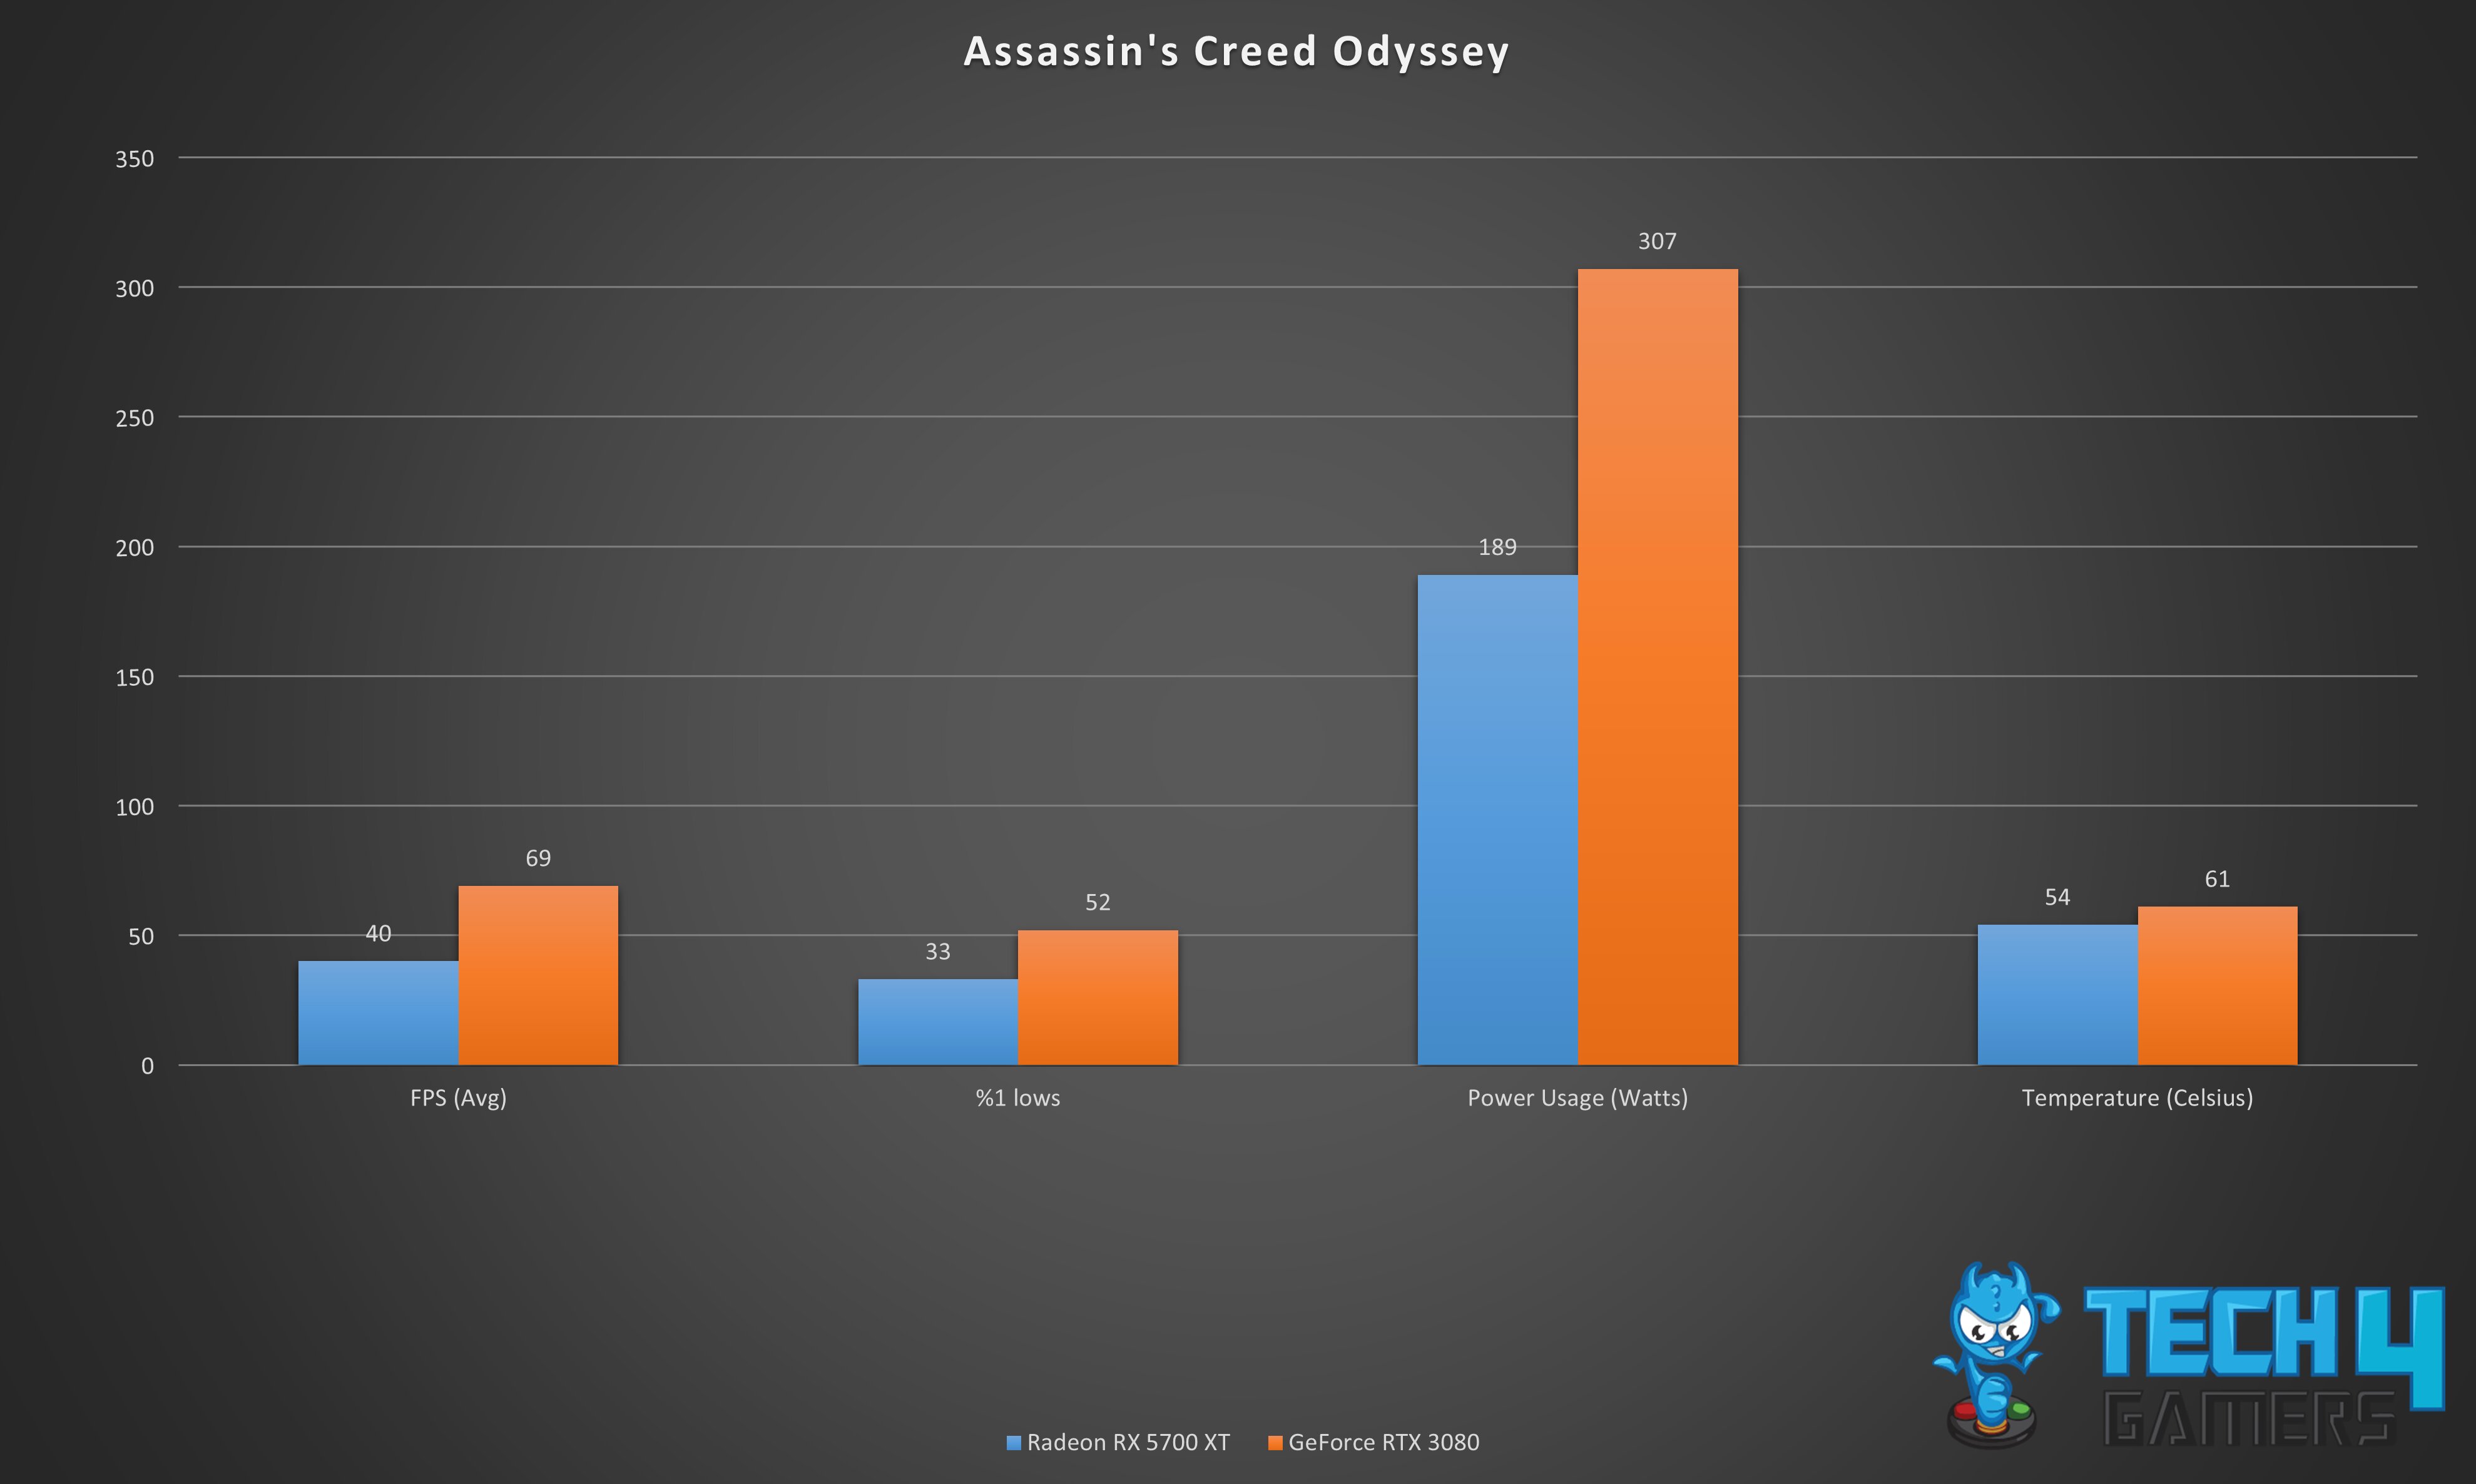
- FPS Performance: RTX 3080 leads with a 53.2% performance boost, achieving 69 FPS, while RX 5700 XT falls behind at 40 FPS.
- 1% Lows: RTX 3080 dominates with 52 FPS, outperforming RX 5700 XT’s 33 FPS by 44.7%.
- Power Efficiency: RX 5700 XT is more power-efficient, drawing 47.5% less power at 189 W compared to RTX 3080’s 307 W.
- Thermal Efficiency: RTX 3080 runs hotter at 61°C, while RX 5700 XT maintains a cooler temperature at 54°C, representing a 7°C or 12.1% difference.
Kingdom Come Deliverance
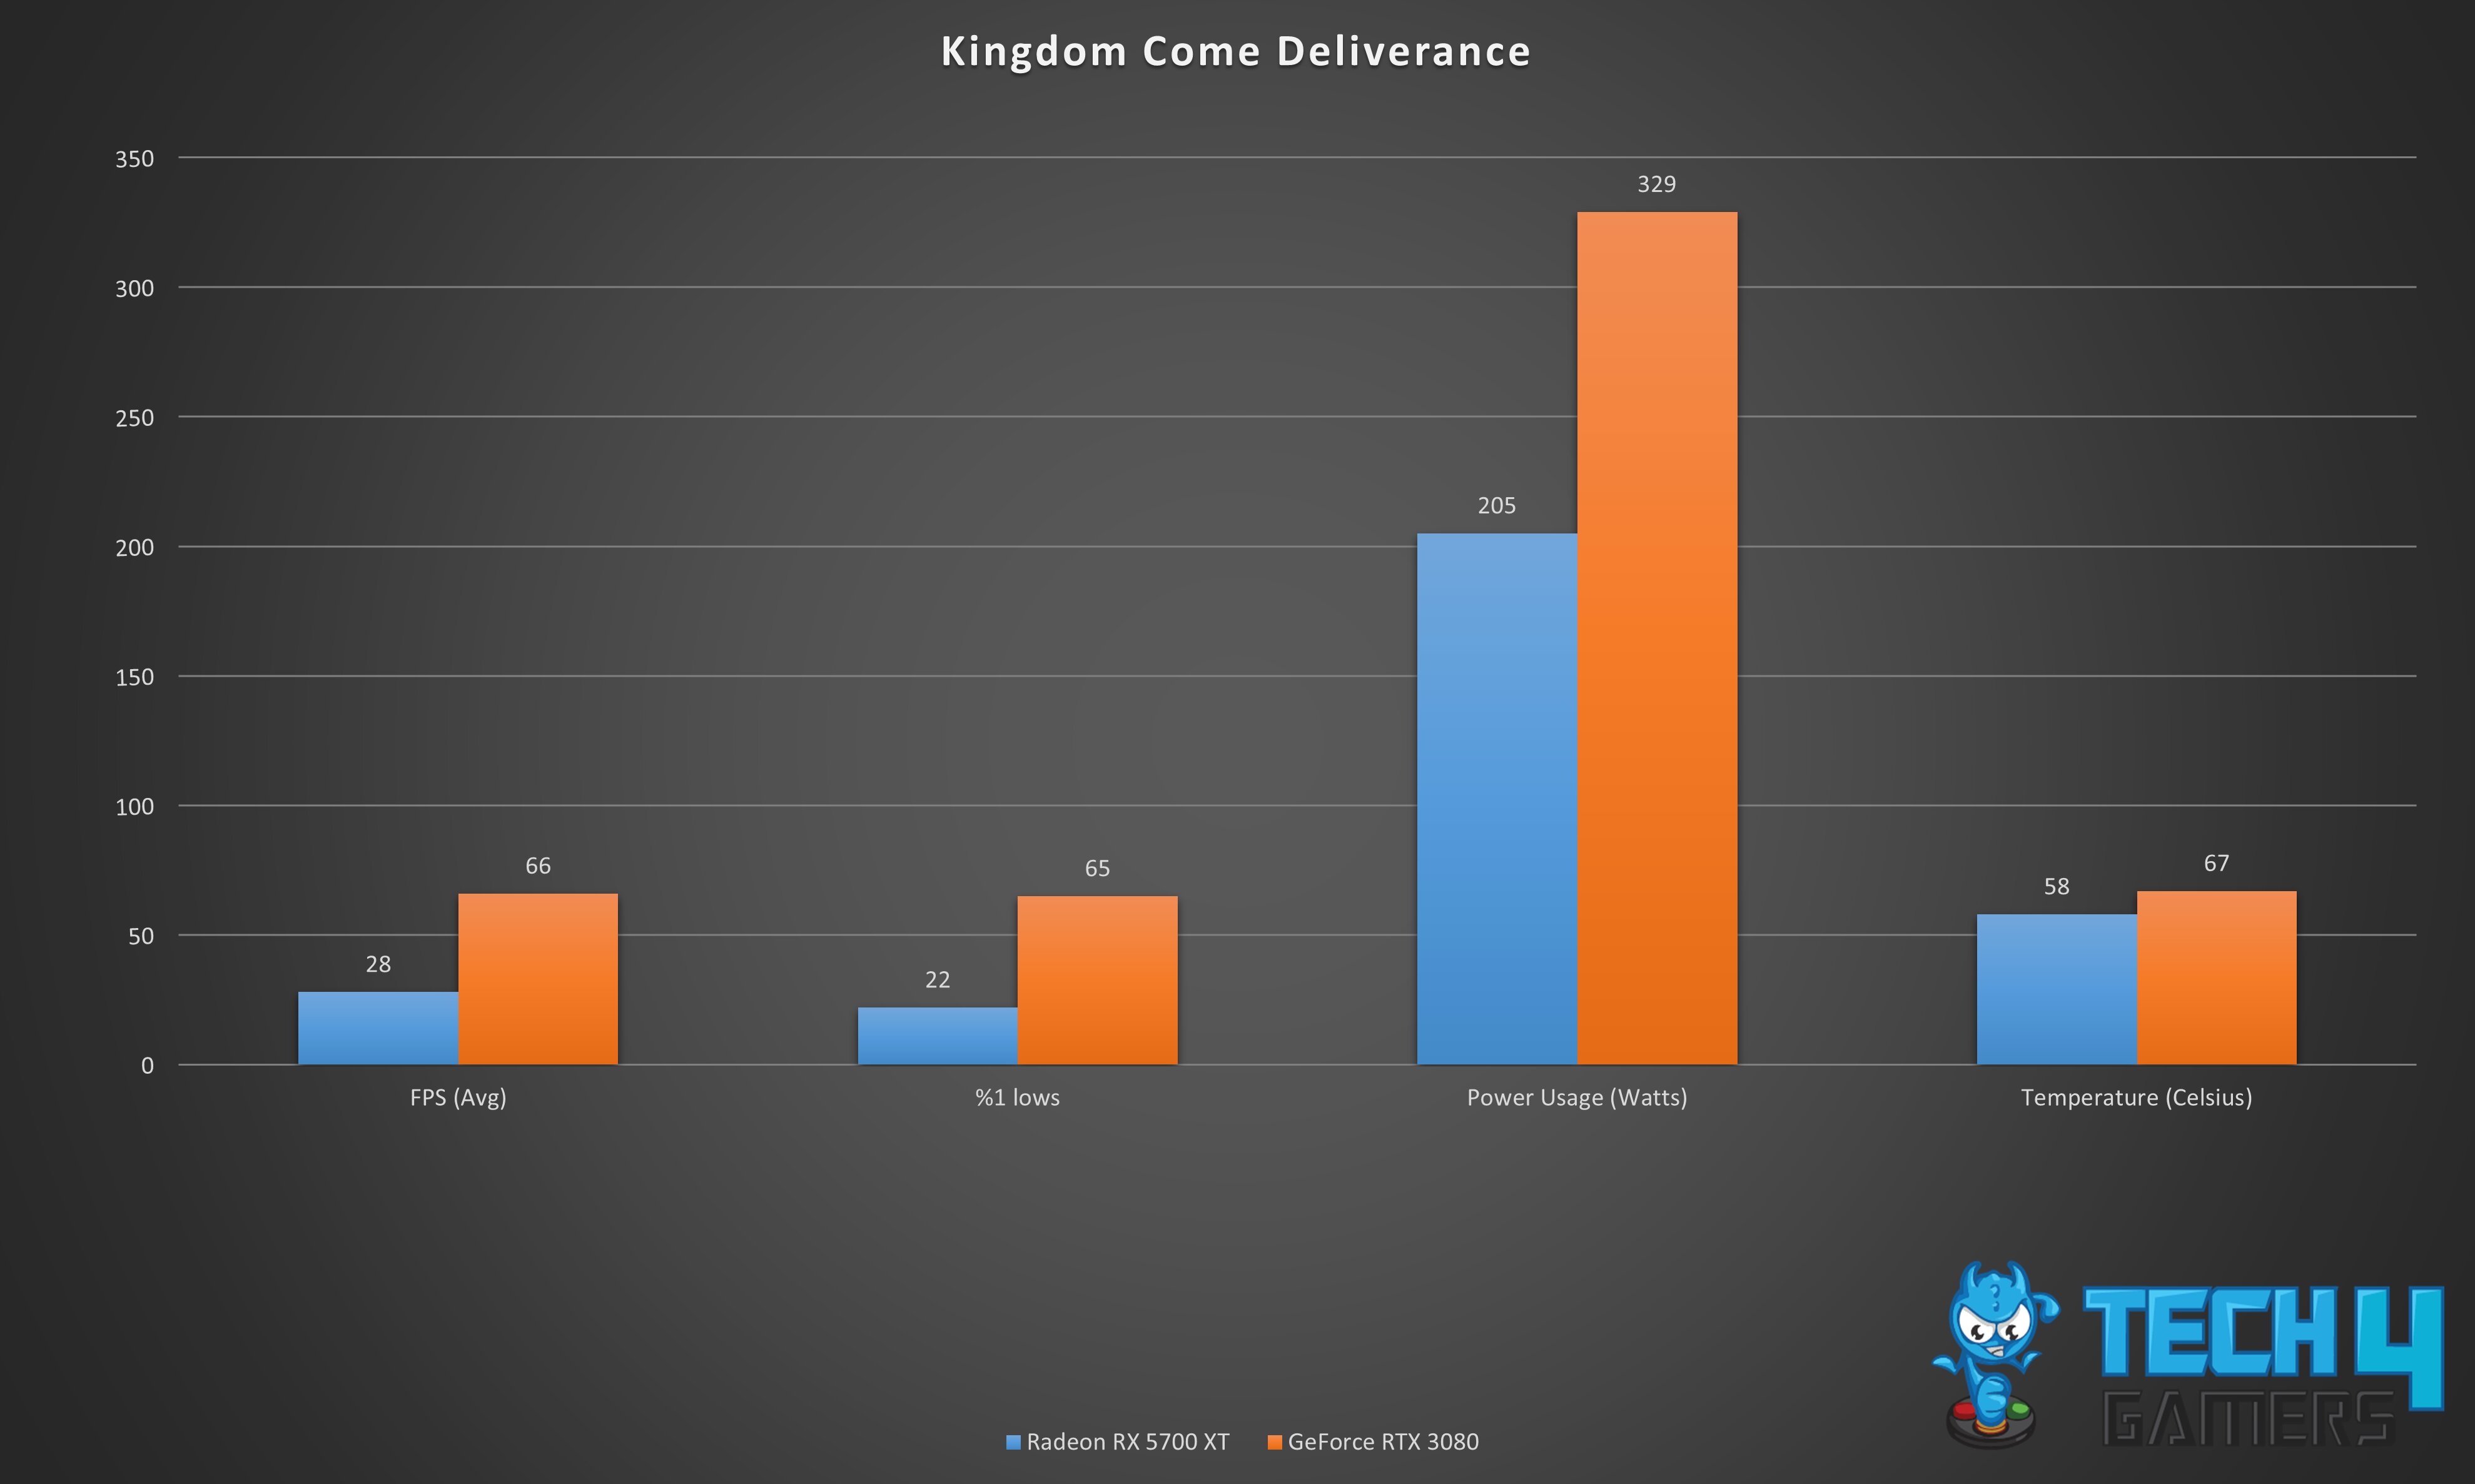
- FPS Performance: RTX 3080 outperforms RX 5700 XT with an 80.8% performance boost, reaching 66 FPS, while RX 5700 XT lags behind at 28 FPS.
- 1% Lows: RTX 3080 showcases superior performance with 65 FPS in 1% lows, marking a 98.8% improvement over RX 5700 XT’s 22 FPS.
- Power Efficiency: RX 5700 XT is more power-efficient, drawing only 205 W, which is 43.5% less than RTX 3080’s 329 W.
- Thermal Efficiency: RX 5700 XT runs cooler with an average temperature of 58°C, while RTX 3080 averages 67°C, making it 9°C or 14.4% hotter.
Red Dead Redemption 2
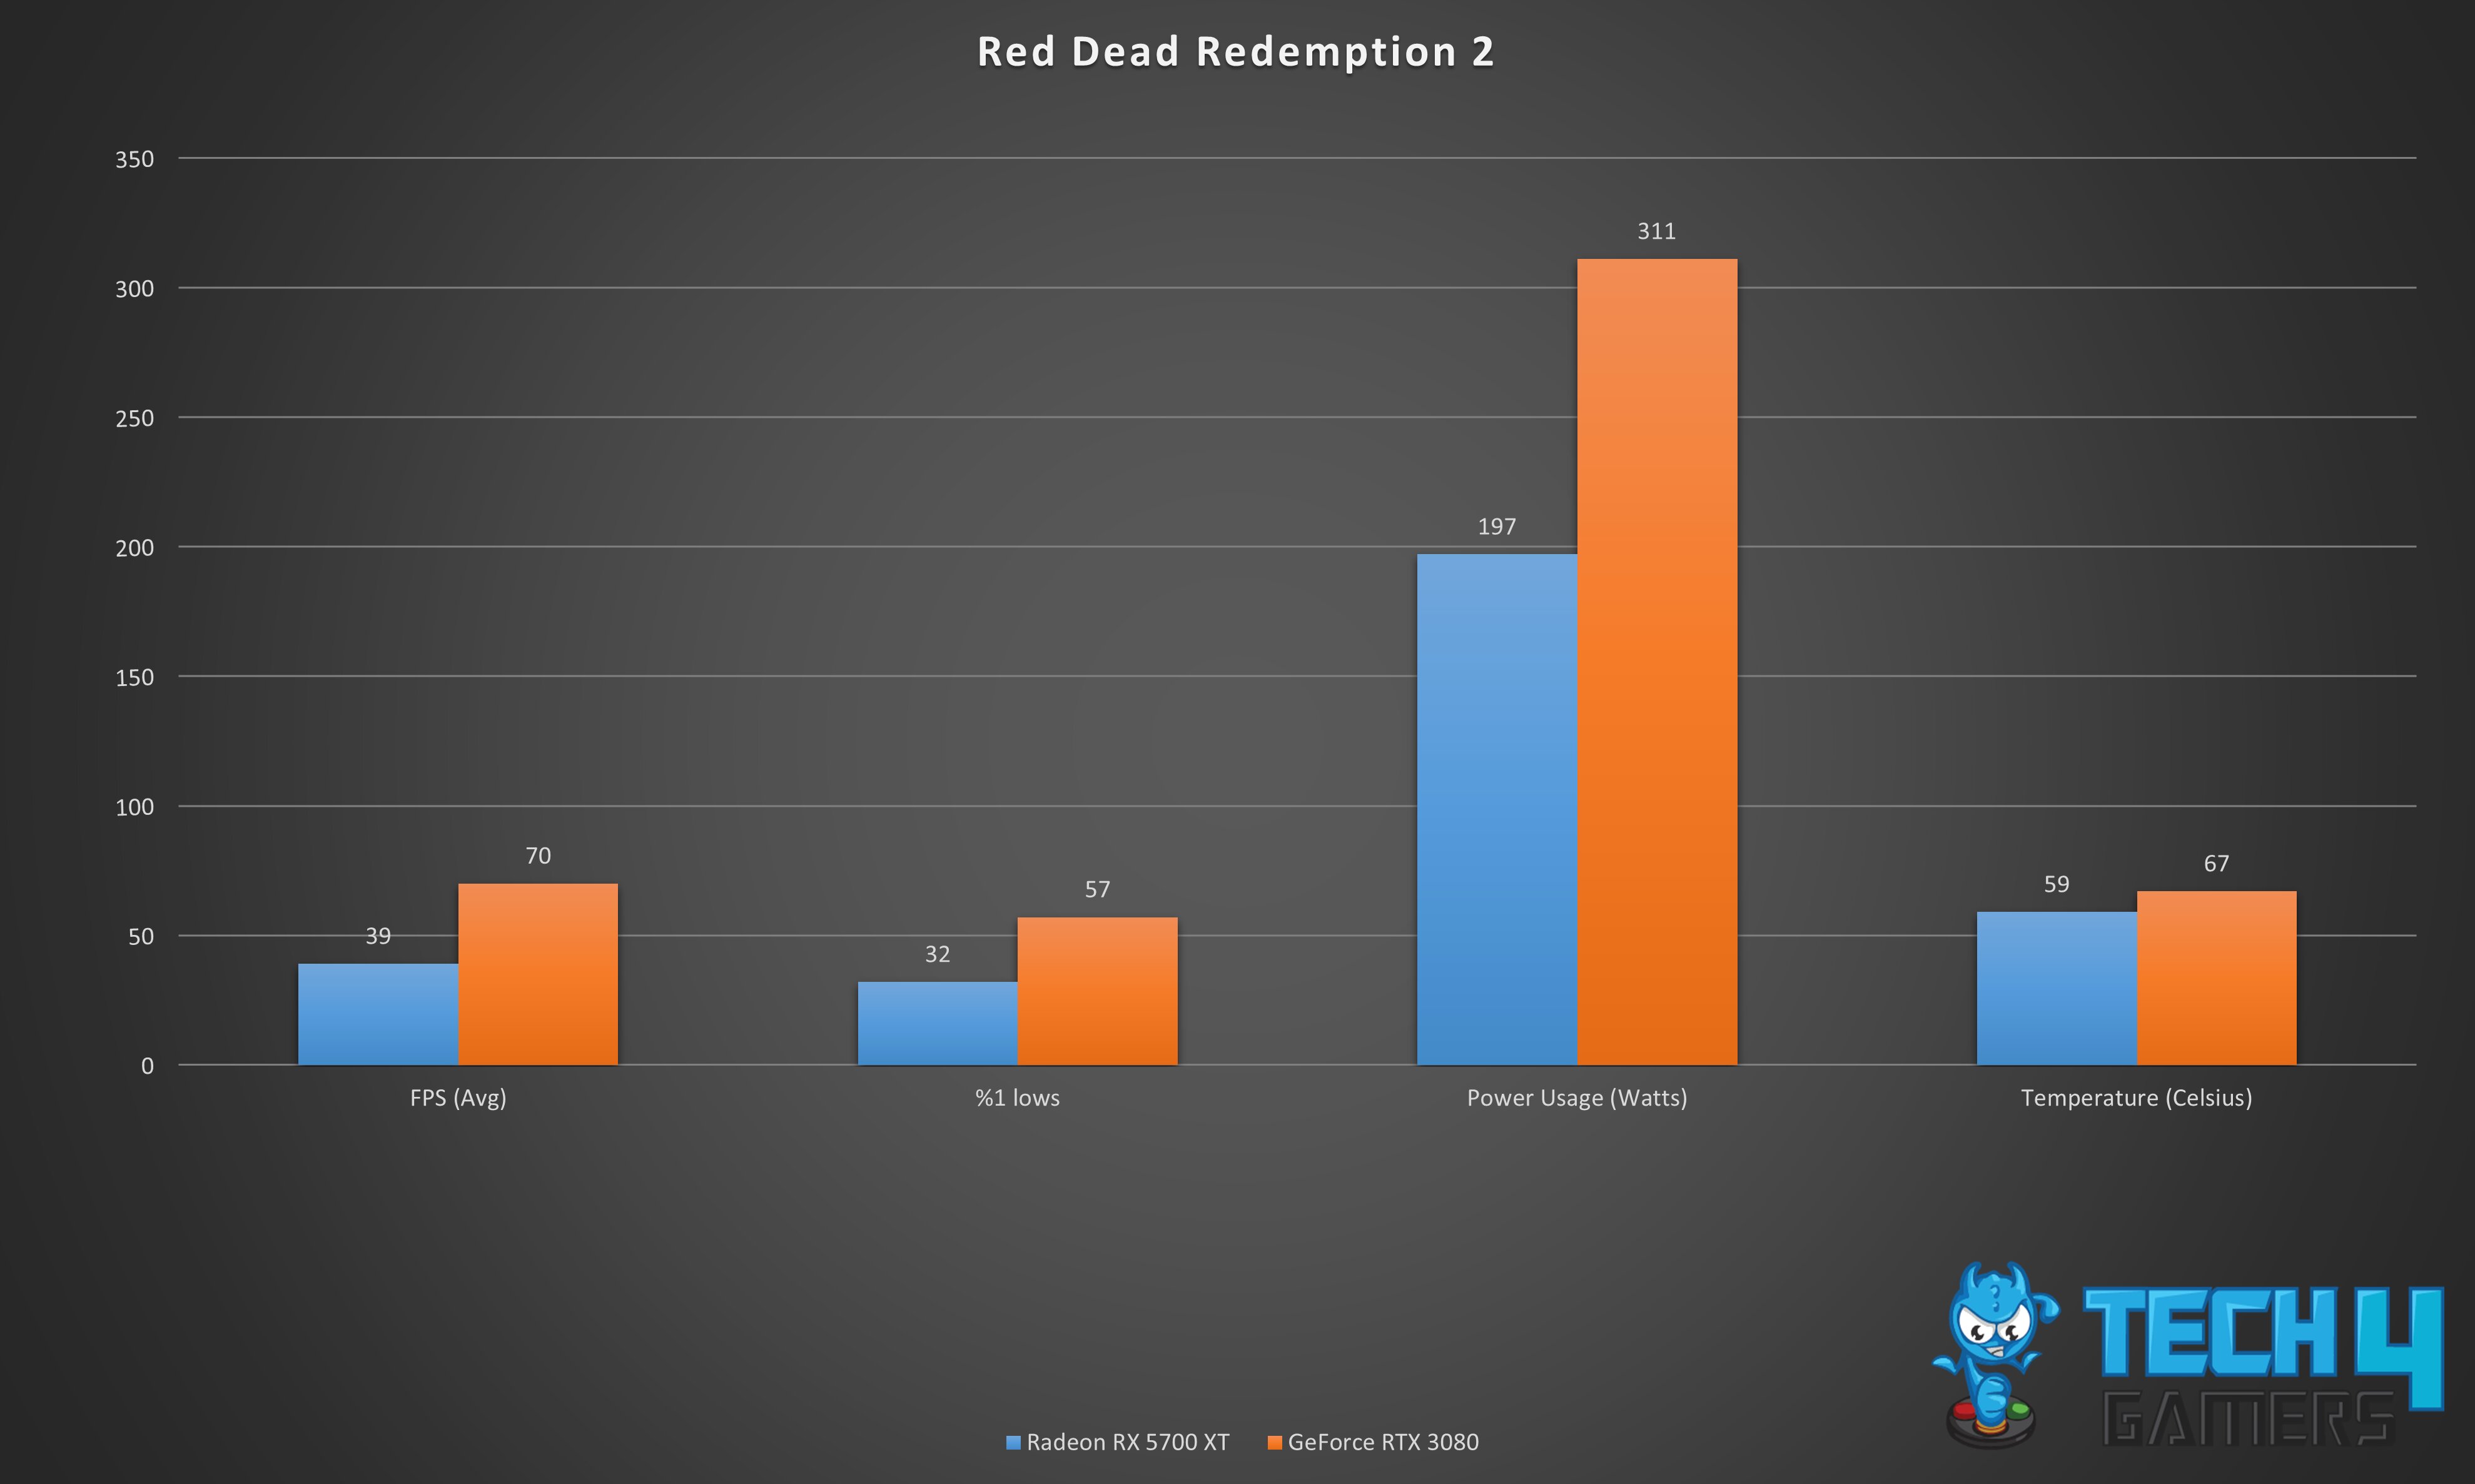
- FPS Performance: RTX 3080 leads with an impressive 56.8% performance boost, reaching 70 FPS, while RX 5700 XT falls behind at 39 FPS.
- 1% Lows: RTX 3080 outperforms RX 5700 XT with 57 FPS in 1% lows, showcasing a 56.1% performance difference.
- Power Efficiency: RX 5700 XT is more power-efficient, consuming 44.8% less power at 197 W, compared to RTX 3080’s 311 W.
- Thermal Efficiency: RTX 3080 delivers superior performance but runs hotter with an average temperature of 67°C, which is 8°C or 12.6% higher than RX 5700 XT’s 59°C.
Battlefield V
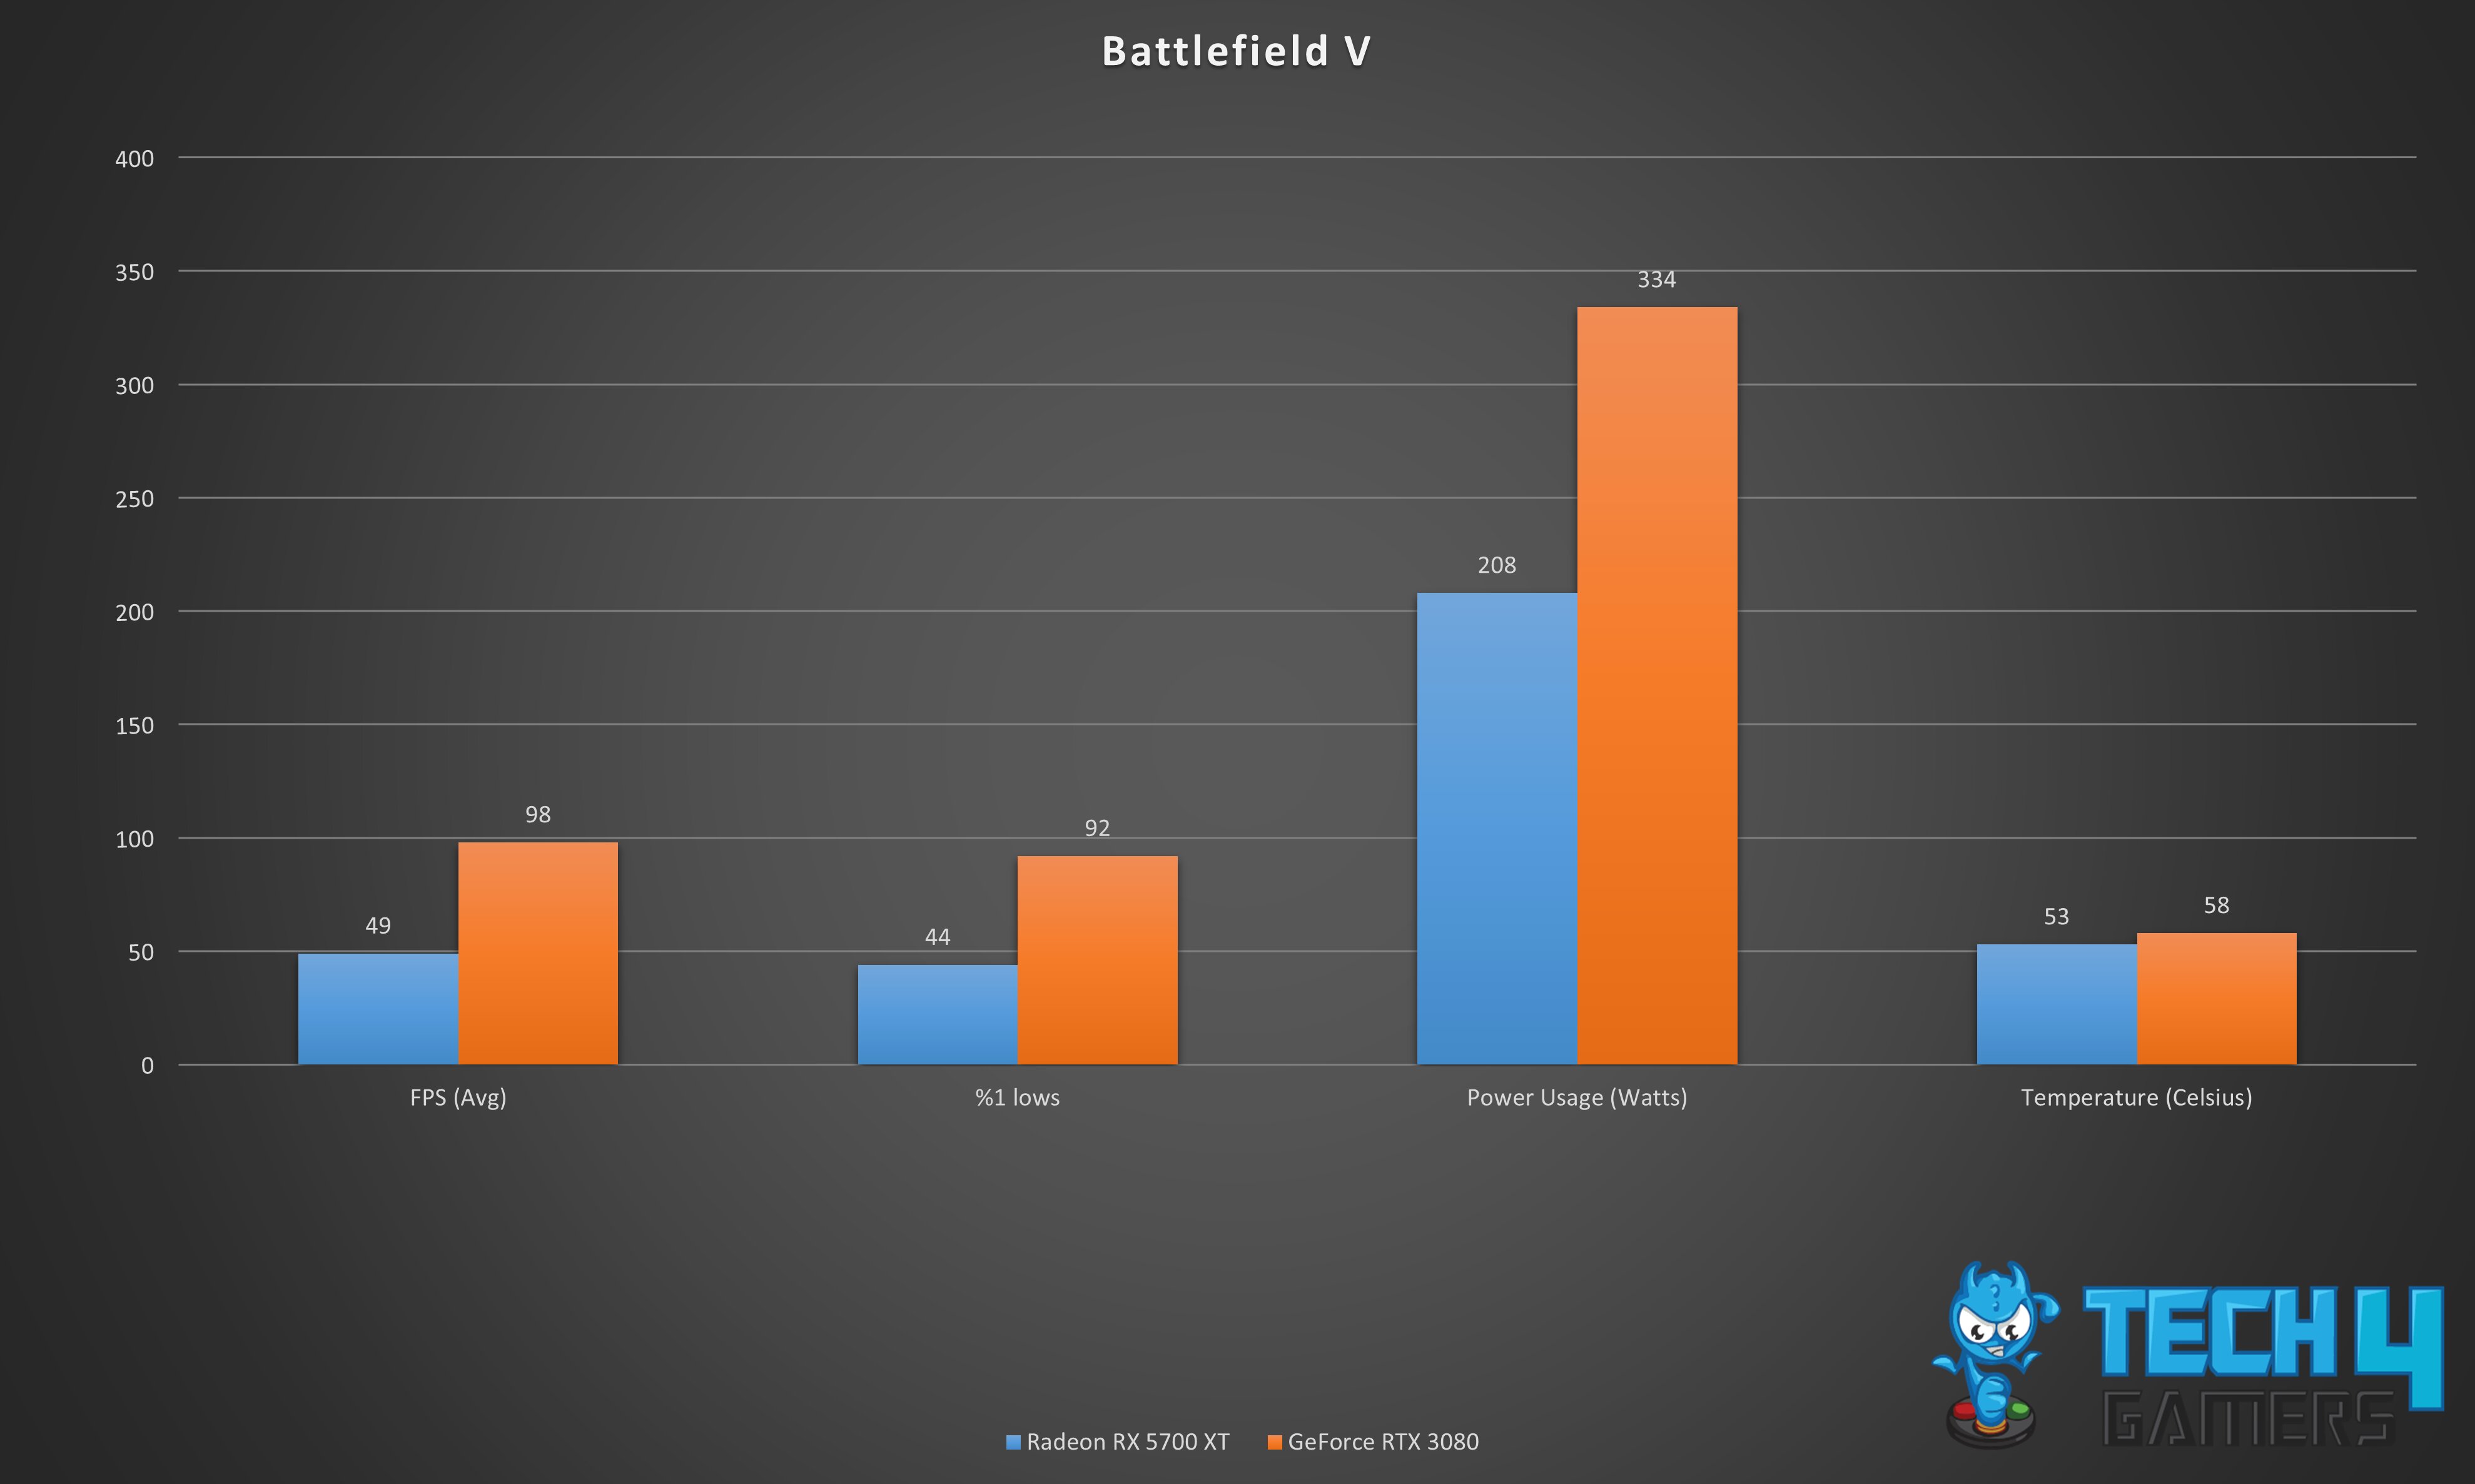
- FPS Performance: RTX 3080 excels with a remarkable 66.6% performance boost, achieving an impressive 98 FPS, leaving RX 5700 XT behind at 49 FPS.
- 1% Lows: RTX 3080 shines with 92 FPS in 1% lows, outperforming RX 5700 XT’s 44 FPS by 70.5%.
- Power Consumption: RTX 3080, being more powerful, consumes 46.5% more power at 334 W compared to RX 5700 XT’s 208 W.
- Thermal Performance: RTX 3080 runs hotter with an average temperature of 58°C, which is 10°C or 9% higher than RX 5700 XT’s average temperature of 53°C.
Crysis Remastered
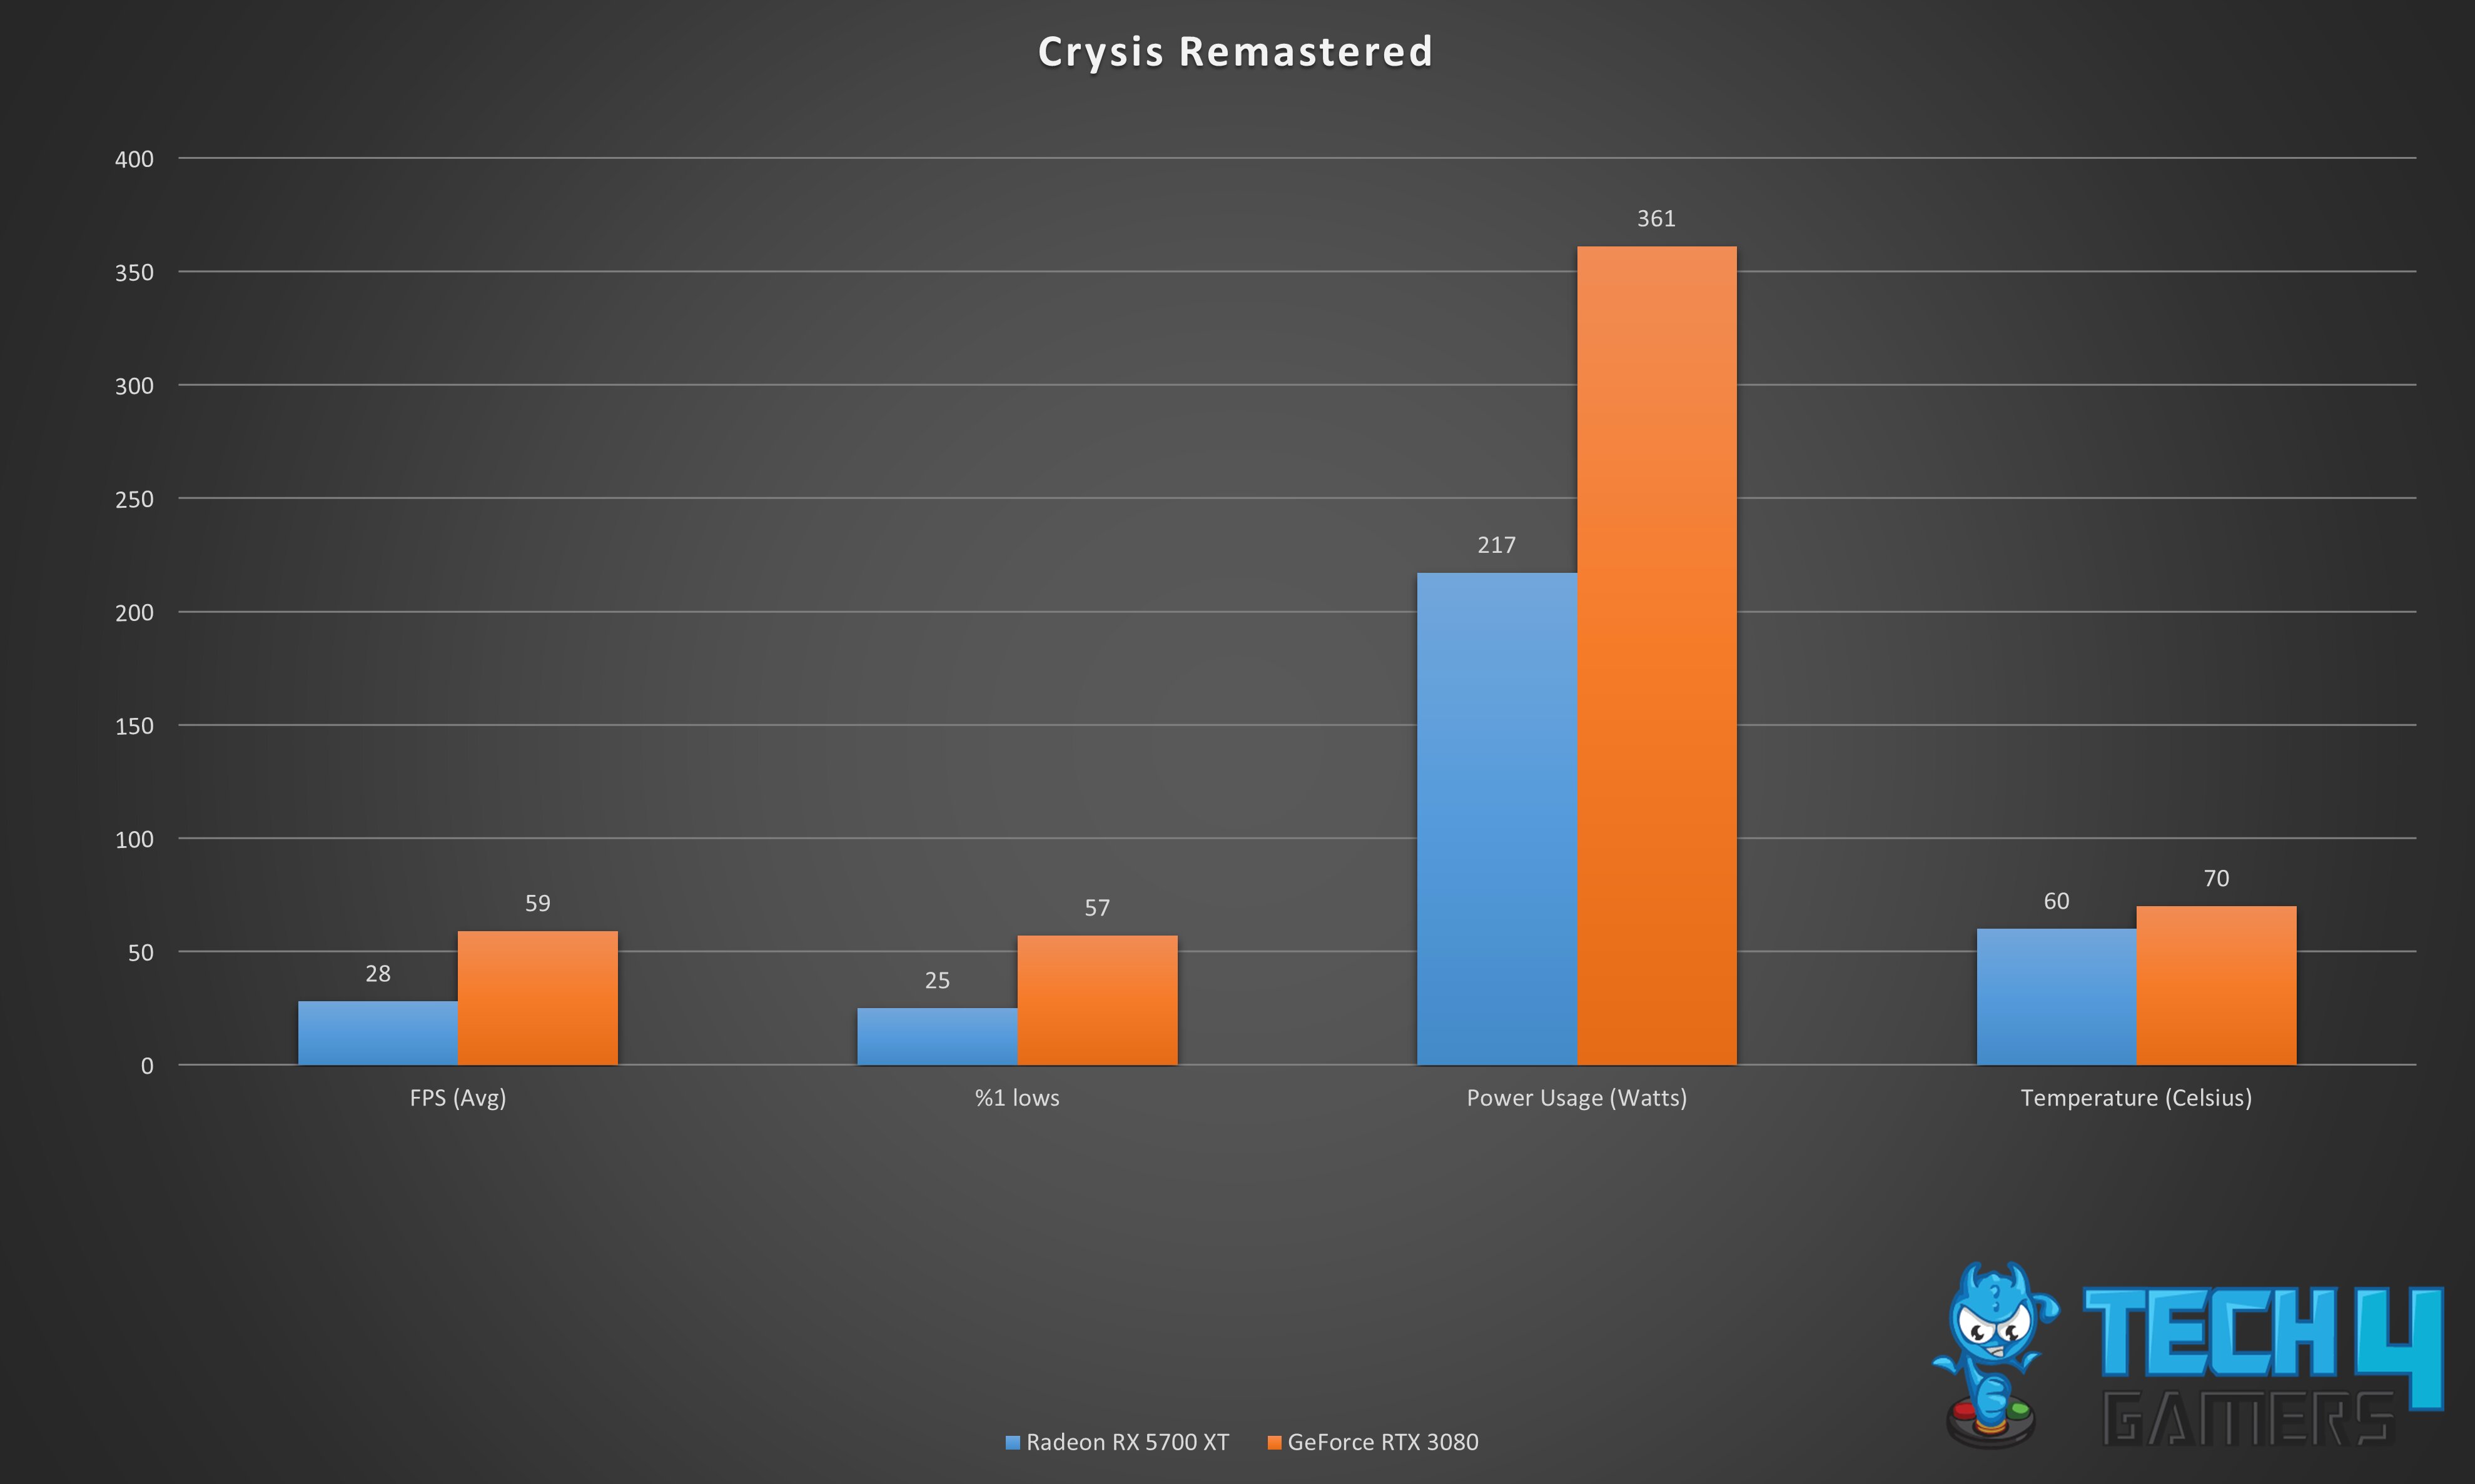
- FPS Performance: RTX 3080 dominates with a 71.3% performance boost, achieving an impressive 59 FPS, while RX 5700 XT lags at 28 FPS.
- 1% Lows: RTX 3080 maintains a performance advantage of 78% with 57 FPS in 1% lows, leaving RX 5700 XT far behind with only 25 FPS.
- Power Efficiency: RX 5700 XT is more power-efficient, consuming 49.8% less power at 217 W, while RTX 3080 consumes 361 W.
- Thermal Performance: RTX 3080 runs hotter with an average temperature of 70°C, which is 10°C or 15.3% higher than RX 5700 XT’s average temperature of 60°C.
Control
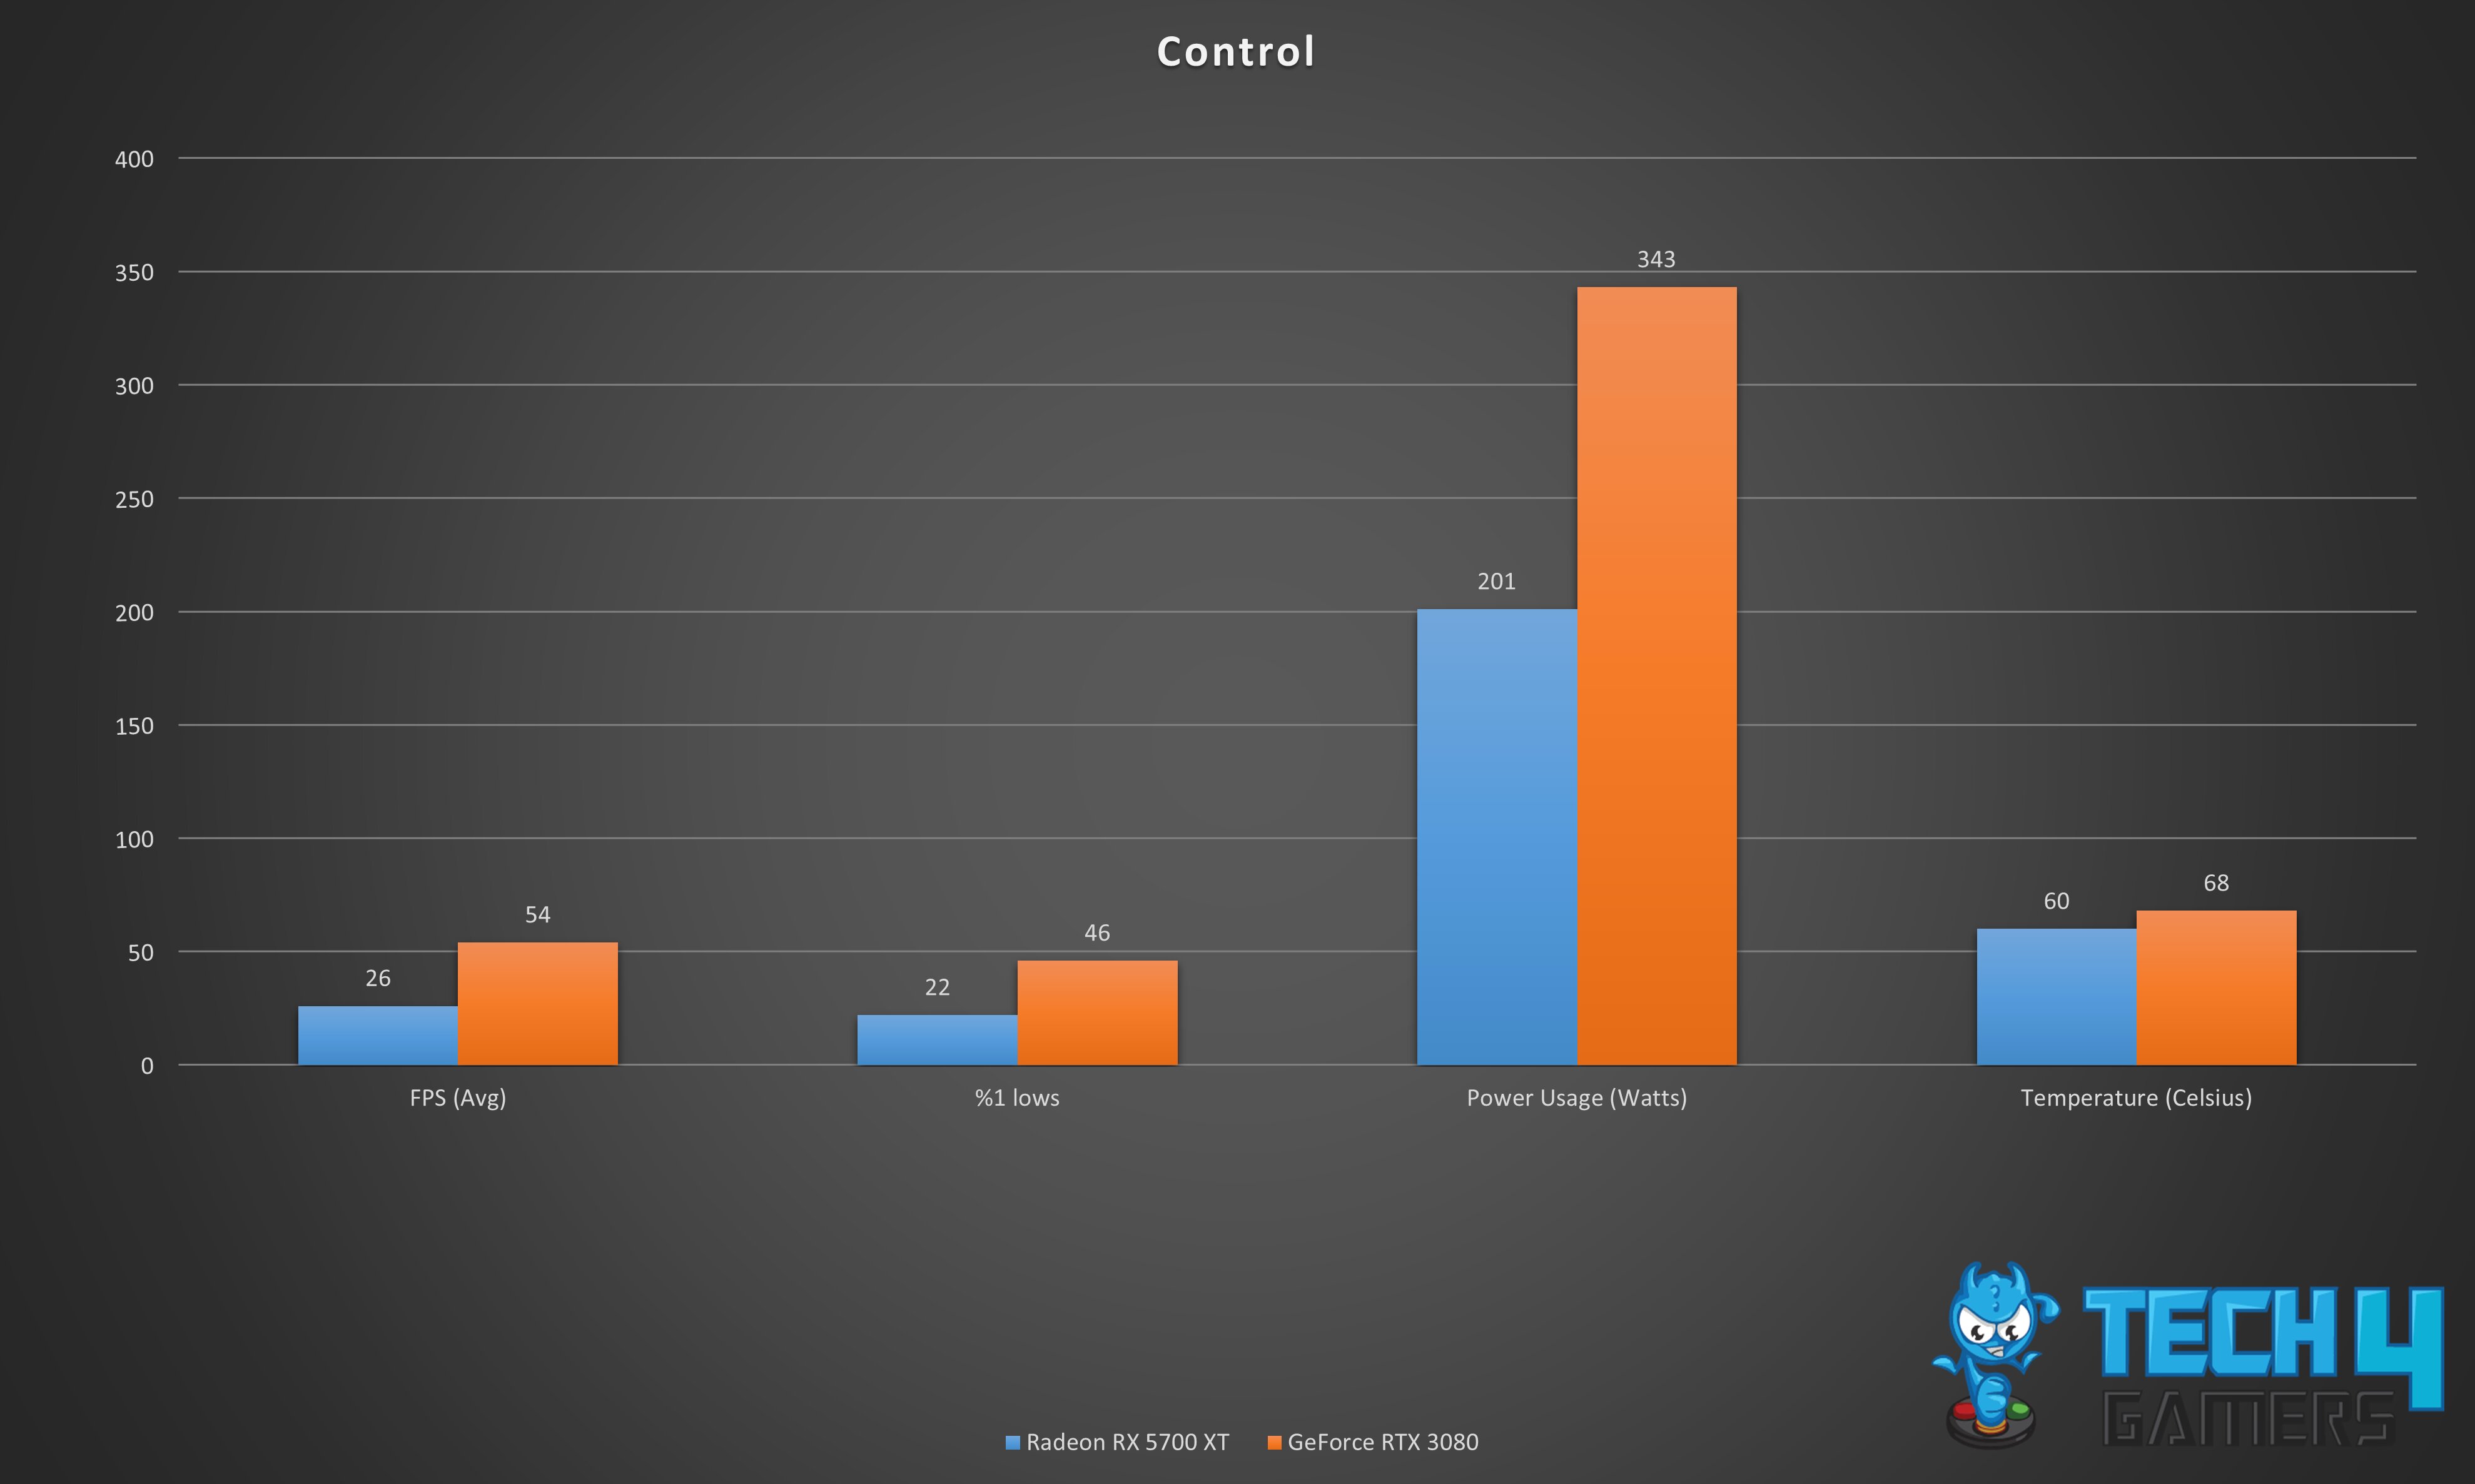
- FPS Performance: RTX 3080 dominates with a 70% performance boost and an impressive score of 54 FPS, while RX 5700 XT struggles with only 26 FPS.
- 1% Lows: RTX 3080 maintains an advantage with 46 FPS in 1% lows compared to RX 5700 XT’s 22 FPS, resulting in a 70.5% difference in performance.
- Power Efficiency: RX 5700 XT is more power-efficient, consuming 52.2% less power at 201 W, while RTX 3080 consumes 343 W.
- Thermal Performance: RTX 3080 performs better but runs hotter with an average temperature of 68°C, which is 8°C or 12.5% higher than RX 5700 XT’s average temperature of 60°C.
Overall Gaming Performance
After conducting extensive FPS benchmarks across multiple games, it’s evident which card reigns supreme in the Radeon RX 5700 XT vs GeForce RTX 3080 battle.
- Superior Performance: RTX 3080 consistently outperforms RX 5700 XT in all games, providing better FPS and 1% lows.
- Substantial Performance Gap: The RX 5700 XT trails behind the RTX 3080 by a significant margin, with a performance gap of at least 44% in all games.
- Average FPS: RTX 3080 delivers an impressive average FPS of 67.5, while RX 5700 XT lags behind at 34 FPS.
- Significant Performance Boost: Users can enjoy a substantial 66% increase in FPS performance with the GeForce RTX 3080 over the Radeon RX 5700 XT.
Average Power Consumption
Without a doubt, power consumption is a vital factor that users take into account while choosing a graphics card. Our RX 5700 XT vs RTX 3080 test revealed some key insights regarding power consumption across all games tested:
- In all of our tested games, the RX 5700 XT consumed less power than the RTX 3080 and always outperformed its power efficiency while we were testing the cards, which could be due to it lagging behind in FPS performance.
- Interestingly, the average power consumption of the RX 5700 XT was 202.6 watts, whereas the RTX 3080 used an average of 326.5 watts, proving that the RTX 3080 is less power-efficient than the RX 5700 XT by a significant margin of 46.8%.
Average Thermal Statistics
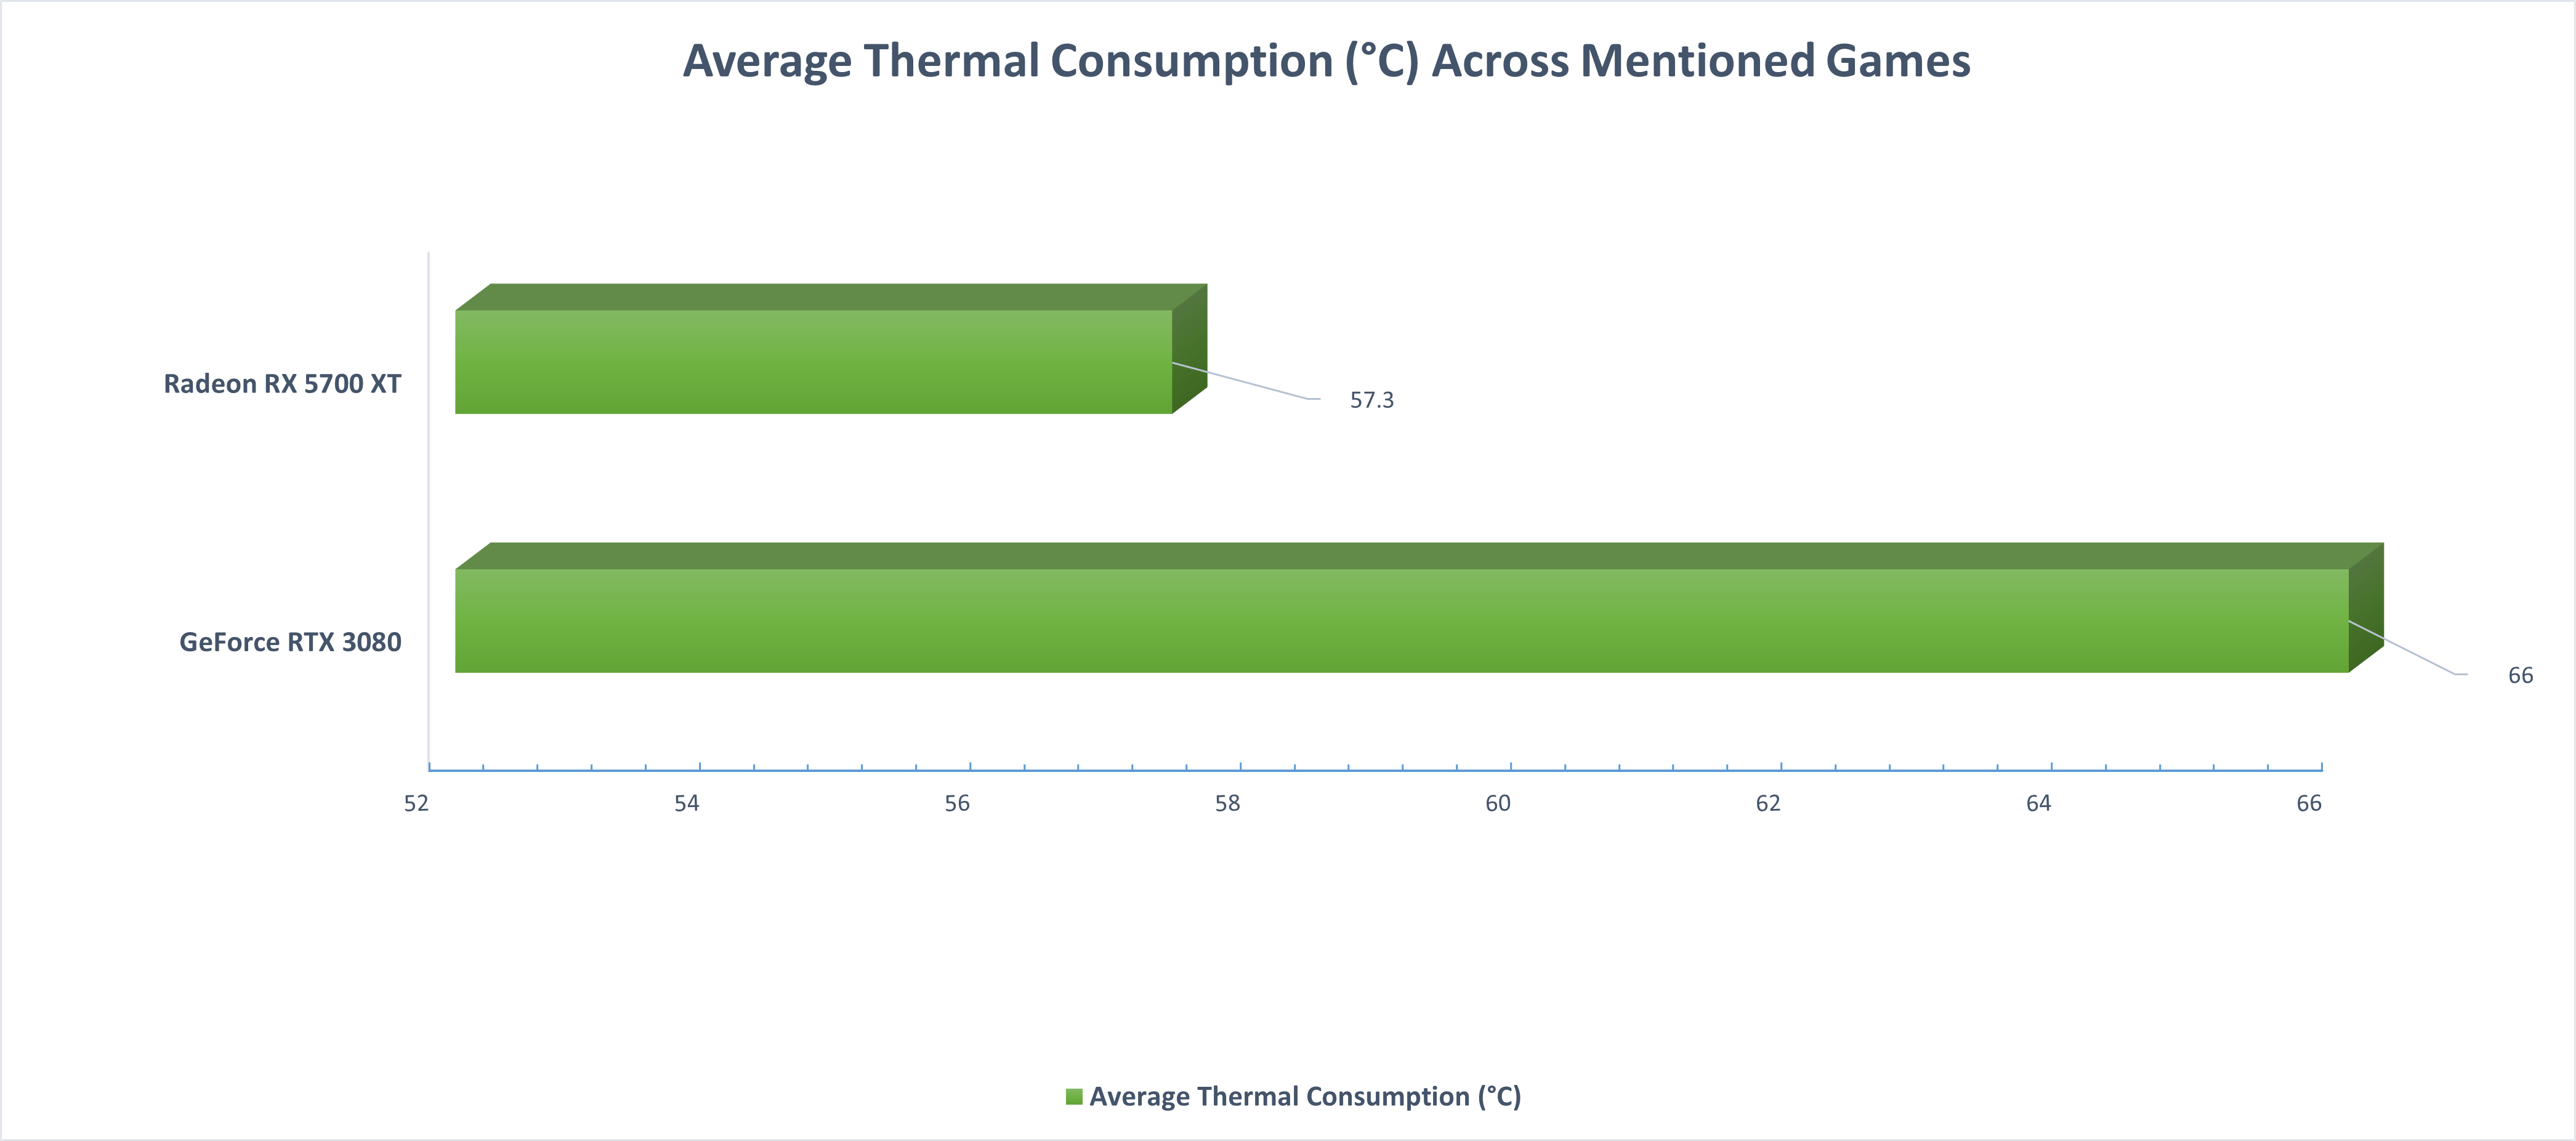
- When it comes to our thermal efficiency results, the RTX 3080 performs worse compared to the RX 5700 XT and generates more heat overall. Across all benchmarked games, the RTX 3080 consistently produced higher temperatures compared to the RX 5700 XT.
- The RX 5700 XT had an average temperature of 57.3°C, while the RTX 3080 had an average temperature of 66°C.
- This significant difference in average temperature shows that the RX 5700 XT is 13.9% more thermally efficient than the RTX 3080.
Pricing And Availability
- As per our research, the Nvidia GeForce RTX 3080 is currently priced at around 800 USD, and it’s readily accessible through popular platforms such as Newegg.
- Meanwhile, the Radeon RX 5700 XT comes with a more budget-friendly price tag, sitting at just 140 USD. It’s also conveniently available on platforms like Newegg.
- When comparing the two, the RTX 3080 exhibits a majorly higher price point, with a difference of approximately 140.4% compared to the RX 5700 XT. This pricing disparity is an important factor to consider while making your choice.
RX 5700 XT Vs RTX 3080: Which One Would We Recommend?
After conducting an in-depth comparison between the Radeon RX 5700 XT and the GeForce RTX 3080, we’ve gathered valuable insights to help you make an informed decision:
- Gaming Performance: GeForce RTX 3080 offers a remarkable 66% increase in FPS performance over Radeon RX 5700 XT, ideal for high frame rates and ultra settings.
- Power Efficiency: Radeon RX 5700 XT showcases impressive power efficiency, consuming 46.8% less power than RTX 3080, reducing electricity costs and promoting eco-conscious computing.
- Thermal Efficiency: RX 5700 XT maintains superior thermal efficiency, running 13.9% cooler than RTX 3080, ensuring stable performance during extended gaming sessions.
- Price Difference: While RTX 3080 delivers outstanding performance, it comes at a significantly higher price point, marking a difference of approximately 140.4% compared to RX 5700 XT.
If you’re a gamer who prioritizes top-notch performance and can accommodate a higher budget, the GeForce RTX 3080 is an excellent choice. It excels in delivering exceptional gaming experiences with high frame rates and stunning visuals.
On the other hand, if you’re looking for a more power-efficient and budget-friendly option while maintaining respectable gaming performance, the Radeon RX 5700 XT is a compelling choice.
Pros And Cons
| GPU | Pros | Cons |
| GeForce RTX 3080 |
|
|
| Radeon RX 5700 XT |
|
|
Also Read:
Thank you! Please share your positive feedback. 🔋
How could we improve this post? Please Help us. 😔
Feedback By:
Emma
Anderson
Brian
Richards
[Comparisons Expert]
Abdemanaf is a skilled creative writer who has been honing his craft since 2011. While initially working in different fields, he found a passion for technology and has been exploring the tech world since early 2015. Over the years, he has developed an in-depth knowledge of the latest tech trends and product offerings by various companies.
Abdemanaf’s writing reflects his analytical mindset and ability to think critically. He has a knack for breaking down complex technical information into easily digestible pieces, making his articles engaging and accessible to readers from all backgrounds. In February 2022, he joined Tech4Gamers as a blog and product comparison writer, where he has been able to hone his skills further.
As a writer, Abdemanaf is dedicated to staying up-to-date with the latest technological advancements and trends, enabling him to provide readers with the most relevant and accurate information. He is always eager to learn more and is constantly seeking new challenges to improve his skills.
Get In Touch: manaf@tech4gamers.com


