The AMD Ryzen 9 5950X and Intel Core i9-10900K were two of the best processors of 2020. In this comparison, we will compare the performance of the Ryzen 9 5950X vs Core i9-10900K in a myriad of scenarios.
Key Takeaways
- The Ryzen 9 5950x has an advantage over the Core i9-10900K due to its 6 additional cores, which add up to 12 additional threads.
- A shortcoming of the Ryzen 9 5950X is that it doesn’t have integrated graphics, unlike the Core i9-10900K, which has Intel UHD Graphics 630.
- Due to its higher TDP of 125W, the Core i9-10900K draws around 20% more power than the Ryzen 9 5950X.
- At 1080p, the Ryzen 9 5950X outperformed the Core i9-10900K by 2.65% and ran at a 3.9°C hotter operating temperature. However, the difference was not prominent in 1440p gaming.
- The Core i9-10900K offers a higher performance per dollar and currently costs $389 to $420, ~$100 less than the Ryzen 9 5950X, which costs above $489.
Ryzen 9 5950X Vs Core i9-10900K
Comparison Table
| Feature | Intel Core i9-10900K | AMD Ryzen 9 5950X |
| Architecture | Comet Lake | Zen 3 |
| Former Codename | Comet Lake | Vermeer |
| Socket | FCLGA1200 | AM4 (LGA 1331) |
| Unlocked For Overclocking | Yes | Yes |
| Max Junction Temperature | 100°C | 90°C |
| Thermal Solution | PCG 2015D | Not Included |
| Integrated Graphics | Intel UHD Graphics 630 | NA |
| Memory Execution Units | 2 | 2 |
| Max Bandwidth | 45.8 GB/s | 51.2 GB/s |
| Support ECC Memory | No | Yes |
| L1 Cache | 640KB | 1MB |
| L2 Cache | 2.5MB | 8MB |
| PCIe Version | 3.0 | 4.0 |
| PCIe Lanes | 16 | 20 |
| Launch Price | $488 | $799 |
| Best Motherboards | Motherboards For i9-10900k | Motherboards For Ryzen 9 5950x |
| Best Coolers | CPU Coolers For i9-10900k | CPU Cooler For Ryzen 9 5950x |
Architectural Differences
- Process Node: Starting off, the Intel Core i9-10900K utilizes a 14nm FinFET process technology, whereas the AMD Ryzen 9 5950X boasts a more advanced 7nm FinFET process node, indicating the Ryzen to be more advanced.
- Clock Speed: When it comes to frequency, the Intel Core i9-10900K operates with a Base Clock of 3.70GHz and a Turbo Clock of up to 5.30GHz, offering a wide frequency range. In contrast, the AMD Ryzen 9 5950X features a Base Clock of 3.40GHz and a Turbo Clock of up to 4.90GHz, reflecting varying frequency capabilities between the two processors.
- TDP: Furthermore, the Intel Core i9-10900K has a Max TDP of 125W, which signifies its power and thermal requirements, whereas the AMD Ryzen 9 5950X harmonizes with a lower 105W TDP, highlighting distinct thermal profiles between these processors.
- Core Count: The Intel Core i9-10900K features 10 cores, providing ample processing power, whereas the AMD Ryzen 9 5950X outshines with 16 cores, making it a strong contender for multi-threaded workloads.
- L3 Cache: In terms of L3 cache, the Intel Core i9-10900K has 20MB of cache, whereas the AMD Ryzen 9 5950X boasts a significantly larger 64MB L3 cache, enhancing its ability to handle large datasets and demanding tasks more efficiently.
Productivity Benchmarks
To procure the productivity performance results of Ryzen 9 5950X vs Core i9-10900K, let us discuss the performance of two CPUs in demanding applications and activities. To gauge the performance of these processors, we put them through our productivity tests suite.
7-Zip
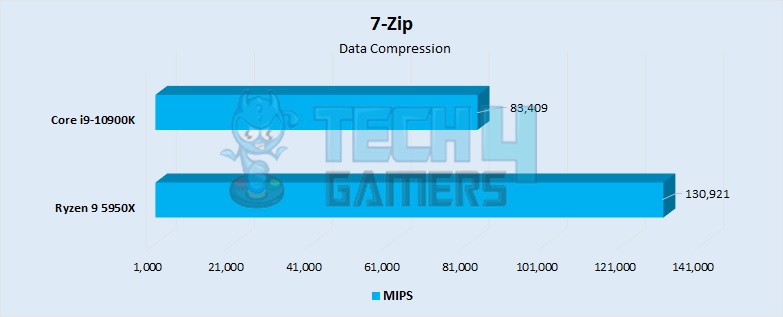
- The AMD Ryzen 9 5950X achieved a data compression speed of 130,921 MIPS at stock, significantly outperforming the Core i9-10900K, which reached 83,409 MIPS. This indicates that the Ryzen 9 5950X was approximately 57% faster in data compression than the Core i9-10900K.
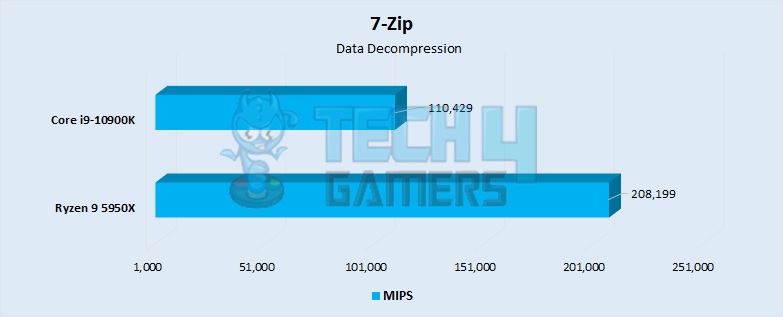
- In terms of data decompression speed at stock, the Core i9-10900K reached 110,429 MIPS, while the Ryzen 9 5950X managed an impressive 208,199 MIPS. Consequently, the Ryzen 9 5950X was approximately 88.5% faster at decompressing data compared to the Core i9-10900K.
Also Read: Ryzen 9 7950X Vs Ryzen 9 5950X
Adobe Software
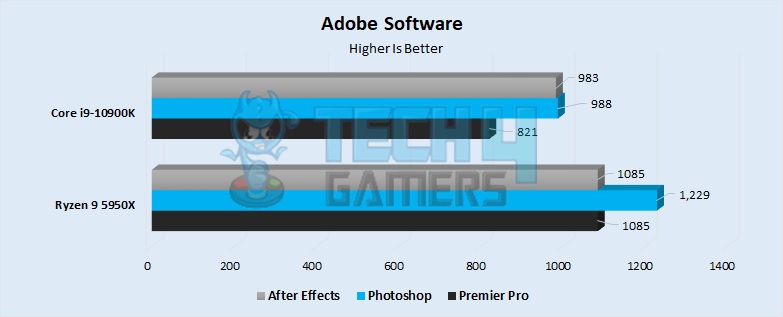
- In Adobe Premiere Pro 2022, the AMD Ryzen 9 5950X scored 1085 points, showing a performance advantage of approximately 32.2% over the Core i9-10900K, which scored 821.
- Adobe Photoshop 2022 also favored the AMD Ryzen 9 5950X, with a performance score of 1229, marking a 24.4% performance gain over the Core i9-10900K, which scored 988.
- Adobe After Effects 2022 witnessed a performance boost of around 10.4% for the Ryzen 9 5950X, which scored 1085, compared to the Core i9-10900K, which scored 983.
Similar Guides: Best RAM for Ryzen 9 5950x
Chromium Code Compile
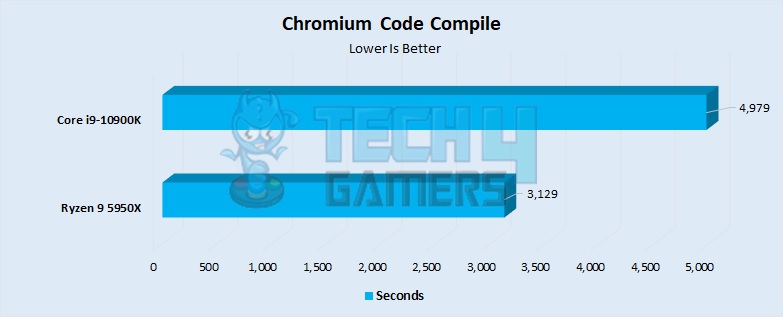
- In Chromium Code Compile, the Ryzen 9 5950X completed the task in 3129 seconds, outperforming the Intel Core i9-10900K, which took 4979 seconds. This results in the Ryzen processor being approximately 59.1% more efficient in this specific workload.
- The significant time difference in Chromium Code Compile underscores the superior performance of the Ryzen 9 5950X, showcasing its efficiency advantage over the Intel Core i9-10900K in this computing task.
Corona 1.3
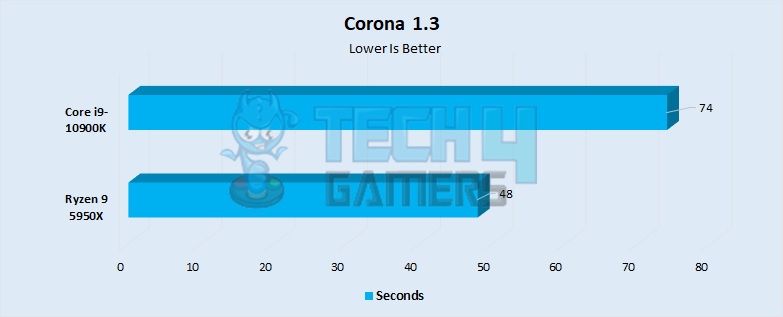
- In stock configuration, the AMD Ryzen 9 5950X completed the Corona Benchmark 1.3 rendering in 48 seconds, outperforming the Intel Core i9-10900K, which took 74 seconds. This indicates that the stock Ryzen 9 5950X is approximately 54.2% more efficient in this benchmark compared to the Intel Core i9-10900K.
Cinebench R20
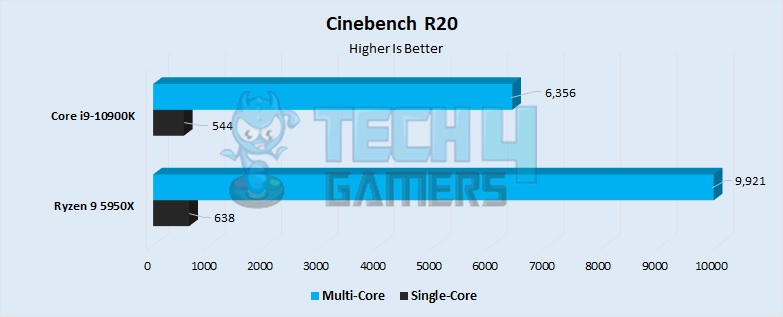
- In the stock configuration, the AMD Ryzen 9 5950X displayed a single-core score of 638 in Cinebench R20, outperforming the Intel Core i9-10900K, which scored 544. This translates to a single-core performance advantage of approximately 17.3% for the Ryzen 9 5950X.
- For multi-core performance, the Core i9-10900K scored 6356, while the Ryzen 9 5950X achieved 9921 in Cinebench R20. This indicates that the Ryzen 9 5950X’s multi-core performance is approximately 56.1% better than the Core i9-10900K in the stock configuration.
Cinebench R23
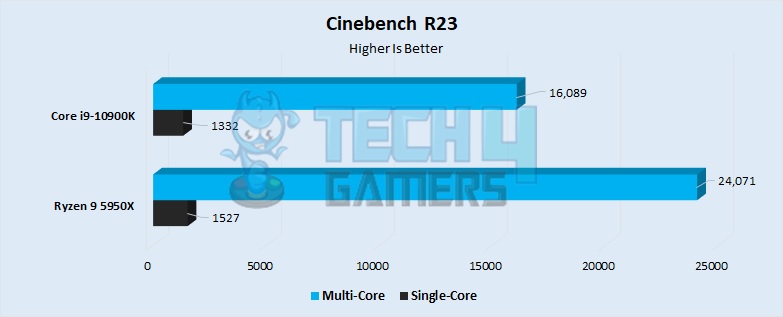
- In the Cinebench R23 single-core performance test, the AMD Ryzen 9 5950X outperforms the Core i9-10900K by approximately 14.64%, scoring 1527 compared to the Core i9-10900K’s 1332.
- In the multi-core performance test of Cinebench R23, the Ryzen 9 5950X achieves a multi-core score of 24071, while the Core i9-10900K scores 16089, indicating that the Ryzen 9 5950X’s multi-core performance is approximately 49.6% better than the Core i9-10900K.
Gaming Benchmarks
To put a face to the real performance of these cards in gaming scenarios, we pinned them against one another using the gaming rig mentioned below. We chose to do these tests in 1080p to ensure that the games are CPU-limited.
Gaming Rig
- OS – Windows 11
- RAM – Teamgroup T-Force Xtreem 48GB DDR5-8200 CL38
- CPU Cooler – Cooler Master MasterLiquid Lite ML240L RGB
- Graphics Card – GIGABYTE RTX 4090 Gaming OC 24G
- SSD – XPG Gammix S70 Blade 2TB NVMe
- Power Supply – ENERMAX REVOLUTION D.F. X 1050W
Hitman 2
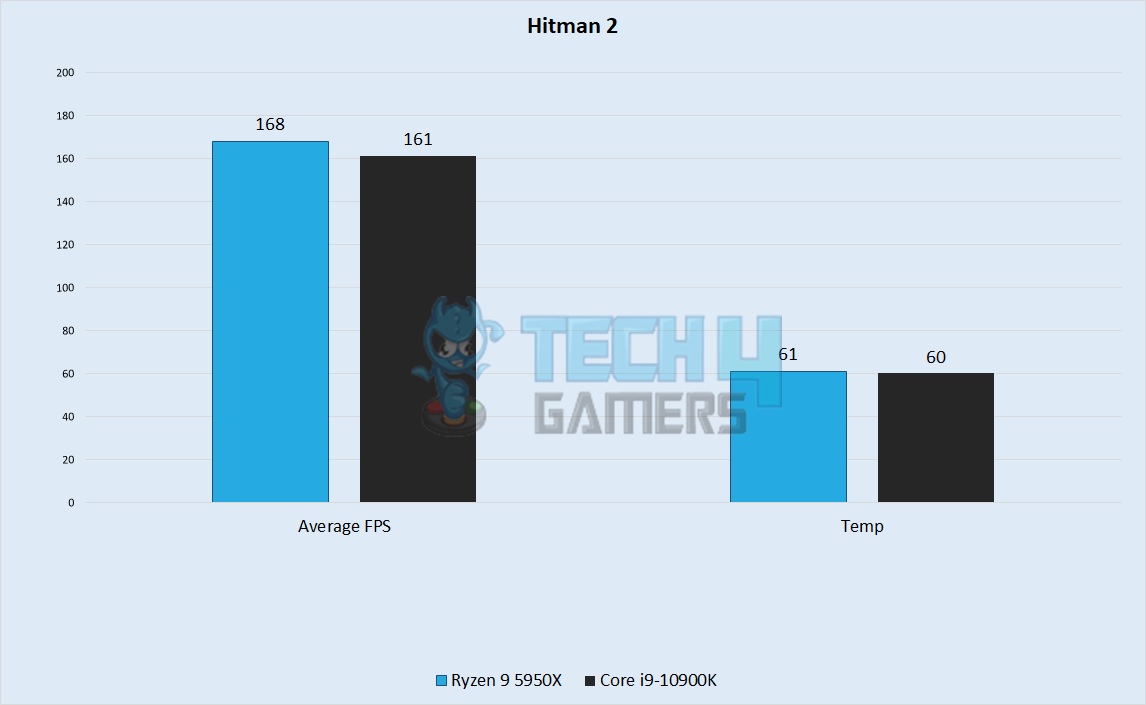
- In our testing of Hitman 2, the AMD Ryzen 9 5950X showcased approximately 4.35% better performance compared to the Intel Core i9-10900K. The Core i9-10900K delivered an average of 161 FPS, while the Ryzen 9 5950X exhibited a superior performance with an average of 168 FPS.
- While both CPUs operated at efficient temperatures, the Ryzen 9 5950X ran at 61°C, just one degree higher than the Core i9-10900K at 60°C.
- During gameplay, the CPU load on the Core i9-10900K was notably higher at 54%, representing a 23% increase compared to the Ryzen 9 5950X, which operated at a lower load of 31%.
Kingdom Come: Deliverance
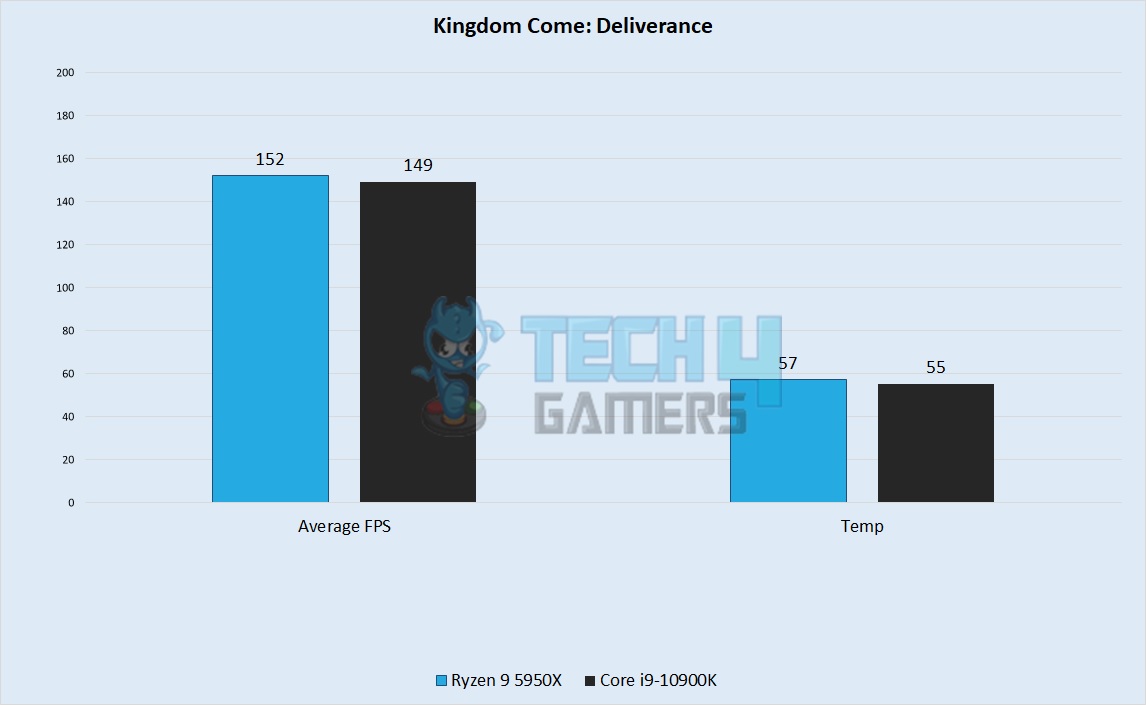
- In our run of the lesser-known title Kingdom Come: Deliverance, the AMD Ryzen 9 5950X showcased a 2.01% better performance compared to the Intel Core i9-10900K. The Ryzen 9 5950X delivered an average performance of 152 FPS, slightly surpassing the Core i9-10900K’s 149 FPS on average.
- The working temperature of the Ryzen 9 5950X during Kingdom Come: Deliverance reached 57°C, which was two degrees higher than the Core i9-10900K operating at 55°C.
- Furthermore, during gameplay, the CPU load on the Core i9-10900K was 15% higher, standing at 37%, in contrast to the Ryzen 9 5950X’s 22%.
Mafia Definitive Edition
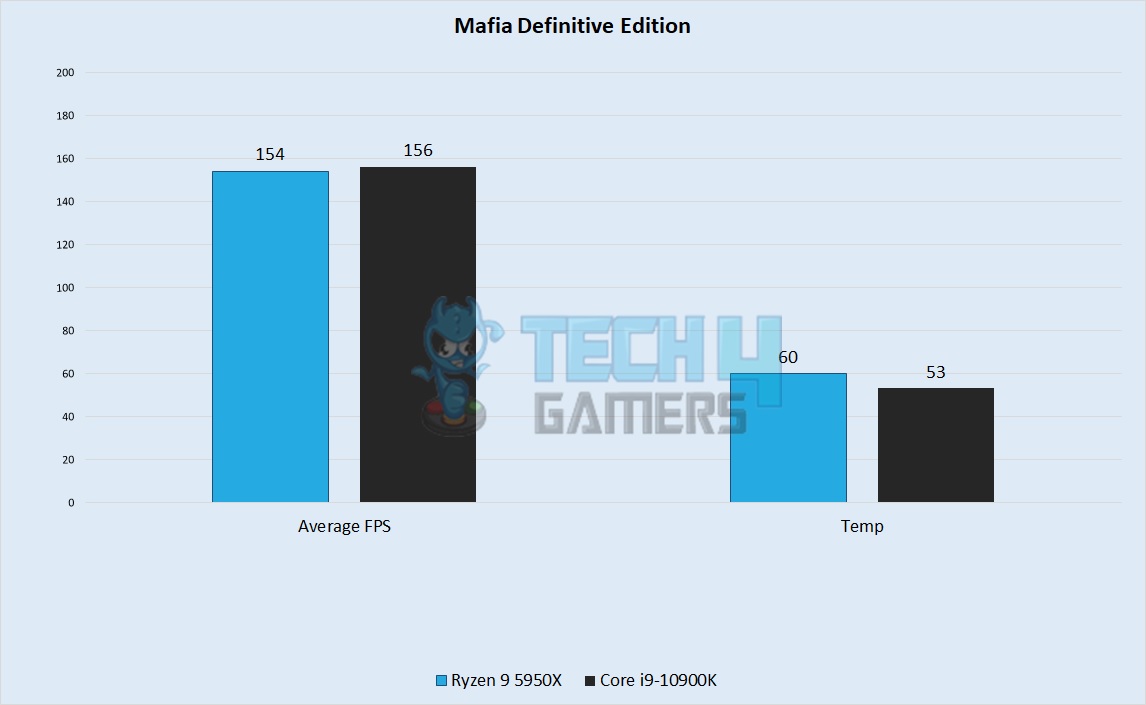
- Thugging ourselves out in our test of Mafia Definitive Edition resulted in an almost equivalent performance between our two cards. The Core i9-10900K achieved an average of 156 FPS, whereas the Ryzen 9 5950X managed an average of 154 FPS.
- The Ryzen 9 5950X’s operating temperature during Mafia Definitive Edition reached 60°C, which was seven degrees higher than the Core i9-10900K’s temperature of 53°C.
- In terms of CPU load during the game, the Core i9-10900K carried a load of 32%, while the Ryzen 9 5950X operated at 18% of its full load capacity.
Microsoft Flight Simulator
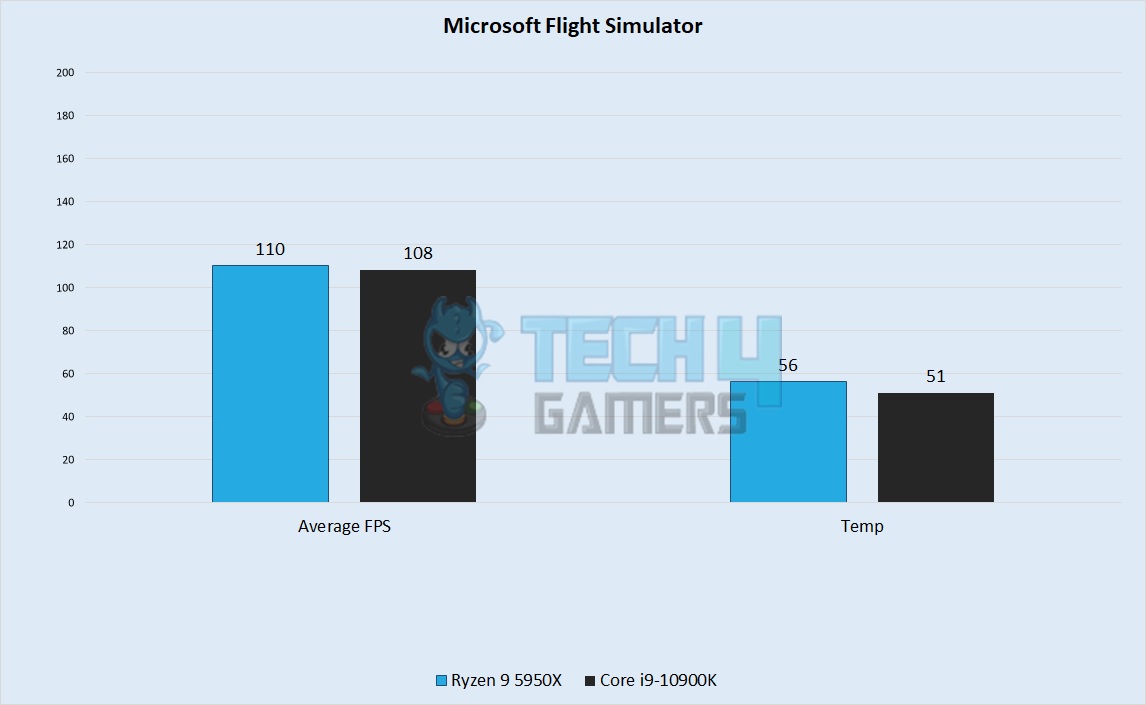
- In the GPU-intensive title Microsoft Flight Simulator, the AMD Ryzen 9 5950X showcased an advantage of two frames over the Core i9-10900K. The Ryzen 9 5950X delivered an average of 110 FPS, while the Core i9-10900K achieved an average of 108 FPS.
- During Microsoft Flight Simulator gameplay, the Ryzen 9 5950X operated at a temperature of 56°C, which was five degrees hotter than the Core i9-10900K’s 51°C.
- In terms of CPU load during gameplay, the Core i9-10900K’s load stood at 26%, while the Ryzen 9 5950X’s load was only 12% of its maximum capacity.
Similar Comparisons: Intel i9-13900k Vs Ryzen 9 7900X
Project Cars
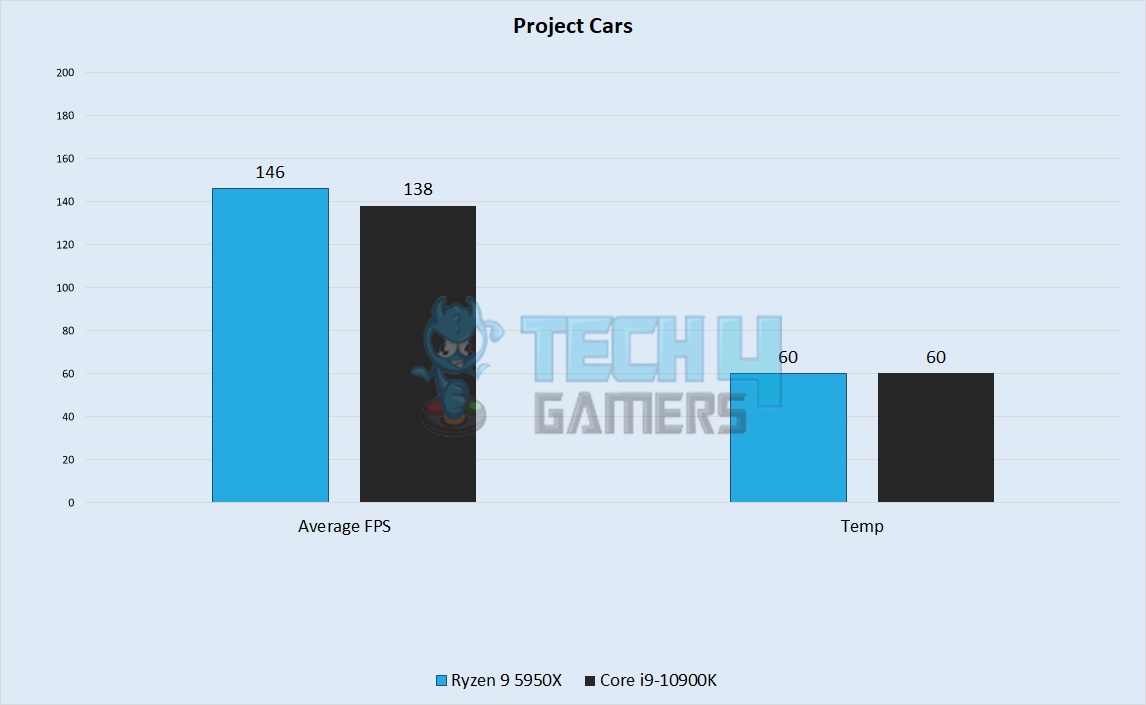
- Our run of Project Cars brought back some performance desparity between these two chips. The AMD Ryzen 9 5950X outperformed the Intel Core i9-10900K by approximately 5.8%. The Ryzen 9 5950X achieved an average performance of 146 FPS, surpassing the Core i9-10900K’s 138 FPS average.
- During Project Cars gameplay, both the Ryzen 9 5950X and the Core i9-10900K maintained the same operating temperature of 60°C.
- Notably, the Core i9-10900K had a CPU load of 24% during gameplay, whereas the Ryzen 9 5950X operated with a significantly lower 7% CPU load.
PUBG
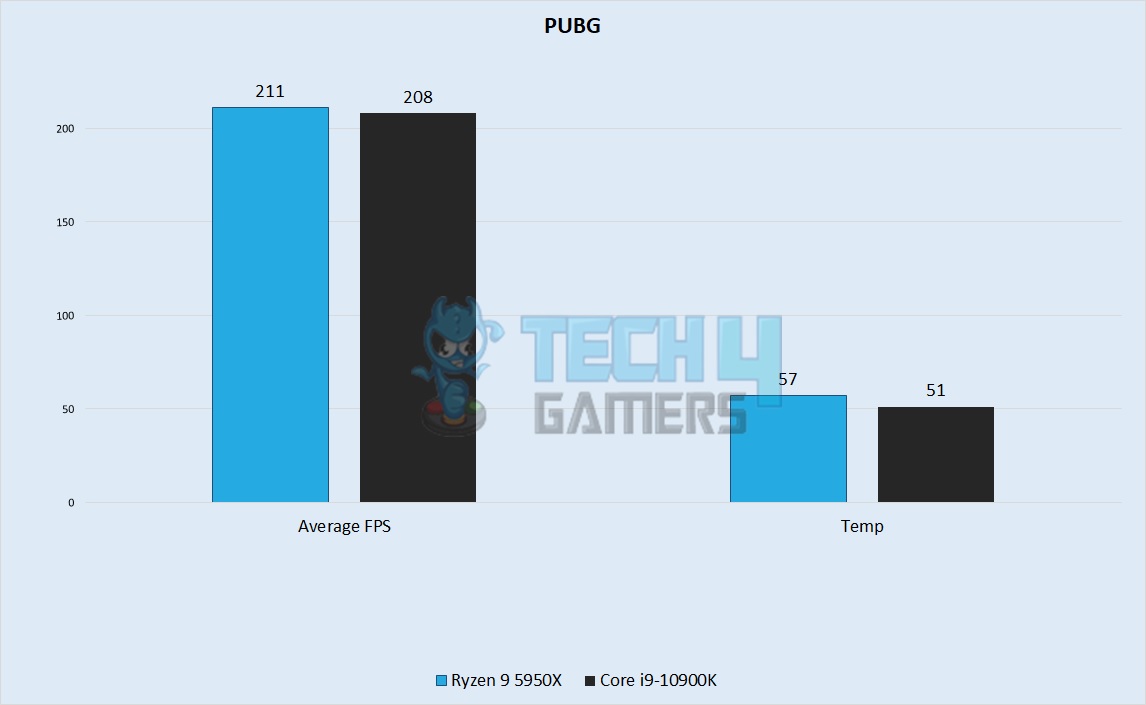
- Our test of PUBG showed the two processors to run this game at about the same level of fluidity. The Ryzen 9 5950X delivered an average frame rate of 211 FPS, surpassing the Core i9-10900K’s 208 FPS average.
- However, it’s important to note that the Ryzen 9 5950X operated at a slightly higher temperature of 57°C, which was six degrees higher than the Core i9-10900K’s temperature of 51°C.
- During gameplay, the CPU load on the Core i9-10900K was 23%, which was 15% higher than the Ryzen 9 5950X, which operated with a lower 8% CPU load.
The Witcher 3
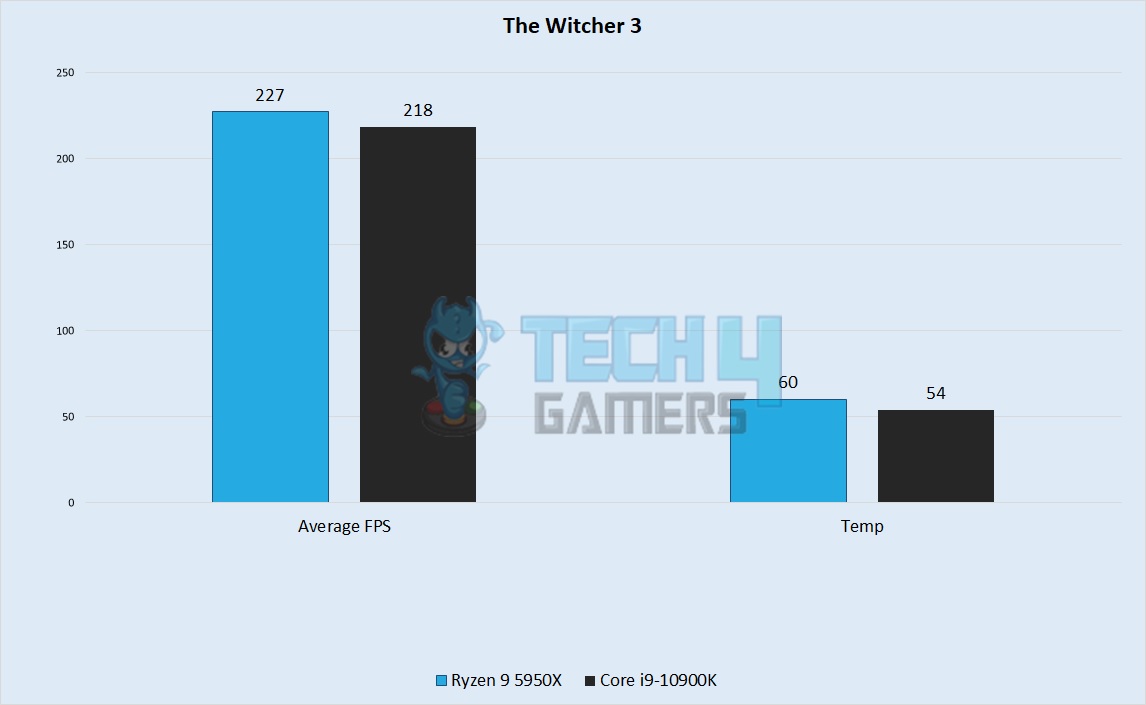
- In The Witcher 3: Wild Hunt, our Ryzen 9 5950X outperformed the Intel Core i9-10900K by approximately 4.15%. The Ryzen 9 5950X achieved an impressive average of 227 FPS, surpassing the Core i9-10900K’s 218 FPS average.
- However, it’s worth noting that the Ryzen 9 5950X operated at a slightly higher temperature of 60°C, which was six degrees hotter than the Core i9-10900K’s operating temperature of 54°C.
- During gameplay, the CPU load on the Core i9-10900K was 34%, which was 16% higher than the Ryzen 9 5950X, which operated with an 18% CPU load.
Overall Gaming Analysis
Let’s take a look at the overall gaming performance.
Framerate
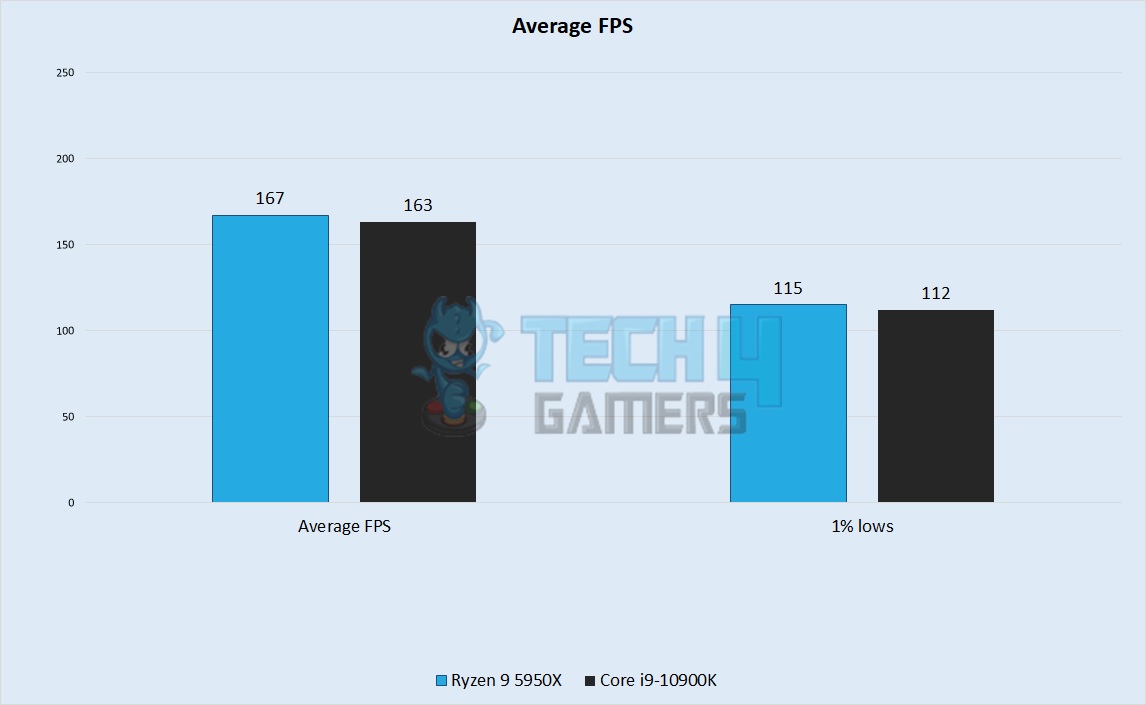
- In our 1080p gaming benchmarks, the AMD Ryzen 9 5950X outperformed the Intel Core i9-10900K, with a lead of 4.3 FPS or approximately 2.65%, although the Intel chip performed better in Mafia Definitive Edition.
- When it comes to 1% lows during our tests, the Ryzen 9 5950X had a 2.5% advantage over the Core i9-10900K, except for specific games where the Intel CPU had the upper hand.
Temperatures
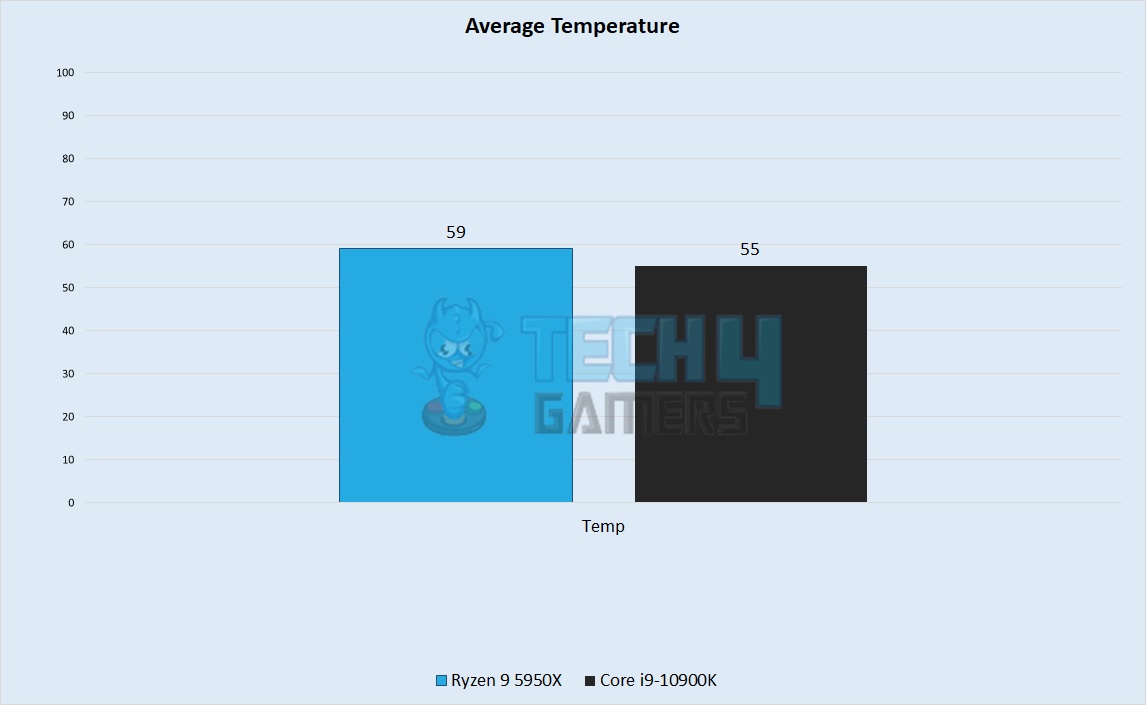
- While gaming at 1080p, our AMD Ryzen 9 5950X operated at an average temperature 3.9°C higher than the Intel Core i9-10900K. The Core i9-10900K averaged 54.8°C, whereas the Ryzen 9 5950X reached an average of 58.7°C.
- When comparing the 1080p gaming temperatures to their respective maximum junction temperatures, the Ryzen 9 5950X remained 31.3°C below its max temperature (90°C), while the Core i9-10900K had a larger margin, staying 45.2°C below its max temperature (100°C).
- Based on the information we’ve gotten out of our testing, it’s evident that the Core i9-10900K exhibits greater thermal efficiency when compared to the Ryzen 9 5950X during 1080p gaming scenarios.
Also Check: Ryzen 7 5800X3D Vs Ryzen 7 7700X
Price And Availability
- The i9 10900K goes for around $389, whereas the Ryzen 9 5950X is about a hundred dollars more expensive at $489.
- Being an almost four-year-old processor, the supply of the i9 10900K is dwindling at best in the used market. The Ryzen 9, however, is not too old, so you will be able to find it at computer parts retailers across the globe.
What We Recommend
Before making a recommendation, compare the specifications and performance of the Ryzen 9 5950X vs Core i9-10900K, two powerful CPUs from 2020.
- The Ryzen 9 5950X has an advantage with 6 additional cores and 12 threads compared to the Core i9-10900K.
- Core i9-10900K has a higher turbo clock frequency, reaching up to 5.3 GHz, while the Ryzen 9 5950X maxes out at 4.9 GHz.
- Both CPUs support DDR4 memory, but Ryzen 9 5950X offers faster memory speed and bandwidth. Additionally, Ryzen 9 5950X supports ECC memory, while Core i9-10900K does not.
- In our productivity tests, the Ryzen 9 5950X outperforms the Core i9-10900K in most tasks by quite a large margin, except for data encryption and decryption.
- Notable differences in gaming performance and thermal efficiency were observed in our tests at the 1080p gaming resolution, with the Ryzen 9 5950X leading by 2.65% in performance but running 3.9°C hotter than the Core i9-10900K.
- Based on these factors, opt for the Intel Core i9-10900K for better value for money. It performs well in both gaming and productivity tasks and saves around $100. If budget is not a concern, the AMD Ryzen 9 5950X is the choice for superior specs and performance.
Pros And Cons
| AMD Ryzen 9 5950X | Intel i9-10900K | ||
| Pros | Cons | Pros | Cons |
|
|
|
|
Related Articles:
- Ryzen 7 5800X3D Vs. i5-13600K
- Ryzen 7 7700X Vs. Ryzen 5 7600X
- Intel 13th-Gen Vs. AMD Ryzen 7000 Series
Thank you! Please share your positive feedback. 🔋
How could we improve this post? Please Help us. 😔
[Hardware Reviewer]
Hi! I’m Ali Tauseef, and I have been writing for Tech4Gamers since 2022. I love all things computer hardware but am particularly fond of CPUs and motherboards, and I like to stay up-to-date about the latest advancements in these worlds, and when possible, write about it. When I’m not doing that, I like to get into a little FPS action in CS2 or get lost in the vast world of RDR2.
Get In Touch: ali@tech4gamers.com


