- I found that the RTX 4080 outperformed the RX 7900 GRE by about 35%, making some choppy games much more pleasant to play.
- I noticed that the difference in power consumption was not a lot, about 30 watts in our testing.
- The RTX 4080 is well suited for those looking for a future-proof setup without budget constraints, while the RX 7900 GRE is an excellent option for those who can acquire it.
Comparison Table
| Technical Specs | RTX 4080 | RX 7900 GRE |
|---|---|---|
| Shading units | 9728 | 5120 |
| RT Cores | 76 | 80 |
| Approximated Price | $829-$1890 | $663 |
| Launch Date | Sep 20th, 2022 | Jul 27th, 2023 |
| Best Variants | Best RTX 4080 | – |
| Best Power Supply | Best PSU for RTX 4080 | – |
Architectural Differences
- Process Size: The RTX 4080 uses a bog standard 5nm manufacturing process, whereas the AMD card utilizes both 5nm and 6nm manufacturing cores.
- Clock Speed: The RTX 4080 clocks in at 2205MHz at its base, whereas the GRE dials it down to 1287 MHz. The gap closes with the boost clock, with Nvidia’s card boosting to 2505MHz, whereas the RX 7900 GRE has a boost clock of up to 2245MHz.
- TDP: The great performance of the RTX 4080 also uses a lot of juice to sustain, resulting in a TDP of 320 watts, whereas the GRE has a significantly lower TDP at 260 watts.
- VRAM: Both the RTX 4080 and RX 7900 GRE have a 16GB memory buffer, but the RTX uses faster GDDR6X memory instead of the GDDR6 memory the AMD card uses.
- Bus Width & Bandwidth: The similarly sized VRAM buffer of both cards uses a 256-bit bus. The RTX 4080 has a bandwidth of 716.8 GB/s over RX 7900 GRE’s 576.0 GB/s.
- Other Differences: RTX 4080 uses DLSS for better performance with minimal visual difference. AMD’s FSR is a comparable feature, but DLSS is known for superior visual quality. However, the DLSS used here is slightly different from the one used in RTX 4070.
RX 7900 GRE Vs RTX 4080: Gaming Benchmarks At 4K
It’s hard to get a feel of the performance of a card by just seeing numbers on a spec sheet. That is why I’m bringing you the benchmarks where games will be played at their native resolution on 4K.
Testing Rig
- CPU: Ryzen 7 7800X3D
- Memory: Corsair Vengeance RGB DDR5 – 6000MHz
- Storage Drive: XPG Gammix S70 Blade 2TB NVMe
- Power Supply: be quiet! Dark Power Pro 13 1300W
- CPU Cooler: Corsair ICUE H150I Elite
Resident Evil 4
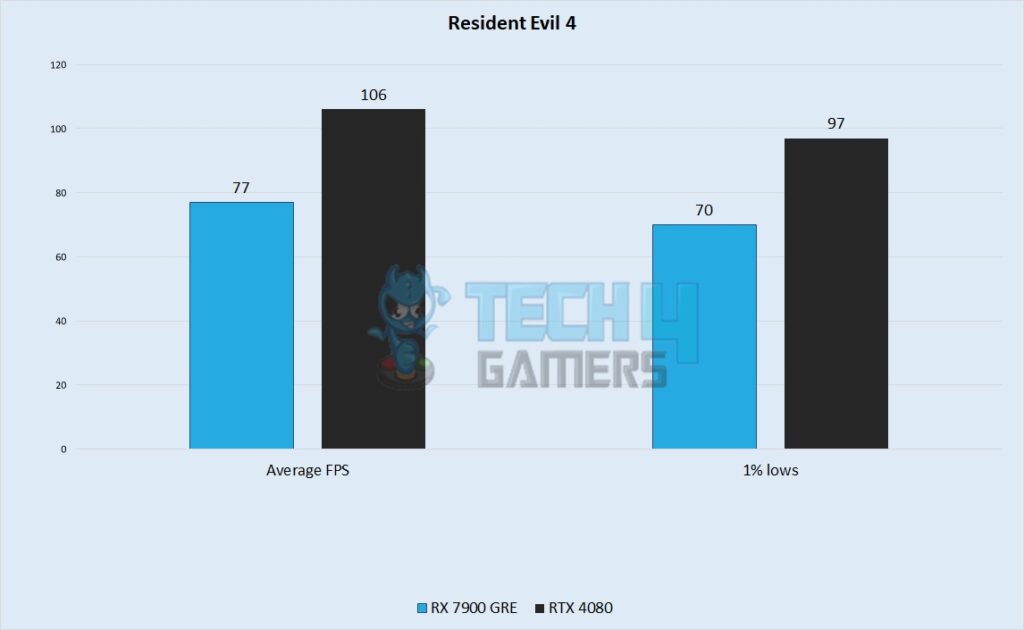
- I found that the RX 7900 GRE obtained an average framerate of around 77 FPS, whereas the RTX 4080 had a much higher average of around 106 FPS.
- 1% lows were also much smoother on Nvidia’s card at around 97 FPS, whereas the GRE gave me minimums hovering around 70 FPS.
The Last Of Us
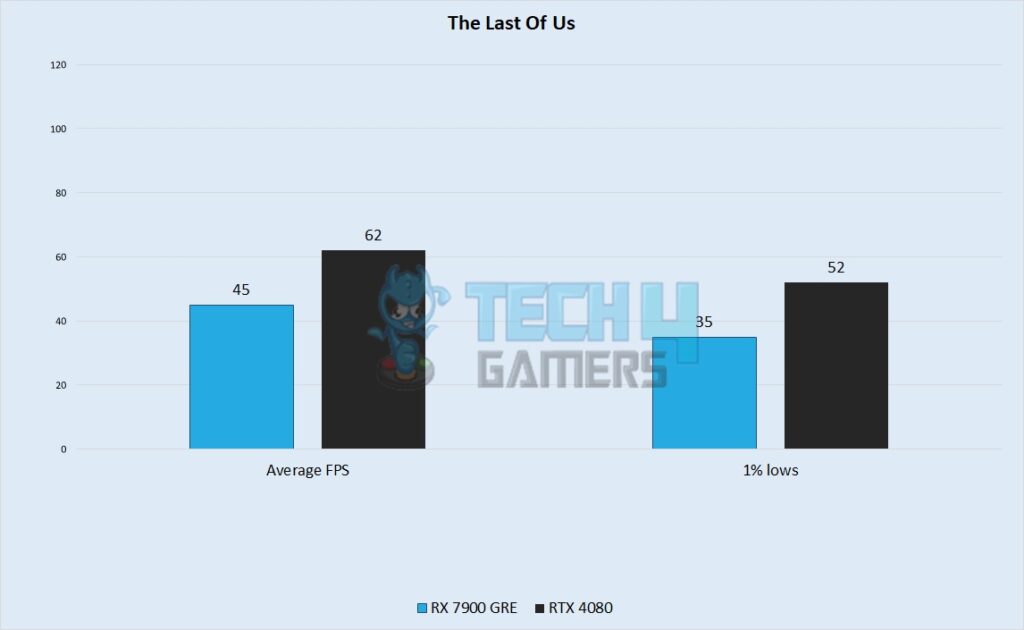
- I observed that in The Last Of Us on 4K ultra settings, both cards were faced with a challenge with the RTX 4080 averaging 62 FPS over the RX 7900 GRE’s 45 FPS.
- For 1% lows, I noticed that the RX 7900 GRE performed even worse, with an average of 35 FPS over its rival’s 52 FPS.
Hogwarts Legacy
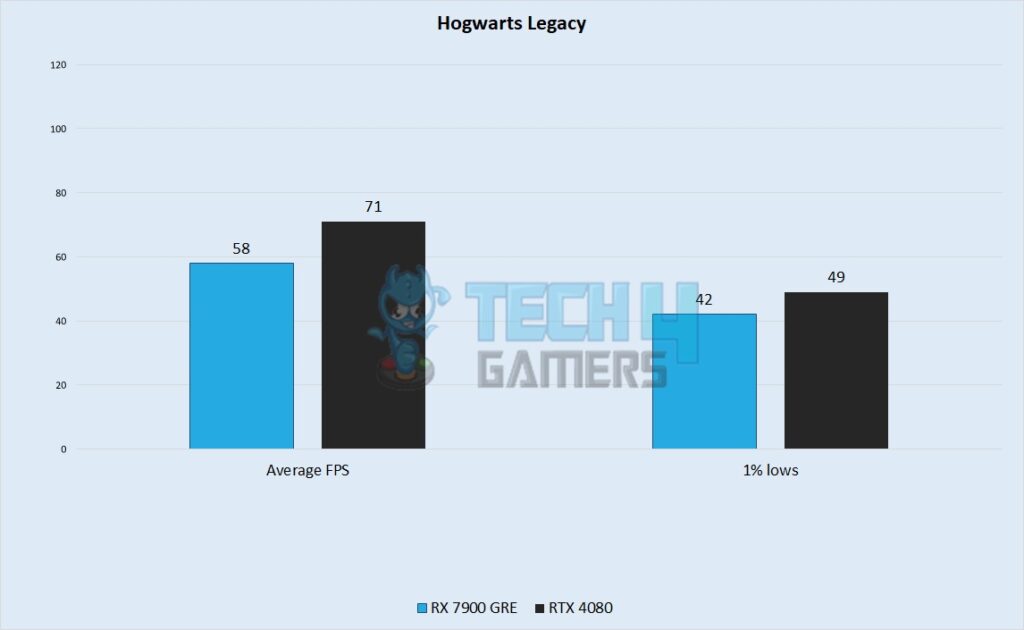
- In Hogwarts Legacy, the RTX 4080 led with an average framerate of around 71 FPS, surpassing the RX 7900 GRE, which averaged around 58 FPS.
- Despite the distinct average performance, the RX 7900 GRE hit lows of about 42 FPS, while the RTX 4080 recorded minimums of around 49 FPS.
Forza Horizon 5
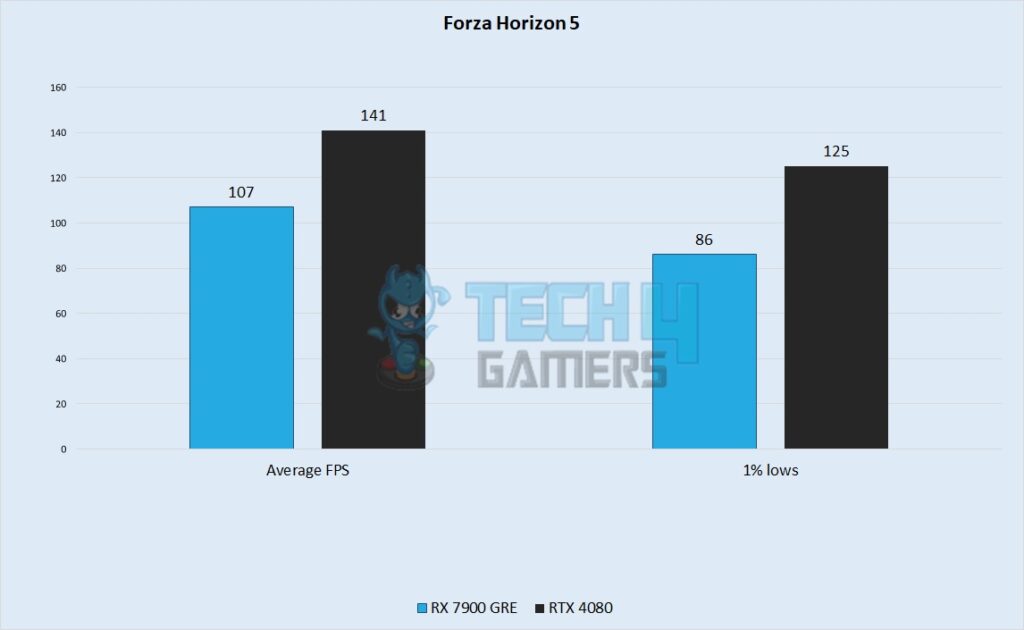
- The RX 7900 GRE achieved an average of 107 FPS on the extreme preset at 4K, while the RTX 4080 surged ahead with a remarkable average of 141 FPS.
- I discovered that the RTX 4080 continued to outpace its rival in 1% lows, achieving 125 FPS, while the RX 7900 GRE lagged behind with around 86 FPS in this aspect.
Fortnite
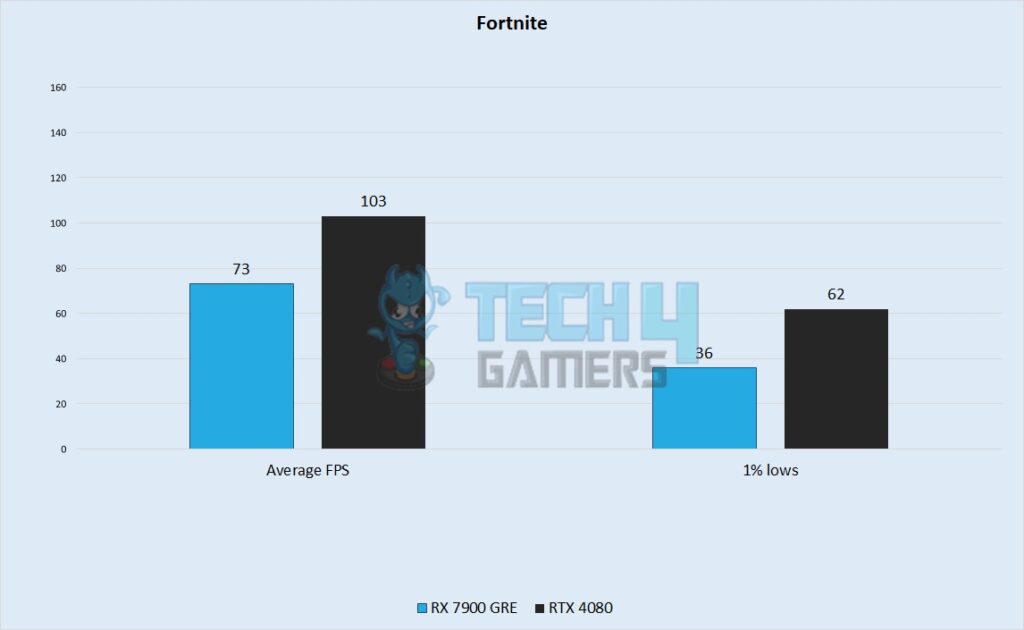
- On Fortnite, the RTX 4080 handled elegantly with an average framerate of 103 FPS, outperforming the RX 7900 GRE significantly, which averaged around 73 FPS.
- As for the 1% lows, the RTX 4080 dipped to 62 FPS in graphically intense scenes. The RX 7900 GRE suffered more, plummeting to an average of around 36 FPS.
A Plague Tale: Requiem
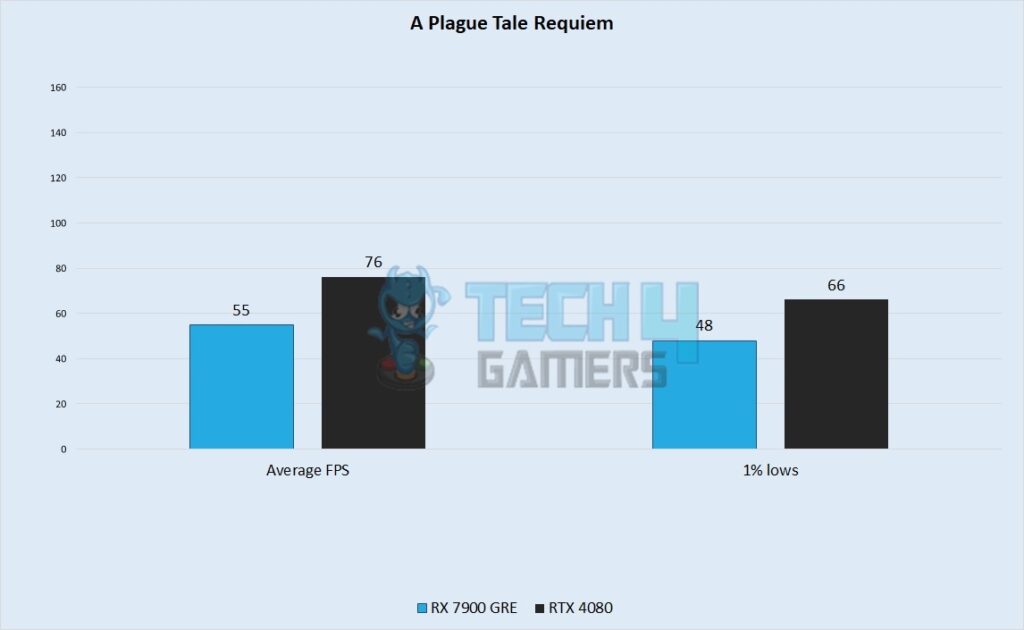
- The RTX 4080 achieved an average framerate of 76 FPS, outpacing the RX 7900 GRE, which managed a playable average of 55 FPS.
- The RTX 4080, reached a minimum framerate of 66 FPS—10 frames below the average. Meanwhile, the RX 7900 GRE experienced lows of around 48 FPS in our benchmark.
Overall Gaming Performance
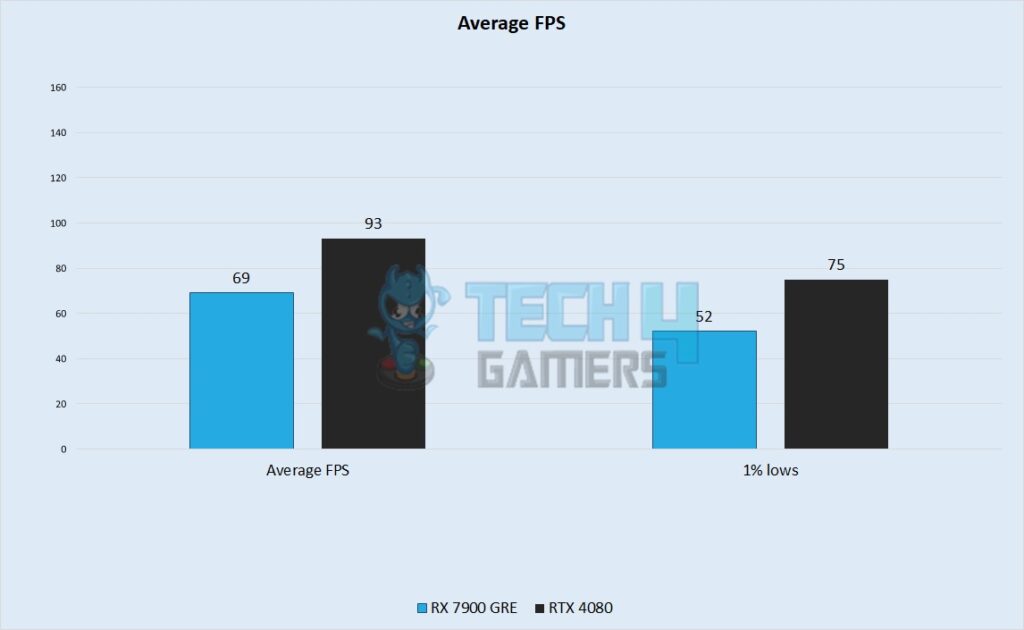
On 4K, I’ve seen the RTX 4080 obtain an average framerate of around 93 FPS, whereas the RX 7900 GRE averaged 69 FPS. The RTX 4080 was, on average, 35% more performant than the RX 7900 GRE. The RTX 4080 had higher 1% lows averaging 75 FPS over RX 7900 GRE’s lows hovering around 52 FPS.
Power Consumption
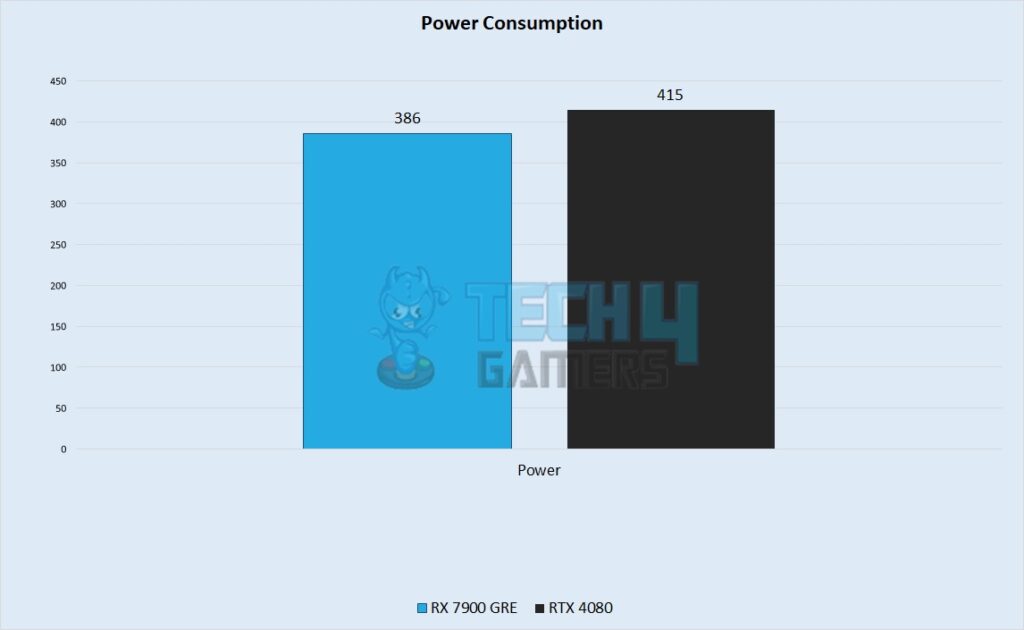
While testing the RX 7900 GRE, it showed an average of 386 watts of power, whereas the RTX 4080 drew 415 watts. On average, the RTX 4080 took 4.5 watts to produce one frame at 4K, whereas the RX 7900 GRE consumed around 5.6 watts to render every single frame, making the RTX around 24% more power efficient.
Price And Availability
The RTX 4080 is currently being sold at a price range of $1299-1899, whereas the RX 7900 GRE is priced at more than half the amount at $663. However, RX 7900 GRE is currently a China-only graphics card. The most common way of getting this card is through PC manufacturers that deal with Chinese retailers, so this card is not available to most people at the moment.
RTX 4080 Vs RX 7900 GRE: Which One Do I Recommend?
RTX 4080: The RTX 4080 is the best option for those who aren’t limited by any budget. Even at 4K, it crosses the 80 FPS mark with incredible ease providing you with exceptional performance. I recommend you go for it if you want to build a future-proof setup.
RX 7900 GRE: I recommend the RX 7900 GRE to all those who can acquire this rare card as it is not widely available on the internet. It offers an exceptionally great price-to-performance ratio and should be acquired as soon as you can find it.
Any decision you make should always align with your personal preferences and requirements so you gain the utmost satisfaction.
Pros And Cons
| CPU | Pros | Cons |
|---|---|---|
| RX 7900 GRE | ✅ Half as cheaper. ✅ Consumes slightly less power. | ❌ Significantly lower performance. ❌ No frame generation technology (as of yet) |
| RTX 4080 | ✅ Higher performance ✅ Ability to use DLSS 3. | ❌ Much more expensive. ❌ More power hungry. |
Frequently Asked Questions
The RTX 4080 has about 76 RT cores, whereas the RX 7900 GRE is fitted with 80 RT cores.
As most games are not that CPU intensive at 4k, you can get away with using an i7 13700K in your RTX 4080 rig.
The RX 7000 graphics cards from AMD have a similar performance hit when using ray tracing as the RTX 3000 series.
More From RX 7900 GRE
More From RTX 4080
Thank you! Please share your positive feedback. 🔋
How could we improve this post? Please Help us. 😔
Feedback By:
Jackson
Mia
Wilson
Martinez
Mason
Miller
Noah
Emma
Ethan
[Comparisons Expert]
Abdemanaf is a skilled creative writer who has been honing his craft since 2011. While initially working in different fields, he found a passion for technology and has been exploring the tech world since early 2015. Over the years, he has developed an in-depth knowledge of the latest tech trends and product offerings by various companies.
Abdemanaf’s writing reflects his analytical mindset and ability to think critically. He has a knack for breaking down complex technical information into easily digestible pieces, making his articles engaging and accessible to readers from all backgrounds. In February 2022, he joined Tech4Gamers as a blog and product comparison writer, where he has been able to hone his skills further.
As a writer, Abdemanaf is dedicated to staying up-to-date with the latest technological advancements and trends, enabling him to provide readers with the most relevant and accurate information. He is always eager to learn more and is constantly seeking new challenges to improve his skills.
Get In Touch: manaf@tech4gamers.com


 Threads
![RTX 2060 Vs GTX 1660 Ti [We Tested 11 Games] GeForce RTX 2060 Vs GTX 1660 Ti](https://tech4gamers.com/wp-content/uploads/2023/05/GeForce-RTX-2060-Vs-GTX-1660-Ti-218x150.jpg)