


AMD Radeon RX 7800 XT
Rated: 9.2/10
Nvidia GeForce RTX 3080
Rated: 8.8/10
Pros And Cons
| GPU | Pros | Cons |
|---|---|---|
| AMD Radeon RX 7800 XT | ✅ Fantastic performance in budget ✅ Effective cooling system | ❌ Lags in ray tracing and upscaling |
| Nvidia GeForce RTX 3080 | ✅ Good for 1080p and 1440p gaming ✅ Superb ray tracing and upscaling performance | ❌ High Power Consumption ❌ Price of brand new card is still very high |
- I found that the RX 7800 XT demonstrated a 4.4% performance boost in 1440p gaming and a 2.9% improvement in 4K gaming.
- Based on my testing, the RX 7800 XT system consumed 22.3% less power than the RTX 3080 in the 1440P gaming stress test.
- Regarding the current GPU price, a refurbished RTX 3080 costs around $499, while a brand new RX 7800 XT also costs the same, around $499.
- I suggest opting for the RX 7800 XT due to its superior gaming performance, greater value and commendable energy efficiency.
Comparison Table
| Feature | AMD Radeon RX 7800 XT | Nvidia GeForce RTX 3080 |
|---|---|---|
| GPU Name | Navi 32 | GA102 |
| Architecture | RDNA 3 | Ampere |
| Shading Units | 3840 Stream Processors | 8704 CUDA Cores |
| RT Cores | 60 | 68 |
| Memory Bus Width | 256-bit | 320-bit |
| Memory Bandwidth | 624.1 GB/s | 760.3 GB/s |
| Best Variants | Best 7800 XT Cards | Best RTX 3080 Cards |
Architectural Differences
- Process Node: The RX 7800 XT uses the “multi-node design” like the rest of the RDNA 3 lineup, using a TSMC’s 5nm node for the GCD and 6nm for the MCD. In contrast, the RTX 3080 uses Samsung’s 8nm node.
- Frequencies: The RX 7800 XT clocks 1295MHz (core) at the base setting while the RTX 3080 runs faster at 1440MHz. As for boost frequencies, the RX 7800 XT pushes to 2430MHz compared to the RTX 3080’s speed of 1710MHz.
- VRAM: As has been the case so often, AMD takes the win regarding memory capacity with 16GB over 10GB of Nvidia’s Ampere card. Concerning memory type, though, the RTX 3080 uses superior GDDR6X memory chips over GDDR6.
- TDP: The RX 7800 XT has a TDP of 263 watts, about 21% lower than the RTX 3080 (320 watts).
- Supported Technologies: The RX 7800 XT supports FSR 3, while the RTX 3080 supports all DLSS versions older than DLSS 3. Furthermore, both cards use second-generation ray tracing accelerators from their respective manufacturers.
The introduction of AMD’s midrange RX 7000 series cards has raised new questions concerning how they stack up versus its longtime rival, Nvidia GPUs. Today, I’ll compare the RX 7800 XT vs RTX 3080 to find the better GPU in terms of performance, efficiency and value.
RX 7800 XT Vs RTX 3080: Gaming Benchmarks
I will play five games on these GPUs, testing the RX 7800 XT vs RTX 3080 at 1440p and 4K resolutions. I played every game at ultra settings or the highest equivalent preset available. The system I used to test these cards had the following specs.
Test Bench
- OS: Windows 11
- CPU: Intel Core i7-13700K
- Motherboards: MSI Z790 Tomahawk Max WiFi Motherboard
- RAM: G.Skill Trident Z5 RGB 32GB DDR5-6600 CL34 Kit
- SSD: Sabrent Rocket 4 Plus 1TB NVMe SSD
- PSU: Enermax Revolution D.F. X 1050W
- CPU Cooler: Noctua NH-L9x65 chromax.black CPU Air Cooler
Cyberpunk 2077 – 1440P
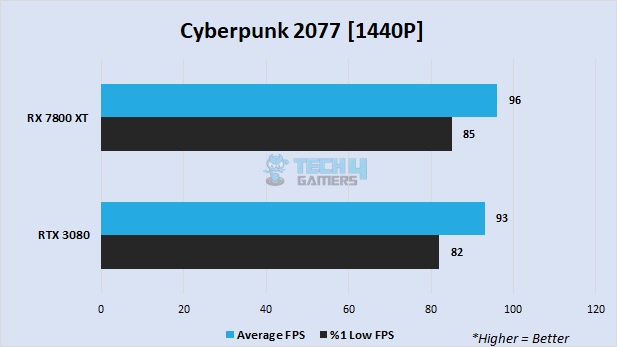
- The RX 7800 XT started strong in my first benchmark of Cyberpunk 2077 at 1440P, averaging 96 FPS, slightly ahead of the RTX 3080’s 93 FPS.
- Regarding the %1 lows, the RX 7800 XT maintained 85 FPS, while the RTX 3080 achieved 82 FPS, indicating a relatively close performance in this aspect.
Cyberpunk 2077 – 4K
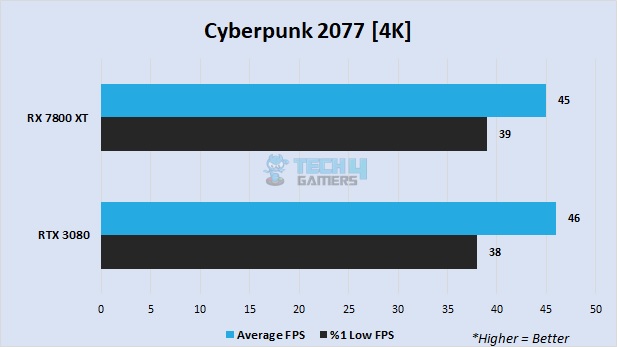
- At 4K resolution, the RTX 3080 took a slight lead in average FPS with 46 FPS in my 4K benchmark, edging out the RX 7800 XT by 1 FPS.
- When considering the %1 low FPS, the RX 7800 XT maintained 39 FPS, leading by just 1 FPS again in this aspect.
Hogwarts Legacy – 1440P
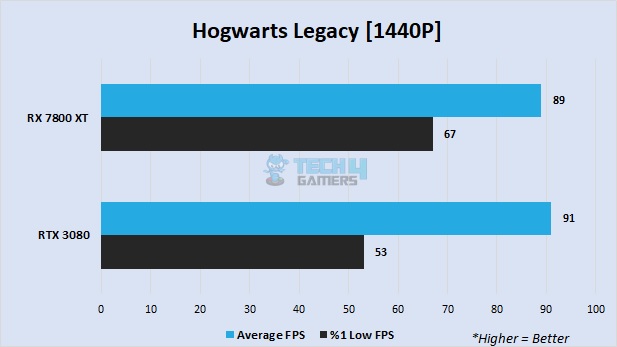
- Moving on to Hogwarts Legacy, at 1440P resolution, the Radeon RX 7800 XT achieved an average FPS of 89 in my test, trailing by just 2 FPS.
- In terms of the %1 low FPS, the RX 7800 XT took a significant lead, outperforming its competitor by 26.4%.
Hogwarts Legacy – 4K
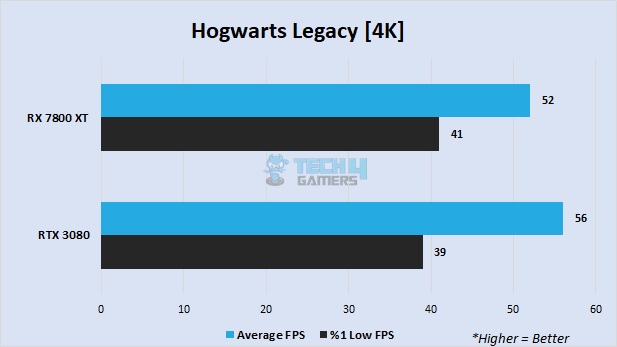
- In my testing, I noticed that the RTX 3080 extended its lead by 4 FPS in terms of average FPS when running the game at 4K resolution. When examining the %1 lows, I observed that the RX 7800 XT achieved 41 FPS, surpassing the GeForce RTX 3080, which scored 39 FPS.
Forza Horizon 5 – 1440P
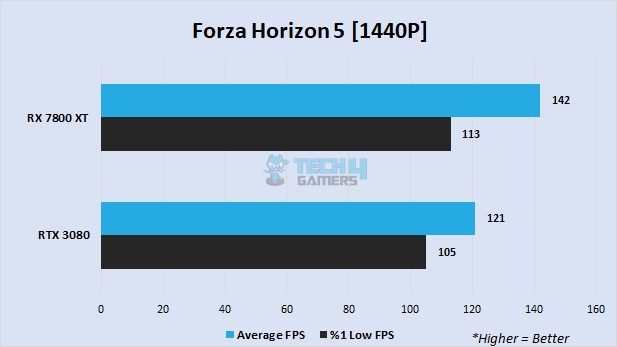
- In my Forza Horizon 5 test, I observed the RX 7800 XT scoring 142 FPS at 1440P resolution. In response, the RTX 3080 managed 121 FPS.
- Regarding the %1 lows, the RX 7800 XT secured another victory with 113 FPS, establishing a 7.6% lead in this aspect.
Forza Horizon 5 – 4K
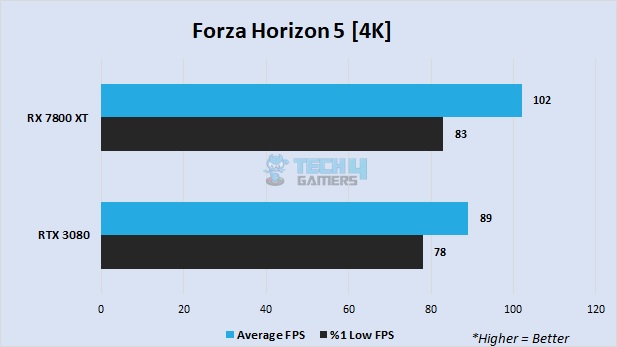
- Meanwhile, in my 4K gaming benchmark, I observed the RX 7800 XT achieving an average FPS of 102, which was still ahead of the Nvidia GeForce RTX 3080’s 89 FPS by a decent margin.
- When looking at the %1 low FPS figures, there was a contrast of 5 FPS between the two GPUs, with the RX 7800 XT taking the lead in this case.
Resident Evil 4 – 1440p
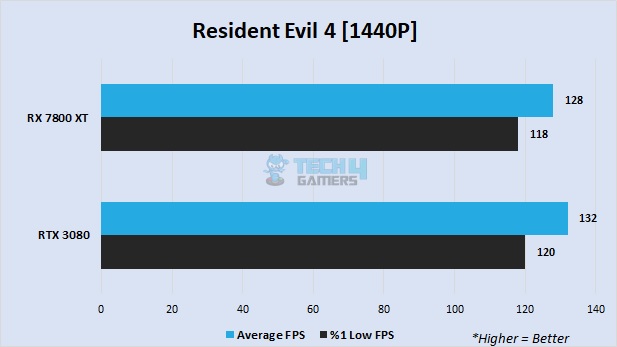
- In my next benchmark, Resident Evil 4 at 1440P, the RTX 3080 managed to outperform the AMD Radeon RX 7800 XT by 3.1%.
- Examining the %1 lows, the RX 7800 XT marginally trailed the RTX 3080 in this aspect.
Resident Evil 4 – 4K
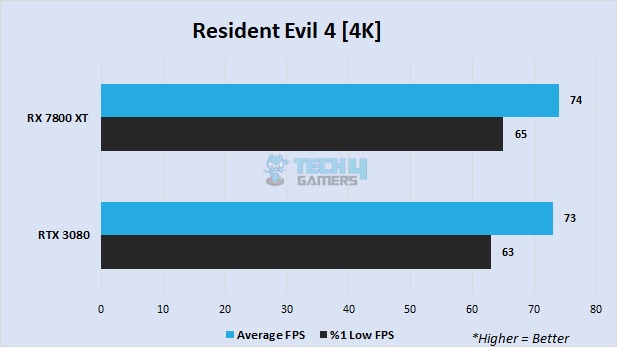
- When I switched over to 4K resolution, the AMD RX 7800 XT averaged 74 FPS, closely followed by the RTX 3080, which scored 73 FPS.
- Regarding the %1 lows, the RTX 3080 achieved 63 FPS, while the RX 7800 XT scored slightly higher at 65 FPS.
The Last Of Us Part 1
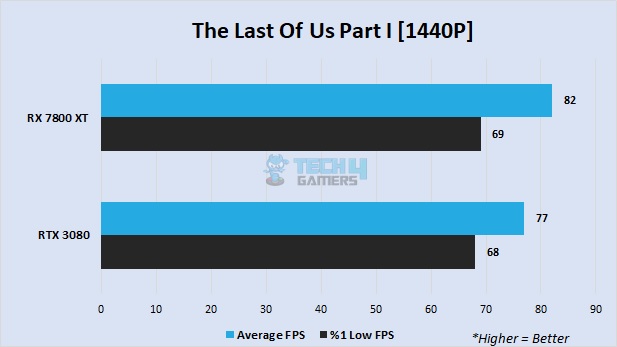
- My final gaming benchmark is The Last of Us Part 1. At 1440P resolution, the RX 7800 XT’s average tally was 82 FPS, while Nvidia’s RTX 3080 averaged 77 FPS.
- The RX 7800 XT achieved 69 FPS, which was only 1 FPS higher than the RTX 3080 in terms of %1 lows.
The Last of Us Part 1 – 4K
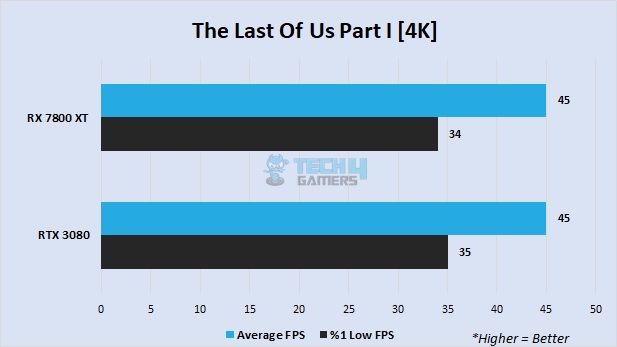
- Finally, both the graphics cards achieved an average of 45 FPS at 4K resolution. Additionally, I only saw a 1 FPS difference between the two GPUs in terms of the %1 low FPS score.
Overall Gaming Performance
1440P Performance
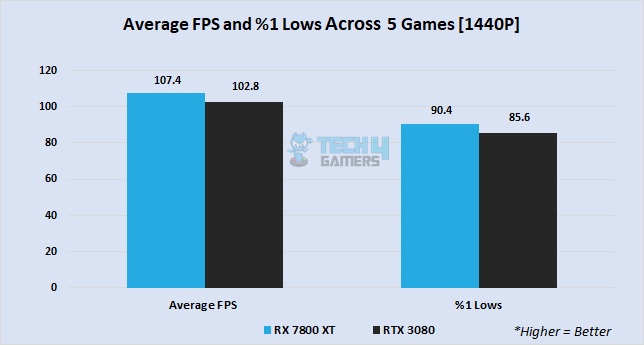
Across my 1440P gaming tests, the RX 7800 XT recorded an average of 107.4 FPS, whereas the RTX 3080 averaged 102.8 FPS, indicating that the RX 7800 XT is approximately 4.4% faster than the RTX 3080 in 1440P gaming.
Regarding the %1 low FPS, the RX 7800 XT scored 90.4 FPS, while the RTX 3080 scored 85.6 FPS, signifying a 5.6% difference between them.
4K Performance
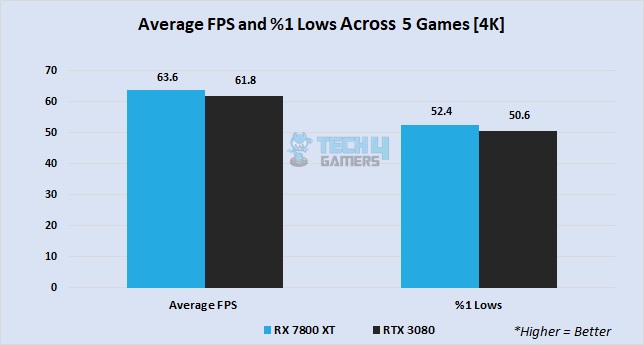
Across the five tests, my results show that the achieved an average of 63.6 FPS, whereas the RTX 3080 accumulated 61.8 FPS. Consequently, the RX 7800 XT demonstrated itself to be 2.9% faster than the RTX 3080 in 4K gaming.
Regarding the %1 low FPS, the RX 7800 XT averaged 52.4 FPS, while the RTX 3080 averaged 50.6 FPS, showing a difference of 1.8 FPS between them.
Winner: AMD Radeon RX 7800 XT
System Power Consumption
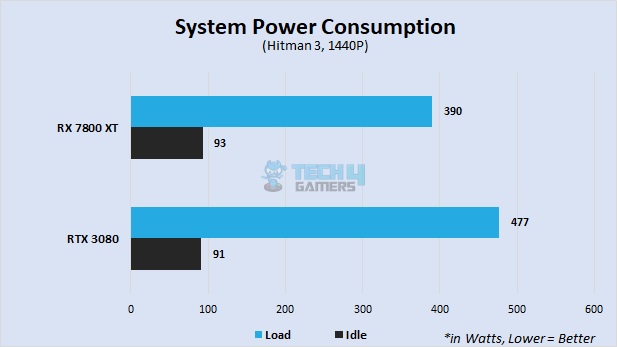
During my Hitman 3 stress test, I saw that the RX 7800 XT system consumed 390 watts, while the RTX 3080 bench used up 477 watts of power. As a result, the RTX 3080 consumes about 22.3% more power in 1440P gaming. At idle, the RX 7800 XT system consumed 93 watts, while the RTX 3080 system used 91 watts of power.
Winner: AMD Radeon RX 7800 XT
Prices And Value
| GPU | Launch MSRP | Current Price |
|---|---|---|
| AMD Radeon RX 7800 XT | 💲499 | 💲499 |
| Nvidia GeForce RTX 3080 | 💲699 | 💲499 (Refurbished) |
| Price Difference | 40% | 0% |
Given the present GPU market conditions, the RX 7800 XT is a cost-effective choice, boasting enhanced performance and remarkable energy efficiency, ultimately reducing electricity expenses.
Final Verdict – What Do I Recommend?
Radeon RX 7800 XT: This card is the pinnacle of AMD’s GPU technology, boasting advanced features and exceptional gaming performance while maintaining energy efficiency. It presents unparalleled value in the realm of graphics cards.
GeForce RTX 3080: The RTX 3080 is among the best performance cards of the RTX 30 series. It has better ray tracing and upscaling capabilities due to Nvidia’s best DLSS technology. However, the RTX 3080 has high power consumption.
After thoroughly analyzing both GPUs, I suggest opting for a graphics card that aligns more closely with your requirements. In my view, the RX 7800 XT stands out as the superior choice due to its exceptional value proposition compared to the RTX 3080 in all aspects.
More From RX 7800 XT:
More From RTX 3080:
Thank you! Please share your positive feedback. 🔋
How could we improve this post? Please Help us. 😔
[Comparisons Expert]
Abdemanaf is a skilled creative writer who has been honing his craft since 2011. While initially working in different fields, he found a passion for technology and has been exploring the tech world since early 2015. Over the years, he has developed an in-depth knowledge of the latest tech trends and product offerings by various companies.
Abdemanaf’s writing reflects his analytical mindset and ability to think critically. He has a knack for breaking down complex technical information into easily digestible pieces, making his articles engaging and accessible to readers from all backgrounds. In February 2022, he joined Tech4Gamers as a blog and product comparison writer, where he has been able to hone his skills further.
As a writer, Abdemanaf is dedicated to staying up-to-date with the latest technological advancements and trends, enabling him to provide readers with the most relevant and accurate information. He is always eager to learn more and is constantly seeking new challenges to improve his skills.
Get In Touch: manaf@tech4gamers.com


