


AMD Radeon RX 7800 XT
Rated: 8.8/10
AMD Radeon RX 6800
Rated: 8.5/10
Pros & Cons
| GPU | Pros | Cons |
|---|---|---|
| RX 7800 XT | ✅ Affordable price. ✅ Multiple display outputs. | ❌ Slightly lower clock frequencies. ❌ Smaller VRAM. |
| RX 6800 | ✅ High clock speeds. ✅ Decent shading units. | ❌ High power consumption. ❌ High price. |
- The RX 7800 XT establishes a decisive lead by having a stunning 15.9% increase in average frame rates over the RX 6800.
- In my observation, the RX 7800 XT stands out as a model of power efficiency, outperforming the RX 6800 by a startling 7.47% when put under power load.
- The RX 7800 XT showcases max temperatures and GPU hotspot temperatures averaging almost 1.46% lower and around 3.82% lower than the RX 6800, respectively.
Comparison Table
| Specs | RX 7800 XT | RX 6800 |
|---|---|---|
| Memory Bandwidth | 620.8 GB/s | 512.0 GB/s |
| RT Cores | 60 | 60 |
| Cores | 3840 | 3840 |
| Release Date | Aug 25th, 2023 | Oct 28th, 2020 |
| Best CPU | Best CPU For RX 7800 XT | – |
| Best Variants | Best RX 7800 XT Graphics Cards | – |
Architectural Differences
- Process Size: The RDNA 3.0-based RX 7800 XT and the RDNA 2.0-based RX 6800 both use manufacturing processes 5nm and 7nm, respectively.
- Clock Speed: The RX 6800 comes with a commanding base clock of 1700 MHz and a skyrocketing boost clock of 2105 MHz. Whereas, the RX 7800 XT, arrives with a base frequency of 1295 MHz and a boost clock that is effective at 2430 MHz.
- VRAM & Bus Width: Both the RX 6800 and RX 7800 XT share a substantial 256-bit memory bus width and also share a 16GB GDDR6 memory capacity.
- TDP: The RX 7800 XT has a slightly higher TDP of 263W. Whereas, the RX 6800, showcases its commitment to power efficiency by having a TDP of 250W.
The RX 7800 XT vs RX 6800 are exceptional cards from the house of AMD. Despite having an almost three-year gap between their productions, these cards share a lot of similarities. Let’s see what they are as I present you with this ultimate comparison.
RX 7800 XT Vs RX 6800: Benchmark At 1440p
Since the technical details are out of the way, let me guide you to the benchmark test of both GPUs on 1440p, which highlights their performance difference concerning their average FPS.
Testing Rig
- CPU: Ryzen 7 7800X3D
- Memory: Corsair Vengeance RGB DDR5 – 6000MHz
- Storage Drive: XPG Gammix S70 Blade 2TB NVMe
- Power Supply: be quiet! Dark Power Pro 13 1300W
- CPU Cooler: Corsair ICUE H150I Elite
Disclaimer: The values obtained from this benchmark may contain a slight margin for error due to the influence of a few external factors, such as airflow, temperatures, and recording software. Therefore, we advise you to take the results as mere estimations.
A Plague Tale: Requiem
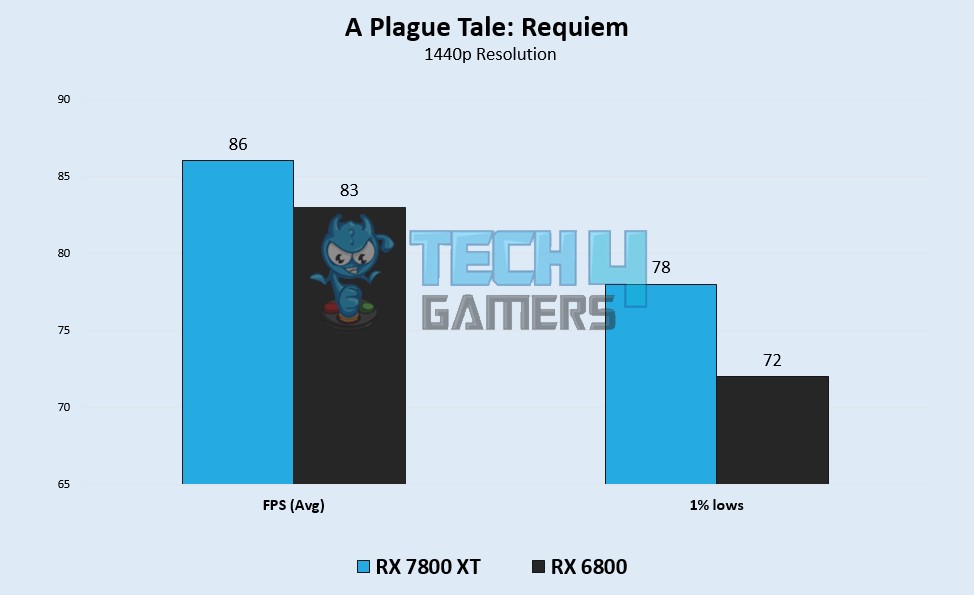
- On my first game, the RX 7800 XT averaged 86 FPS. This accomplishment greatly outperforms the RX 6800’s more constrained performance, which manages only 83 FPS.
- The RX 6800 displayed a 1% low of 72 FPS. Whereas, the RX 7800 XT provides a little more consistent performance in this area, by obtaining a 1% low of 78 FPS.
Resident Evil 4
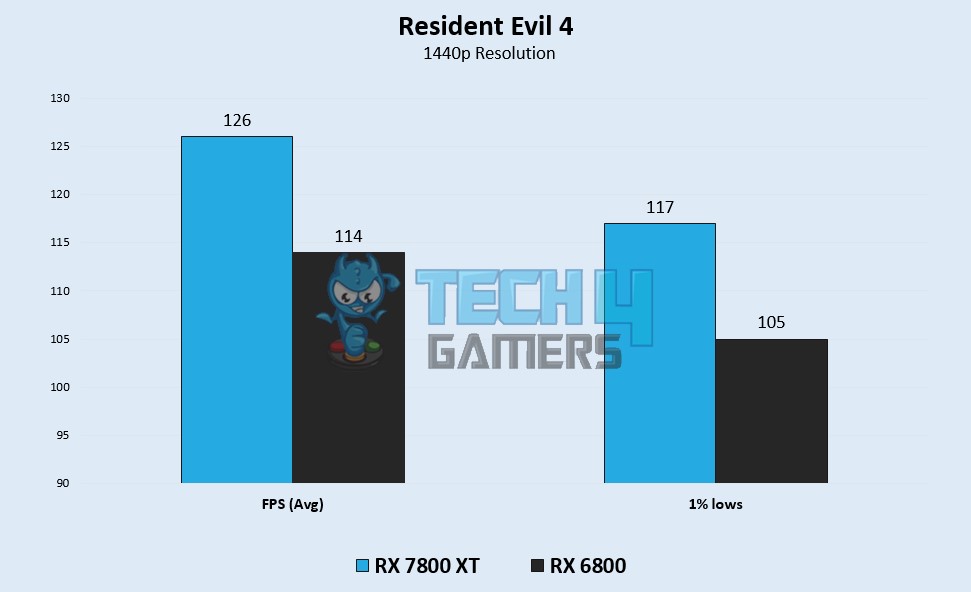
- Here, I noticed the RX 7800 XT achieved a remarkable average of 126 FPS. On the flip side, the RX 6800 performs with an average of 114 FPS.
- The RX 7800 XT displayed a 1% low frame rate of 117 FPS as opposed to the RX 6800, which achieved a 1% low of 105 FPS, showcasing a difference of about 20 FPS.
Cyberpunk 2077
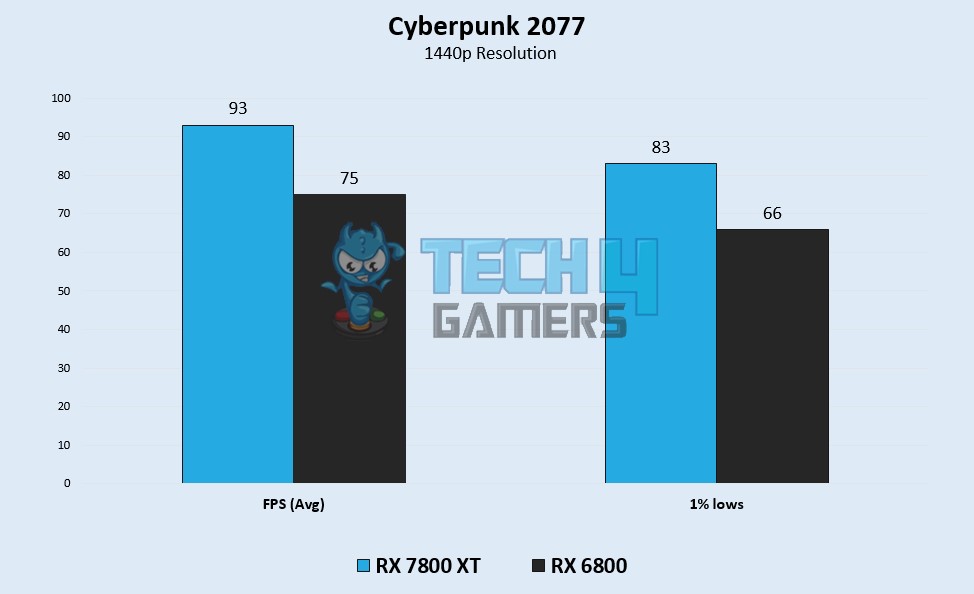
- In Cyberpunk 2077, the RX 7800 XT establishes its superiority by obtaining a stellar average of 93 FPS, it surpasses the RX 6800, which trails at a mere 75 FPS.
- The RX 7800 XT shines in the area of 1% lows, obtaining 83 FPS. The RX 6800, in comparison, traids lightly behind its contender, by having a 1% low of 66 FPS.
Hogwarts Legacy
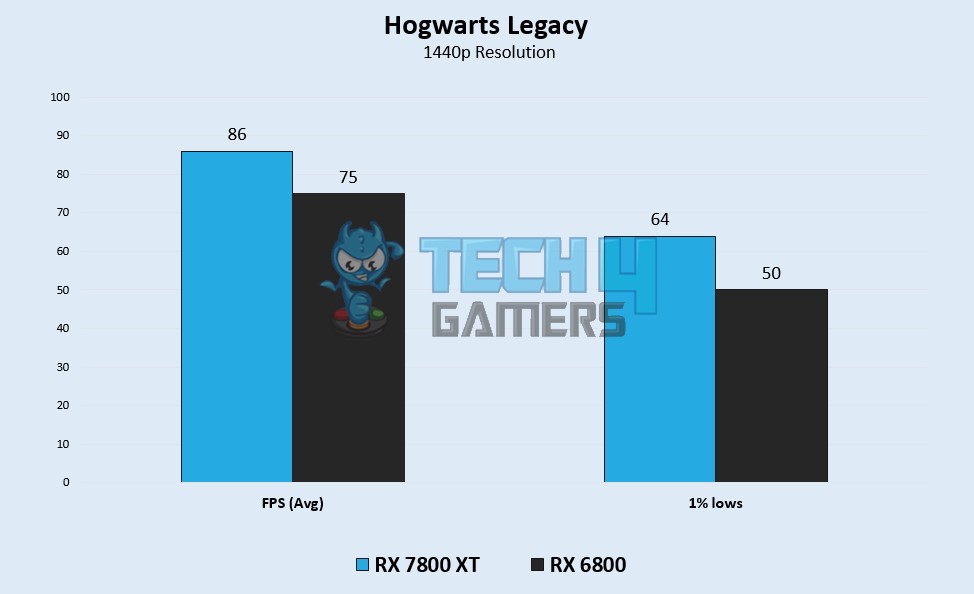
- After my thorough inspection, the RX 7800 XT shows a clear advantage over the RX 6800 as it reached 86 FPS over the RX 6800’s 75 FPS.
- In terms of the 1% lows, RX 7800 XT’s outstanding endurance shows through its 64 FPS. In contrast, the RX 6800 pushes its limit by providing a 1% low of 50 FPS.
The Last Of Us Part 1
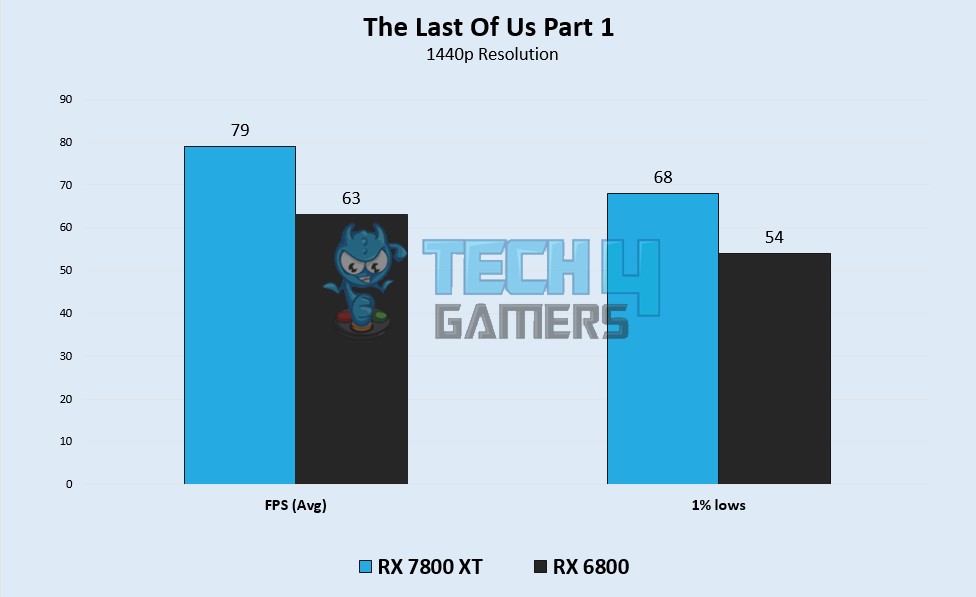
- With an outstanding average frame rate of 79 FPS, the RX 7800 XT overshadows the comparably inadequate performance of the RX 6800, which manages 63 FPS.
- I also observed that the RX 7800 XT also stands effectively with a 1% low of 68 FPS. The RX 6800 exhibits a little lower FPS in this area, with a 1% low of 54 FPS.
Marvel’s Spider-Man Remastered
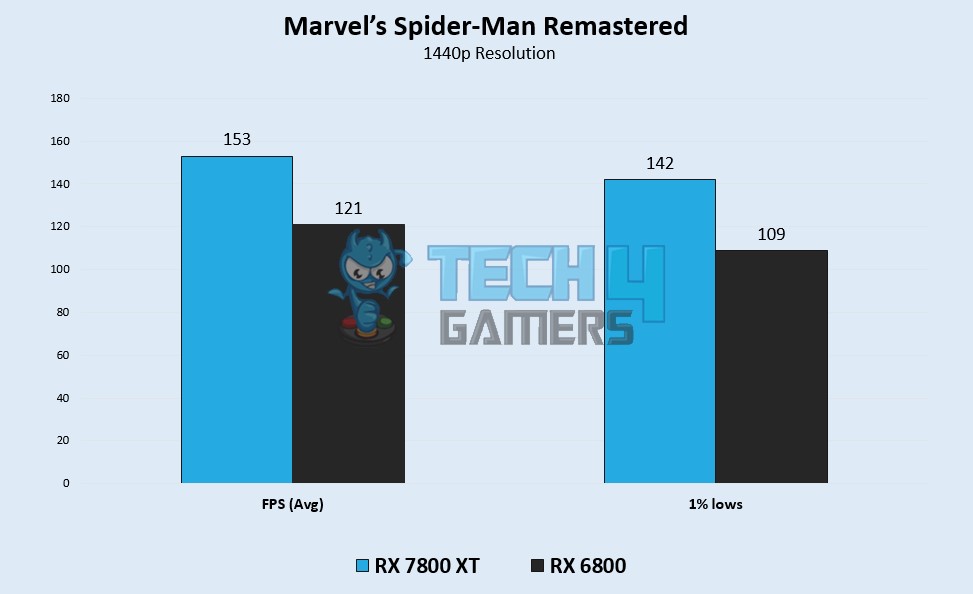
- Here, the RX 6800 solidifies its superiority over its rival by obtaining 153 FPS over the RX 7800 XT’s mere 121 FPS.
- I expected the same amount of margin when it comes to the 1% lows as well. Here, the RX 7800 XT shows a 1% low of 142 FPS over the RX 6800’s 109 FPS.
Overall Gaming Performance
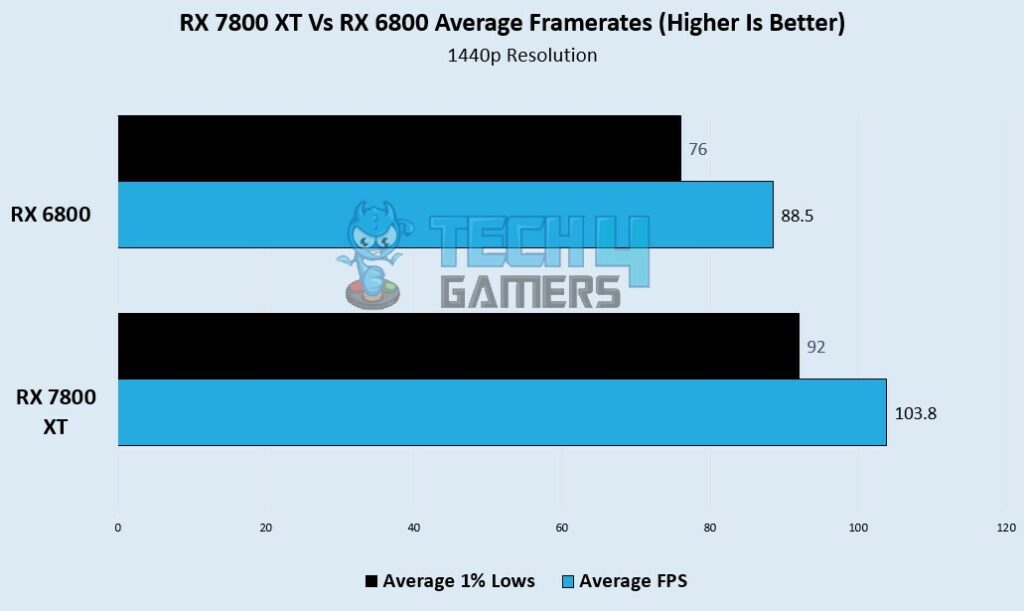
With an outstanding average FPS of 103.8, the RX 7800 XT confirms its superiority in this field. This statistic represents a significant 15.9% gain over the RX 6800, which averages 88.5 FPS.
Thermal Efficiency
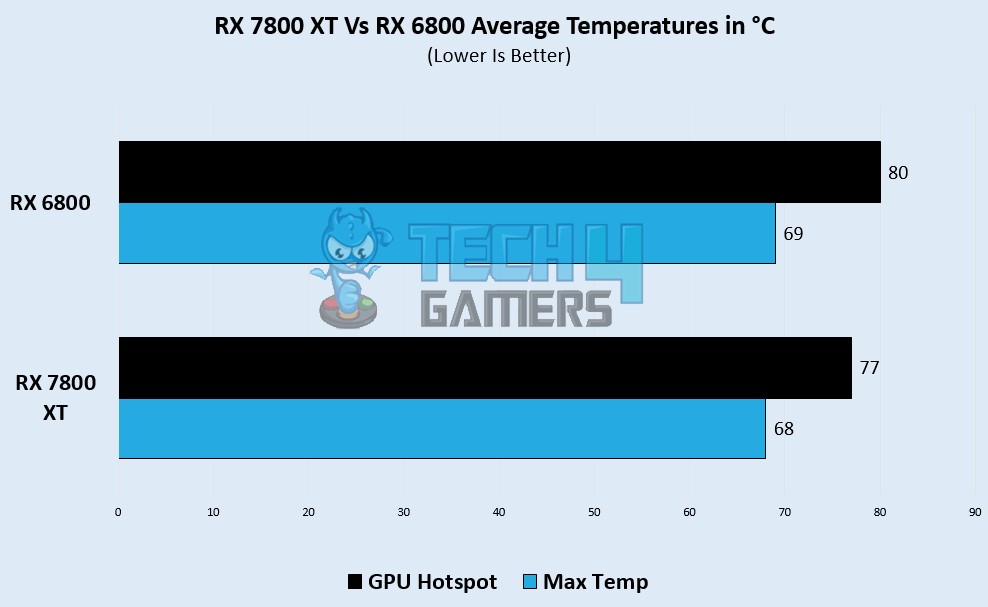
In my observation, both cards display almost the same average peak temperature of 68°C to 69°C. In terms of the maximum GPU hotspot temperature, the RX 7800 XT maintains a lower temperature of 77°C over the RX 6800’sslightly higher temperature of 80°C.
Power Consumption
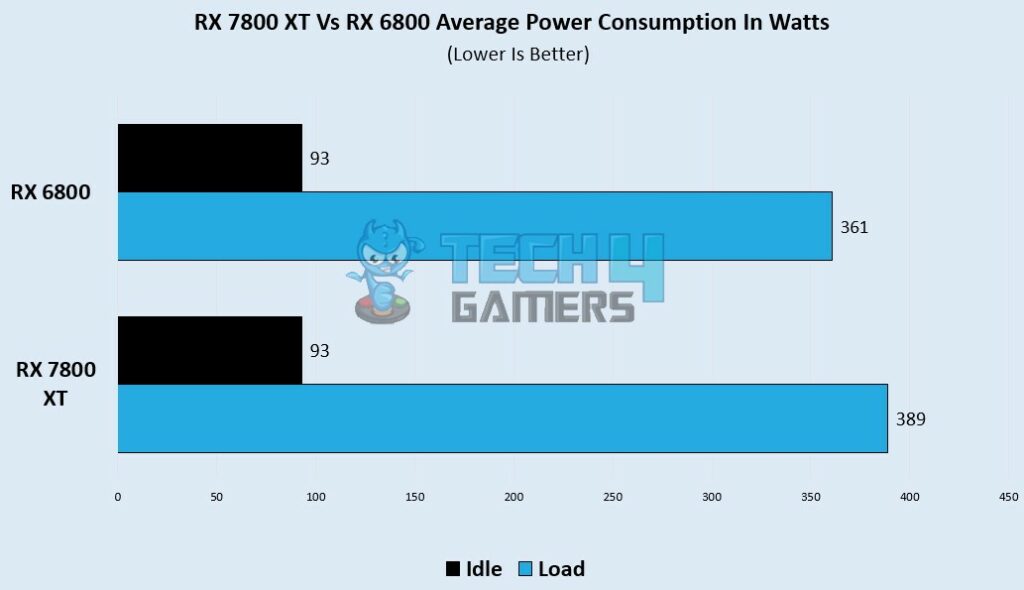
I noticed that under load, the RX 6800 utilizes 361W of power whereas the RX 7800 XT consumes 389W of power. When idle, both GPUs exhibit the same power consumption, using only 93W.
Pricing And Availability
The RX 6800 is currently being sold at a range of $400 to $700 and has different models with varying specifications, while the RX 7800 XT can be found at a price range of $510 to $580. Both the cards are readily available on online retailers.
RX 6800 Vs RX 7800 XT: Which One Do I Recommend?
To sum up, the RX 7800 XT displayed incredible performance with a 15.9% edge in terms of average FPS. Not only that, it is also more thermally efficient than the RX 6800. I recommend you get your hands on the RX 7800 XT also because of its better price point than the RX 6800 which has expensive variants.
Frequently Asked Questions
Ray tracing is supported by the RX 6800 and RX 7800 XT owing to their DirectX 12 Ultimate compatibility. In supported games, this makes lighting and reflections more realistic.
There are some distinctions, indeed. One HDMI 2.1 port, two display port 1.4a connections, and one USB Type-C port are all available on the RX 6800. The RX 7800 XT, in comparison, has three display port 2.1 connectors and one HDMI 2.1a port.
Yes, both GPUs can support 4K gaming, although real performance may differ depending on the game and settings. In demanding 4K applications, the RX 7800 XT’s newer process could provide a tiny advantage.
More From RX 7800 XT
More From RX 6800
Thank you! Please share your positive feedback. 🔋
How could we improve this post? Please Help us. 😔
[Comparisons Expert]
Abdemanaf is a skilled creative writer who has been honing his craft since 2011. While initially working in different fields, he found a passion for technology and has been exploring the tech world since early 2015. Over the years, he has developed an in-depth knowledge of the latest tech trends and product offerings by various companies.
Abdemanaf’s writing reflects his analytical mindset and ability to think critically. He has a knack for breaking down complex technical information into easily digestible pieces, making his articles engaging and accessible to readers from all backgrounds. In February 2022, he joined Tech4Gamers as a blog and product comparison writer, where he has been able to hone his skills further.
As a writer, Abdemanaf is dedicated to staying up-to-date with the latest technological advancements and trends, enabling him to provide readers with the most relevant and accurate information. He is always eager to learn more and is constantly seeking new challenges to improve his skills.
Get In Touch: manaf@tech4gamers.com


