AMD Radeon RX 6800
Rated: 7.5/10
Nvidia GeForce RTX 4060
Rated: 6.5/10
Pros And Cons
| GPU | Pros | Cons |
|---|---|---|
| GeForce RTX 4060 | ✅Lower TDP ✅Lower price | ❌Significantly lower performance |
| Radeon RX 6800 | ✅Significantly higher performance ✅More VRAM ✅Larger VRAM bandwidth | ❌Higher Price ❌Significantly higher power consumption |
- The RX 6800 leads in gaming performance with a significant 37.9% advantage in average FPS over the RTX 4060. The considerable difference highlights RX 6800’s ability to provide smoother, more immersive gaming experiences.
- The RTX 4060 outshines with a remarkable 69.3% reduction in average power consumption compared to the RX 6800, promoting cost savings and environmental sustainability.
- The price of the RTX 4060 significantly undercuts that of the RX 6800. This affordability aspect positions the RTX 4060 as an attractive option for budget-conscious consumers.
- If you have the budget for the RX 6800, we highly recommend getting it as it gives you performance best suited for 1440p, whereas the RTX 4060 serves as a budget 1080p card.
Comparison Table
| Specification | Radeon RX 6800 | GeForce RTX 4060 |
|---|---|---|
| GPU Name | Navi 21 | AD107 |
| Shaders | 3840 | 3072 |
| Compute Units | 60 | - |
| ROPs | 96 | 48 |
| RT Cores | 60 | 24 |
| TMUs | 240 | 96 |
| Memory Type | GDDR6 | GDDR6 |
| Memory Bandwidth | 512.0 GB/s | 272.0 GB/s |
| Memory Size | 16GB | 8GB |
| Best Variants | - | Best RTX 4060 |
Architectural Differences
- Process Node: Pushing the boundaries of GPU manufacturing, the RTX 4060 leads the pack with its cutting-edge 5nm process, leaving the RX 6800 behind with its older 7nm process technology.
- Clock Speed: Showcasing its speed prowess, the RX 6800 boasts a base clock of 1700 MHz and a boost clock of 2105 MHz, while the RTX 4060 holds its ground with a base clock of 1830 MHz and a boost clock of 2535 MHz.
- VRAM: Bolstering its memory capacity, the RX 6800 shines with a generous 16GB of GDDR6 VRAM, outmatching the RTX 4060’s 8GB GDDR6 VRAM.
- TDP: Delving into thermal power, the RTX 4060 flaunts its efficiency with a lower TDP of 200W, while the RX 6800 demands a higher power consumption with its 250W TDP.
- Supported Technologies: Unleashing advanced graphics enhancements, the RTX 4060 leverages DLSS (Deep Learning Super Sampling), while the RX 6800 incorporates FSR (FidelityFX Super Resolution) to enhance visual fidelity.
RTX 4060 Vs RX 6800: Gaming Benchmarks
I am now stepping into the gaming battlefield and witnessing the clash between the RTX 4060 and the RX 6800. We will push these formidable GPUs’ limits, meticulously analyzing performance benchmarks to unveil their untapped potential. Prepare to be captivated by the thrilling showdown as we delve deep into the gaming capabilities of these gaming powerhouses.
Testing Rig
- CPU: Intel Core i9 13900K
- Motherboard: Asus ROG Strix Z790 – E Gaming
- CPU Cooler: Corsair ICUE H150I ELITE
- Memory: Corsair Dominator Platinum RGB 32GB DDR5 6000MHz
- Power Supply: ENERMAX REVOLUTION D.F. X 1050W
- Storage Drive: XPG GAMMIX S70 BLADE 2TB NVMe
- Operating System: Windows 11
God Of War
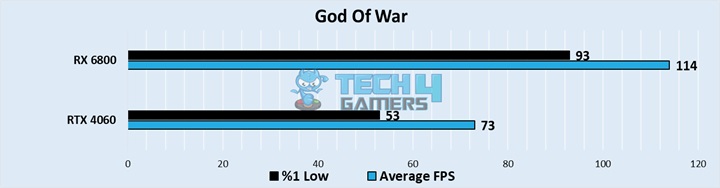
- In our tests, the RX 6800 emerges as the clear frontrunner, boasting an impressive 43.8% lead in average FPS performance over the RTX 4060. It achieves a commendable 114 FPS compared to the RTX 4060’s 73 FPS.
- However, when it comes to 1% low performance, the RTX 4060 falls significantly behind, with a substantial 54.7% lower performance. While the RX 6800 maintains a solid 93 FPS, the RTX 4060 only managed to get 53 FPS.
Horizon Zero Dawn
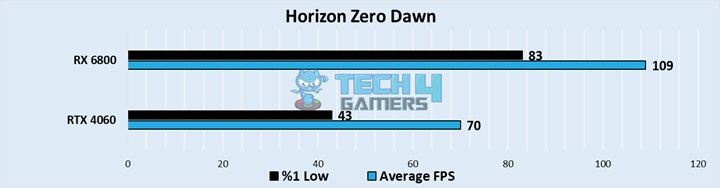
- In our tests, the RX 6800 once again establishes its superiority in gaming performance, boasting a significant 43.5% lead in average FPS over the RTX 4060. It achieves an impressive 109 FPS compared to the RTX 4060’s 70 FPS.
- The RTX 4060 shows a notable shortfall in 1% low performance, with a 63.4% lower framerate at 43 FPS compared to the RX 6800’s commendable 83 FPS.
Far Cry 6
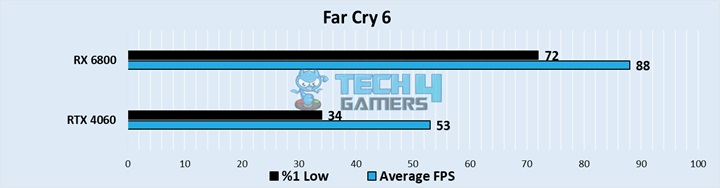
- While testing Far Cry 6, the RX 6800 once again asserts its dominance, showcasing a significant 49.6% advantage in average FPS performance over the RTX 4060. It achieves 88 FPS compared to the RTX 4060’s 53 FPS.
- The RTX 4060 falls significantly behind in 1% low performance, with a substantial 71.6% lower performance at 34 FPS, while the RX 6800 maintains superior stability at 72 FPS.
Hitman 3
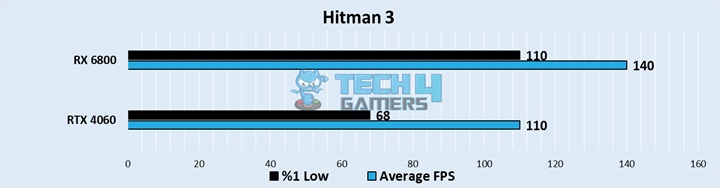
- While we were testing, in the battle for average FPS, the RTX 4060 fell behind with a 24% disadvantage compared to the RX 6800, achieving 110 FPS against the RX 6800’s 140 FPS.
- The RTX 4060 experiences a notable 47.1% lower 1% low performance at 68 FPS, while the RX 6800 demonstrates higher performance at 110 FPS.
Call Of Duty Modern Warfare II
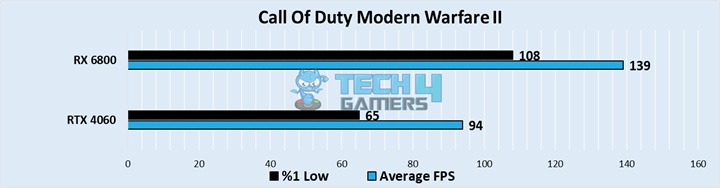
- While we were testing, the RX 6800 solidified its gaming superiority by delivering an impressive 38.6% lead in average FPS performance over the RTX 4060, achieving 139 FPS compared to the RTX 4060’s 94 FPS.
- A significant performance gap is observed as the RTX 4060 falls behind with a notable 49.7% lower 1% low performance, reaching 65 FPS, while the RX 6800 maintains a solid 108 FPS.
Cyberpunk 2077
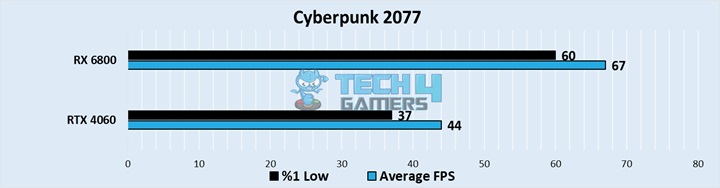
- In the realm of average FPS, the RX 6800 asserts its dominance with a commanding 41.4% advantage over the RTX 4060, achieving 67 FPS compared to the RTX 4060’s 44 FPS.
- As for 1% lows, the RTX 4060 showcases a 47.4% lower performance at 37 FPS, while the RX 6800 exhibits higher performance at 60 FPS.
Assassin’s Creed Valhalla
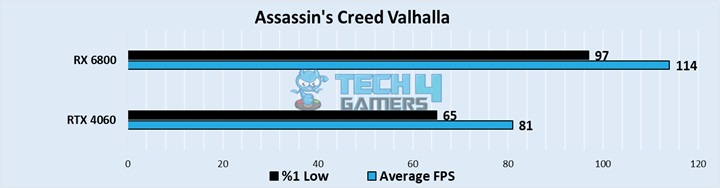
- In our tests, as the dust settles, the RX 6800 secures its position as the frontrunner with a notable 33.8% lead in average FPS performance over the RTX 4060, achieving 114 FPS compared to the RTX 4060’s 81 FPS.
- As for 1% lows, a noticeable difference arises as the RTX 4060 experiences a 39.5% lower performance at 65 FPS, while the RX 6800 maintains a more stable performance at 97 FPS.
Overall Gaming Performance
| Featured | RTX 4060 | RX 6800 XT |
|---|---|---|
| Average FPS | 75 📈 | 110 📈 |
| %1 lows | 52 📉 | 89 📉 |
| Winner: AMD's Radeon RX 6800 | ||
The RX 6800 maintains a substantial lead in average FPS, boasting a 46% improvement. This performance difference is immediately noticeable, positioning the RX 6800 as the superior choice for gamers seeking top-tier performance. The RX 6800’s 71.2% advantage in 1% lows emphasizes its superior stability.
Power Consumption
| Game | RTX 4060 (W) | RX 6800 (W) |
|---|---|---|
| God Of War | 114 | 221 |
| Horizon Zero Dawn | 117 | 242 |
| Far Cry 6 | 104 | 226 |
| Hitman 3 | 104 | 210 |
| Call Of Duty MW2 | 105 | 236 |
| Cyberpunk 2077 | 119 | 241 |
| Assassin's Creed Valhalla | 116 | 233 |
| Average Power Consumption | 111 | 230 |
| Winner: Nvidia's RTX 4060 | ||
The RTX 4060 performs less than the RX 6800 but boasts significantly lower power consumption. In contrast, the RTX 4060’s lower power consumption saves energy costs and ensures quieter operation and potentially longer lifespan.
Pricing And Availability
| GPU | MSRP | Current Price (Used) |
|---|---|---|
| RTX 4060 | 💲299 | 💲285 |
| RX 6800 | 💲949 | 💲400 |
| Price Difference | 217.39% | 40.35% |
In terms of pricing and availability, the RTX 4060 offers better performance at a lower cost compared to the RX 6800. However, the RX 6800 may be more readily available second-hand, providing a budget-friendly option. Initial availability may be limited for the RTX 4060 due to high demand, while the RX 6800 is more widely accessible.
RX 6800 Vs RTX 4060: Which One To Choose?
GeForce RTX 4060: The RTX 4060 presents a 46.4% cost advantage over the RX 6800 but lags behind by 37.9% in average FPS. It boasts a significant 69.3% reduction in power consumption, making it budget-friendly, but its performance at higher resolutions is lacking.
Radeon RX 6800: The RX 6800 demonstrated exceptional performance in our tests, handling games at 1440p with ease at high settings. It’s our top recommendation. The RTX 4060, once ahead in frame generation, is now overshadowed by AMD’s Fluid Motion Frame (FMF) technology, making it obsolete.
To conclude, the RTX 4060 could be the preferred choice for users prioritizing cost-effectiveness and power efficiency. However, the RX 6800 remains the recommended option for those seeking top-tier performance.
More From RTX 4060
More From RX 6800
Thank you! Please share your positive feedback. 🔋
How could we improve this post? Please Help us. 😔
[Comparisons Specialist]
I’m a passionate computer hardware expert specializing in CPUs and GPUs. With a lifelong curiosity for hardware and extensive hands-on experience, I provide valuable insights, practical advice, and in-depth analysis on these components. Engaging with the hardware community, I exchange knowledge and stay at the forefront of technological advancements.
Get In Touch: uzair@tech4gamers.com