


Nvidia GeForce RTX 4060 Ti
Rated: 8.5/10
AMD Radeon RX 6800
Rated: 8.8/10
Pros & Cons
| GPU | Pros | Cons |
|---|---|---|
| Nvidia GeForce RTX 4060 Ti | ✅ Efficient and optimal for 1080p ✅ Sleek and compact design | ❌ No DisplayPort 2.0 support ❌ Lags at higher resolutions |
| AMD Radeon RX 6800 | ✅ Great 1440p gmaing performance ✅ Ample 16GB memory | ❌ Room for quieter operation ❌ Lags in ray tracing performance |
- In our performance tests at 1080p, the RX 6800 proved its gaming strength with a remarkable 19.7% boost in average FPS over the RTX 4060 Ti.
- The RTX 4060 Ti stands out for its power efficiency, consuming 20.7% less power than the RX 6800, while both GPUs have almost the same thermal efficiency.
- As of March 2024, the cost of the RTX 4060 Ti is around $439 for the 16GB variant and $399 for 8GB, whereas the RX 6800 is priced at $399.
- I recommend the RX 6800 for its better gaming performance and the RTX 4060 Ti for its high power efficiency and 16GB VRAM.
Comparison Table
| Feature | GeForce RTX 4060 Ti | Radeon RX 6800 |
|---|---|---|
| GPU Name | AD106 | Navi 21 |
| Architecture | Ada Lovelace | RDNA 2.0 |
| Shading Units | 4352 CUDA Cores | 3840 Stream Processors |
| RT Cores | 34 | 60 |
| Bus Width | 128 bit | 256 bit |
| Memory Bandwidth | 288.0 GB/s | 512.0 GB/s |
| TDP | 165W | 250W |
| Best Variants | Best RTX 4060 Ti | - |
Architectural Differences
- Process Node: Setting them apart, the RTX 4060 Ti leverages a cutting-edge 5nm process node, while the RX 6800 relies on a slightly larger 7nm process node.
- Clock Speed: The RTX 4060 Ti features a base clock of 2310 MHz and a boost clock of 2535 MHz, compared to the RX 6800’s a base clock of 1700 MHz and a boost clock of 2105 MHz.
- VRAM: Additionally, when it comes to VRAM, the RTX 4060 Ti offers a generous 16GB GDDR6 VRAM, mirroring the RX 6800’s prowess with the same 16GB GDDR6 VRAM.
- TDP: Furthermore, on the power efficiency front, the RTX 4060 Ti boasts a 165W TDP, while against the RX 6800’s slightly higher power draw with its 250W TDP.
- Supported Technologies: The RTX 4060 Ti excels with Nvidia’s DLSS technology, while the RX 6800 thrives on AMD’s FSR, highlighting unique innovation paths.
The RTX 4060 Ti is a cheap 16GB GPU with the latest Ada Lovelace architecture from Nvidia, while the RX 6800 is a mid-tier AMD GPU from the RX 6000 series having the old RDNA 2.0 architecture. In RTX 4060 Ti vs RX 6800, we will analyze their specs and architectural differences and test their gaming performance.
Gaming Benchmarks
To compare the RTX 4060 Ti and RX 6800, we tested them in real-world gaming scenarios using a well-planned benchmark system that minimizes performance bottlenecks. Check out the specifications of our testing setup below.
Testing Rig
- CPU: Intel Core i5-13600K
- Motherboard: MSI Z790 Tomahawk Max WiFi Motherboard
- Memory: Kingston Fury Renegade RGB DDR5 32GB 7200MHz
- Power Supply: ENERMAX REVOLUTION D.F. X 1050W
- CPU Cooler: CORSAIR A115 CPU Air Cooler
- Storage Drive: Sabrent Rocket 4 Plus G 2TB NVMe SSD
The Last Of Us Part 1
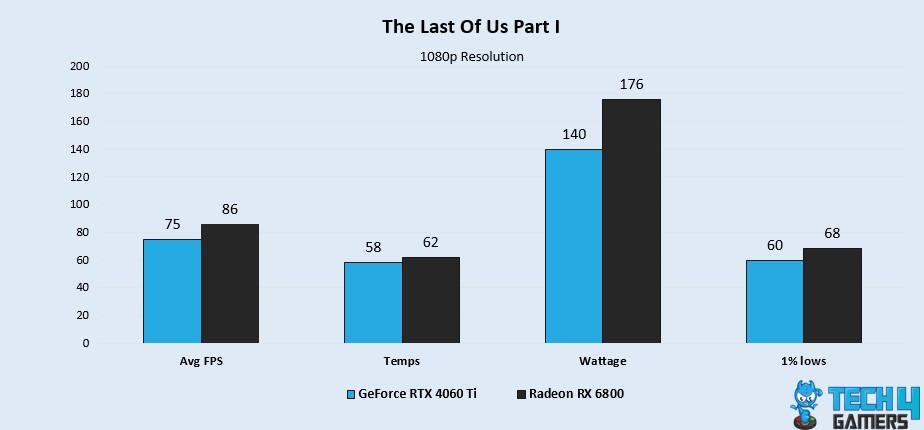
- During The Last Of Us Part I session, we observed that the RX 6800 commands a staggering 86 FPS, outshining the RTX 4060 Ti’s performance of 75 FPS by a remarkable 13.6% margin.
- The RX 6800 emerges triumphant, displaying an impressive 1% low performance of 68 FPS compared to the RTX 4060 Ti’s 60 FPS, indicating in a substantial 12.5% difference.
Diablo 4
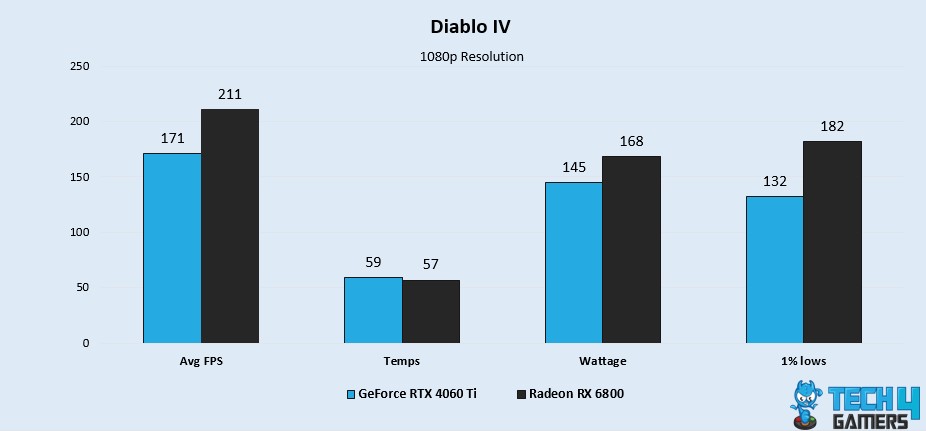
- Boasting remarkable gaming capabilities, the RX 6800 achieves an average FPS of 211, surpassing the RTX 4060 Ti’s 171 FPS, marking a notable 20.9% difference.
- The RX 6800 showcases its superiority by delivering an outstanding 1% low performance of 182 FPS, outshining the RTX 4060 Ti’s 132 FPS by a remarkable 31.8% margin.
Hogwarts Legacy
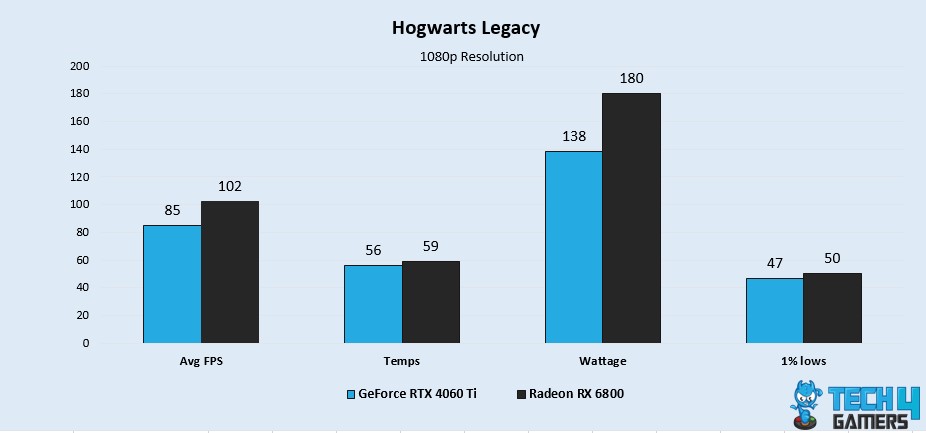
- In our Hogwarts Legacy session, the RX 6800 reached an impressive 102 FPS average, surpassing the RTX 4060 Ti’s performance of 85 FPS by a noteworthy 18.1%.
- Analyzing the 1% low performance, the RX 6800 stands out with a performance of 50 FPS, while the RTX 4060 Ti follows with 47 FPS, showcasing a modest 6.1% variance.
Star Wars: Jedi Survivor
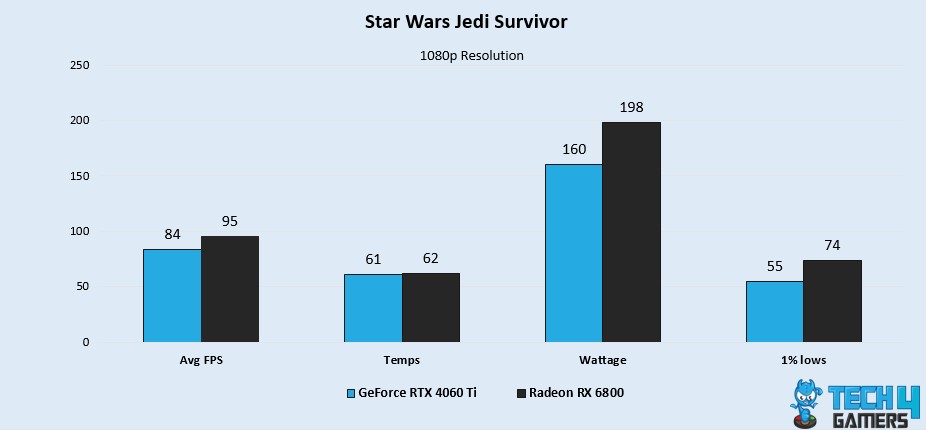
- In Star Wars: Jedi Survivor, the RX 6800 shines with a performance of 95 FPS, while the RTX 4060 Ti trails slightly behind at 84 FPS, showcasing a 12.2% variance.
- The RX 6800 establishes its lead in 1% low performance with a remarkable 74 FPS, surpassing the RTX 4060 Ti’s performance of 55 FPS by a substantial 29.4% difference.
Resident Evil 4 Remake
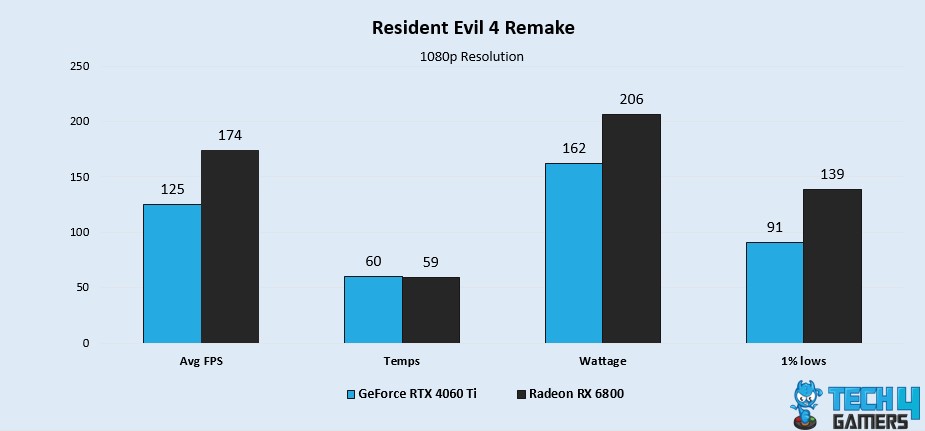
- During Resident Evil 4, we saw that the RX 6800 achieved an average of 174 FPS, marking a substantial 32.7% difference from the RTX 4060 Ti’s performance of 125 FPS.
- Turning to 1% low performance, the RX 6800 takes the lead with an impressive 139 FPS, overshadowing the RTX 4060 Ti’s 91 FPS by a remarkable 41.7% gap.
God Of War
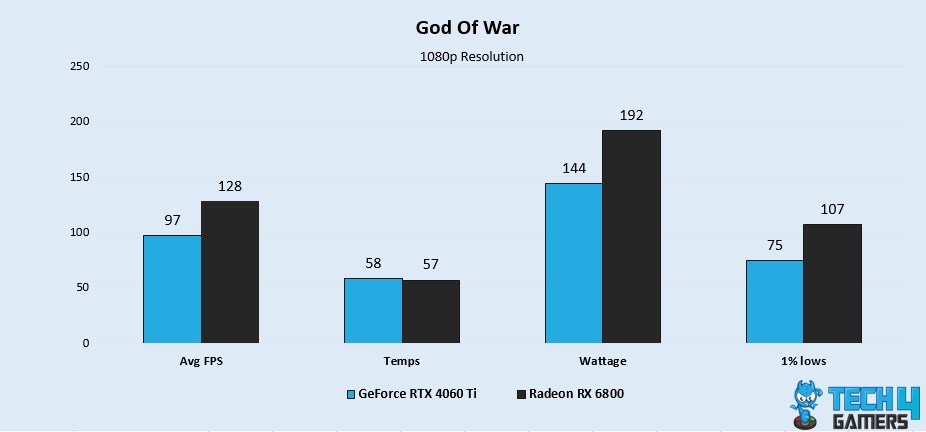
- The RX 6800 demonstrates its superiority with a performance of 128 FPS, surpassing the RTX 4060 Ti by 27.5% at 97 FPS.
- In the realm of 1% low performance, the RX 6800 solidifies its dominance with a performance of 107 FPS, outperforming the RTX 4060 Ti’s 75 FPS by a notable 35.1%.
Battlefield 2042
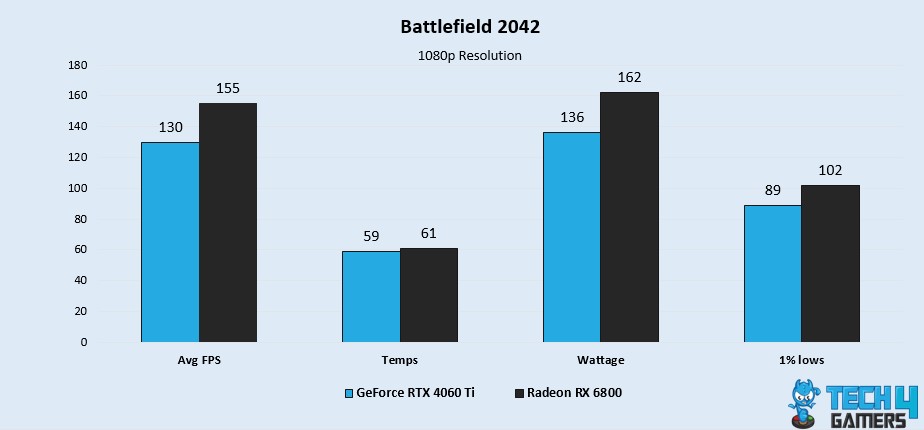
- During our Battlefield 2042 session, the RX 6800 takes the lead with a performance of 155 FPS, surpassing the RTX 4060 Ti’s 130 FPS by a significant 17.5% margin.
- The RX 6800 maintains its edge in 1% low performance, achieving a performance of 102 FPS, while the RTX 4060 Ti trails with 89 FPS, marking a 13.6% difference.
Call Of Duty: Modern Warfare 2
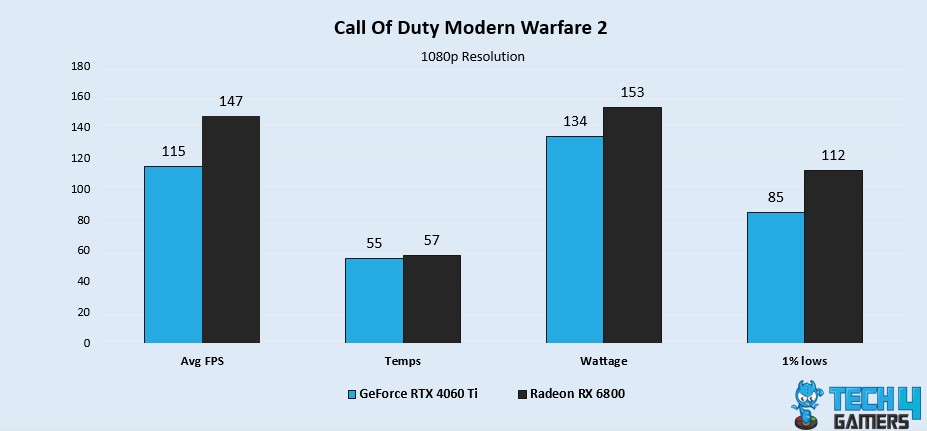
- While playing COD: Modern Warfare 2, the RX 6800 impresses with a performance of 147 FPS, outshining the RTX 4060 Ti’s 115 FPS by a remarkable 24.4% difference.
- Examining 1% low performance, the RX 6800 takes the lead with a performance of 112 FPS, surpassing the RTX 4060 Ti’s 85 FPS by a significant 27.4% margin.
Red Dead Redemption 2
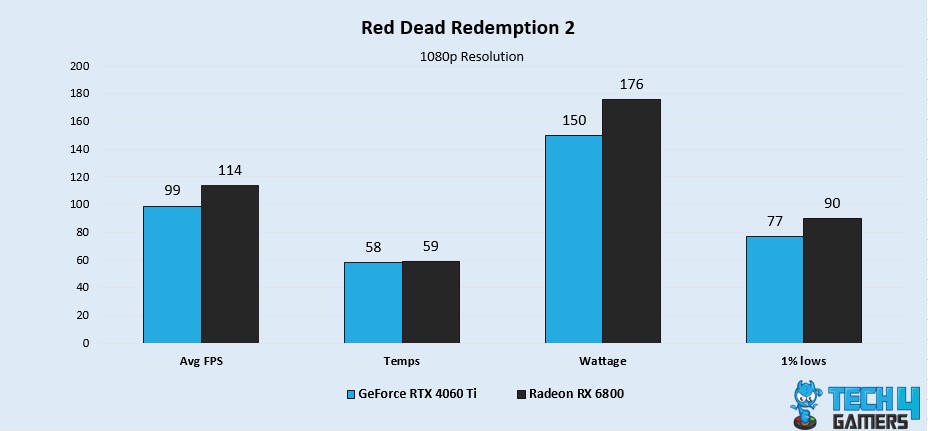
- In our RDR 2 gameplay, the RX 6800 showcased its capabilities by achieving 114 FPS, surpassing the RTX 4060 Ti’s performance of 99 FPS by a notable 14% margin.
- The RX 6800 excels in 1% low performance with a performance of 90 FPS, outperforming the RTX 4060 Ti’s 77 FPS by a notable 15.5% variance.
A Plague Tale: Requiem
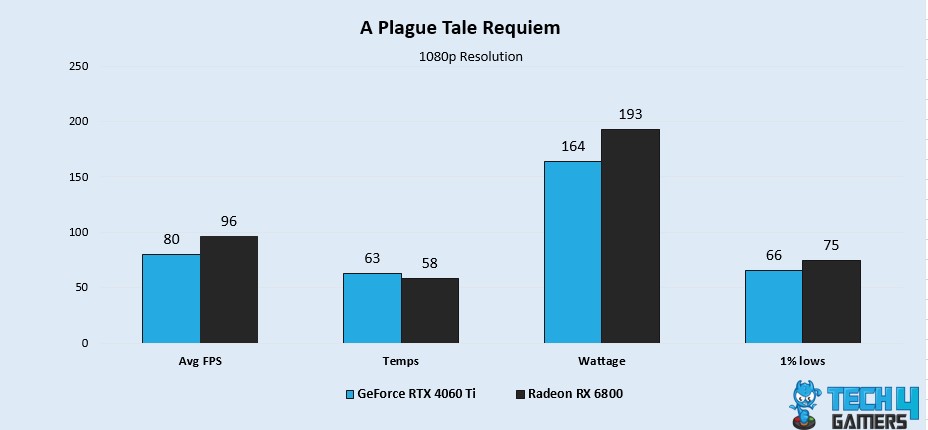
- The RX 6800 underscores its gaming prowess with an average FPS of 96, outperforming the RTX 4060 Ti’s performance of 80 FPS by a noteworthy 18.1%.
- The RX 6800 continues to underscore its 1% low performance, achieving 75 FPS, while the RTX 4060 Ti achieves 66 FPS, showcasing a 12.7% difference.
The Witcher 3 Next Gen Update
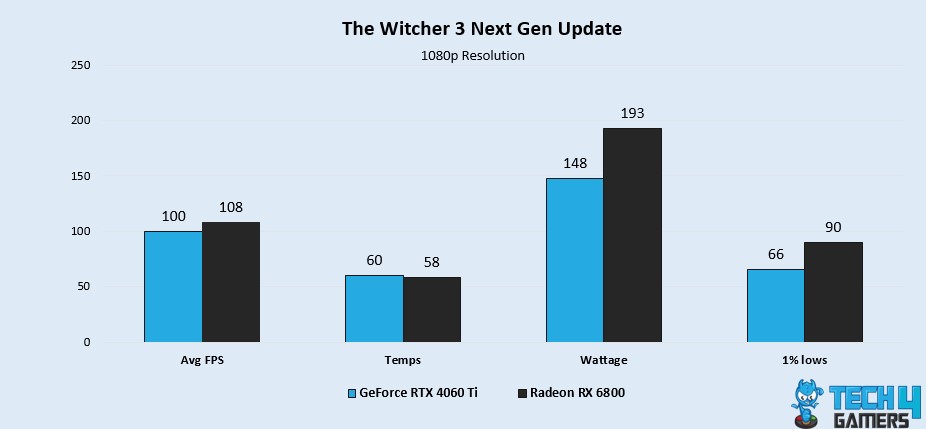
- During The Witcher 3, we noticed that the RX 6800 stands out with a performance of 108 FPS, while the RTX 4060 Ti achieves 100 FPS, showcasing a 7.6% difference.
- The RX 6800 maintains its advantage in 1% low performance, registering a performance of 90 FPS, while the RTX 4060 Ti trails with 66 FPS, showcasing a significant 30.7% difference.
Overall Gaming Performance
| Stat | AMD Radeon RX 6800 | GeForce RTX 4060 Ti |
|---|---|---|
| Average FPS | 128.7 📈 | 105.5 📈 |
| Low 1% FPS | 109.3 📉 | 89.6 📉 |
| Winner: AMD Radeon RX 6800 | ||
In our gaming benchmarks, the RX 6800 outperforms the RTX 4060 Ti by a significant 19.7% lead in average FPS, setting a remarkable standard. Comparing the low 1% performance, the RX 6800 was again leading the competition by delivering about 22.0% greater performance.
Power Consumption
| Stats | GeForce RTX 4060 Ti | AMD Radeon RX 6800 |
|---|---|---|
| Average Power Draw (W) | 147.3 ⚡ | 181.5 ⚡ |
| Winner: Nvidia GeForce RTX 4060 Ti | ||
In our power usage tests, the RTX 4060 Ti stood out by being 23.2% more power-efficient than the RX 6800. This highlights its ability to use less energy, which helps conserve resources.. The RTX 4060 Ti is also more efficient in terms of performance for each unit of power it consumes.
Gaming Temperature
| Stats | GeForce RTX 4060 Ti | AMD Radeon RX 6800 |
|---|---|---|
| Average Gaming Temperaure(°C) | 58.8 🌡️ | 59 🌡️ |
| Winner: Nvidia GeForce RTX 4060 Ti | ||
In light of our test results, there is no significant difference in the cooling skills of these GPUs. However, considering the exact average figures from our benchmarks, the RTX 4060 Ti showed about 0.3% higher thermal efficiency compared to the RX 6800.
Pricing And Availability
| GPU | Launch MSRP | Current Price |
|---|---|---|
| Nvidia GeForce RTX 4060 Ti | 💲449 | 💲439 |
| AMD Radeon RX 6800 | 💲579 | 💲399 |
| Price Difference | 28.9% | 10% |
Comparing launch prices, the RX 6800 was 28.9% more expensive than the RTX 4060 Ti’s 16GB variant. However, the current prices show the opposite trend. The RX 6800 is now about 10% cheaper than the RTX 4060 Ti due to the RX 6800 being outdated. Yet, the RX 6800 still provides better value.
RX 6800 Vs RTX 4060 Ti: Which One To Buy?
Nvidia GeForce RTX 4060 Ti: The RTX 4060 Ti is Nvidia’s advanced, highly power-efficient GPU that renders very good performance at 1080p and acceptable performance at 1440p. Its 16GB VRAM option is good for tackling memory-intensive tasks.
AMD Radeon RX 6800: The RX 6800 is a potent card from AMD’s previous generation capable well enough for 1440p gaming. It is also power efficient. Its current low price enhances its performance-to-price ratio, delivering greater value.
After all this extensive comparison, I find the RX 6800 a better option for extracting better performance in lower budget. The plus points of the RTX 4060 Ti include its latest architecture and high power efficiency.
FAQs
The RTX 4060 Ti is built on the Ada Lovelace architecture, whereas the RX 6800 utilizes the RDNA 2.0 architecture.
The RX 6800 takes the lead with a remarkable 19.7% boost in FPS performance over the RTX 4060 Ti.
The RTX 4060 Ti stands out with a noteworthy 20.7% advantage in power efficiency over the RX 6800, coupled with a marginal 0.3% lead in lower average temperatures.
More from RTX 4060 Ti:
More from RX 6800:
Thank you! Please share your positive feedback. 🔋
How could we improve this post? Please Help us. 😔
[Comparisons Expert]
Shehryar Khan, a seasoned PC hardware expert, brings over five years of extensive experience and a deep passion for the world of technology. With a love for building PCs and a genuine enthusiasm for exploring the latest advancements in components, his expertise shines through his work and dedication towards this field. Currently, Shehryar is rocking a custom loop setup for his built.
Get In Touch: shehryar@tech4gamers.com


