


Nvidia GeForce RTX 4060
Rated: 8.4/10
AMD Radeon RX 6800 XT
Rated: 8.7/10
Pros And Cons
| GPU | Pros | Cons |
|---|---|---|
| Nvidia GeForce RTX 4060 | ✅ Fine Ray Tracing and DLSS performance in $300 ✅ Highly energy-efficient GPU | ❌ Stuttering happens due to limited bandwidth ❌ Low performance at higher resolutions |
| AMD Radeon RX 6800 XT | ✅ Great 1440p plus 4K performance ✅ 256-Bit 16GB greater memory | ❌ Consumes more energy ❌ Lags in Ray Tracing performance |
- In my gaming tests, the RX 6800 XT impressively outperformed the RTX 4060 with an average of 140.1 FPS, a notable 55% higher than its corrival’s average of 90.3 FPS at 1440p.
- Considering GPU temperature at 1440p gaming, the RX 6800 XT proves 9.1% more thermally efficient than the RTX 4060.
- Regarding the GPU cost, the RTX 4060 is now selling for about $289, while the RX 6800 XT is available for $489.
- I’d suggest opting for the RX 6800 XT for its superior performance capabilities and the RTX 4060 for its remarkable energy efficiency and affordability.
Comparison Table
| Feature | Nvidia RTX 4060 | AMD RX 6800 XT |
|---|---|---|
| Architecture | NVIDIA Ada Lovelace | RDNA 2.0 |
| Shading Units | 3072 (CUDA Cores) | 4608 (Stream Processors) |
| Ray Tracing Cores | 30 | 72 |
| Boost Clock | Up to 2.46GHz | Up to 2250MHz |
| Base Clock | 1.83GHz | 1825MHz |
| Memory Clock / Speed | 2125 MHz / 17 Gbps effective | 2000 MHz / 16 Gbps effective |
| Bandwidth | Up to 512 GB/s | Up to 272 GB/s |
| GPU Power | 115W | 300W |
| Maximum Temperature | 90°C | 90°C |
| Best Variants | Best RTX 4060 Graphics Cards | BestRX 6800 XT Graphics Cards |
Architectural Difference
- Process Node: The RTX 4060 and RX 6800 XT showcase impressive hardware, utilizing the cutting-edge 5nm and 7nm fabrication technologies at TSMC to bring forth the power of their AD106 and Navi 21 graphics chips, respectively.
- Clock Speed: Regarding maximum frequency, the RTX 4060 takes the lead with an impressive 2.46GHz, surpassing the RX 6800 XT’s 2.25GHz by 9.33%. Nevertheless, both GPUs share an identical base clock speed, hovering around 1.83 GHz.
- VRAM: Concerning VRAM, the Nvidia RTX 4060 offers 8GB GDDR6 memory on a 128-bit interface. In contrast, the AMD RX 6800 XT leaps forward, delivering an obliging 256-bit 16GB GDDR6 memory.
- Supported Technologies: The RTX 4060 showcases Nvidia’s cutting-edge advancements with DLSS 3.0, Omniverse, and Reflex, while the RX 6800 XT boasts AMD’s FidelityFX Super Resolution, Adrenalin Edition software, and AMD Link.
In today’s showdown, we will focus on the battle between Nvidia’s RTX 4060 and AMD’s formidable Radeon RX 6800 XT. With both promising exceptional performance and groundbreaking features, it’s time to uncover which GPU reigns supreme in the RTX 4060 vs RX 6800 XT battle.
Gaming Benchmarks
In this part of the comparison, we will rigorously test both graphics cards for gaming performance at 1440p resolution. We can gain significant information on their skills and abilities by analyzing their performance in taxing games.
Gaming Rig
- CPU: AMD Ryzen 7 7700X
- Motherboard: ASRock B650E PG-ITX WIFI
- RAM: G.Skill Trident Z5 RGB 32GB DDR5-6600 CL34 Kit
- SSD: CORSAIR MP700 PRO 2TB Gen5 NVMe SSD Review
- PSU: Enermax Revolution D.F. X 1050W
- CPU Cooler: ALPHACOOL CORE OCEAN T38 CPU AIO 360mm
Assassin’s Creed Odyssey
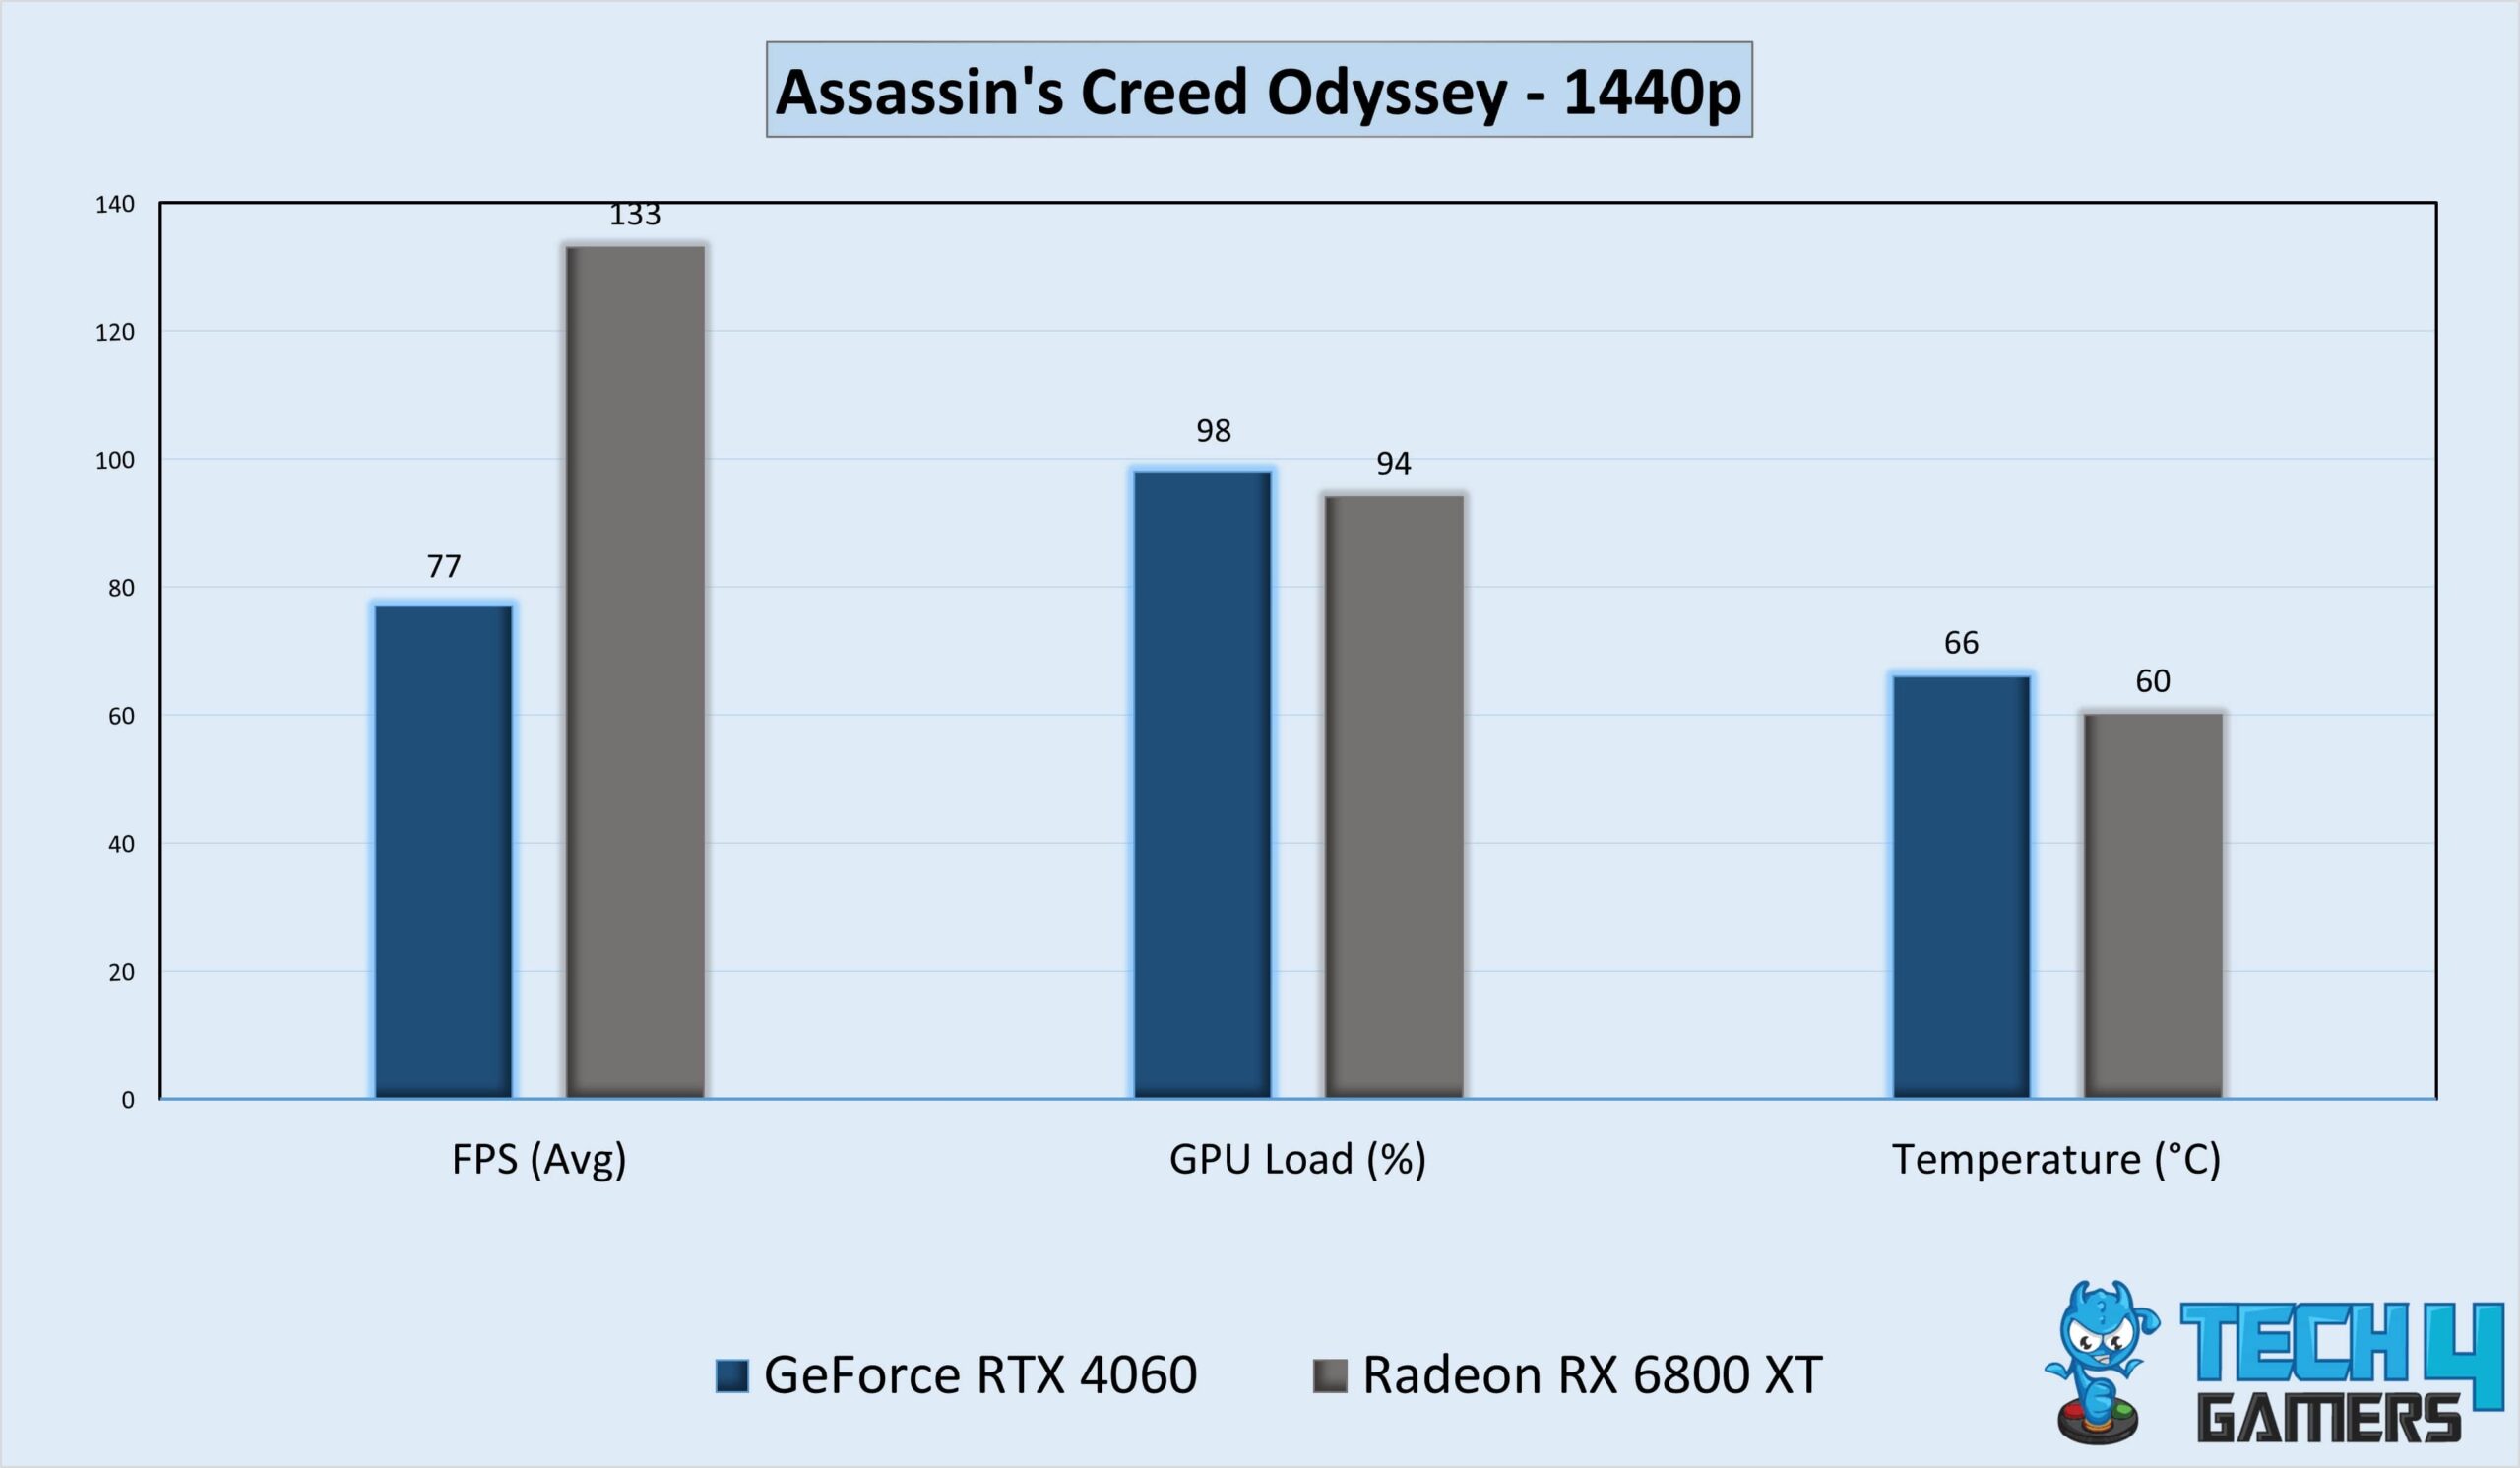
- While playing Assassin’s Creed Odyssey, we noted that the RX 6800 XT performed approximately 73% better than the RTX 4060.
- The RTX 4060 produced an average frame rate of only 77 FPS at 1440p, while the RX 6800 XT delivered a supreme average of 133 FPS at 1440p.
Cyberpunk 2077
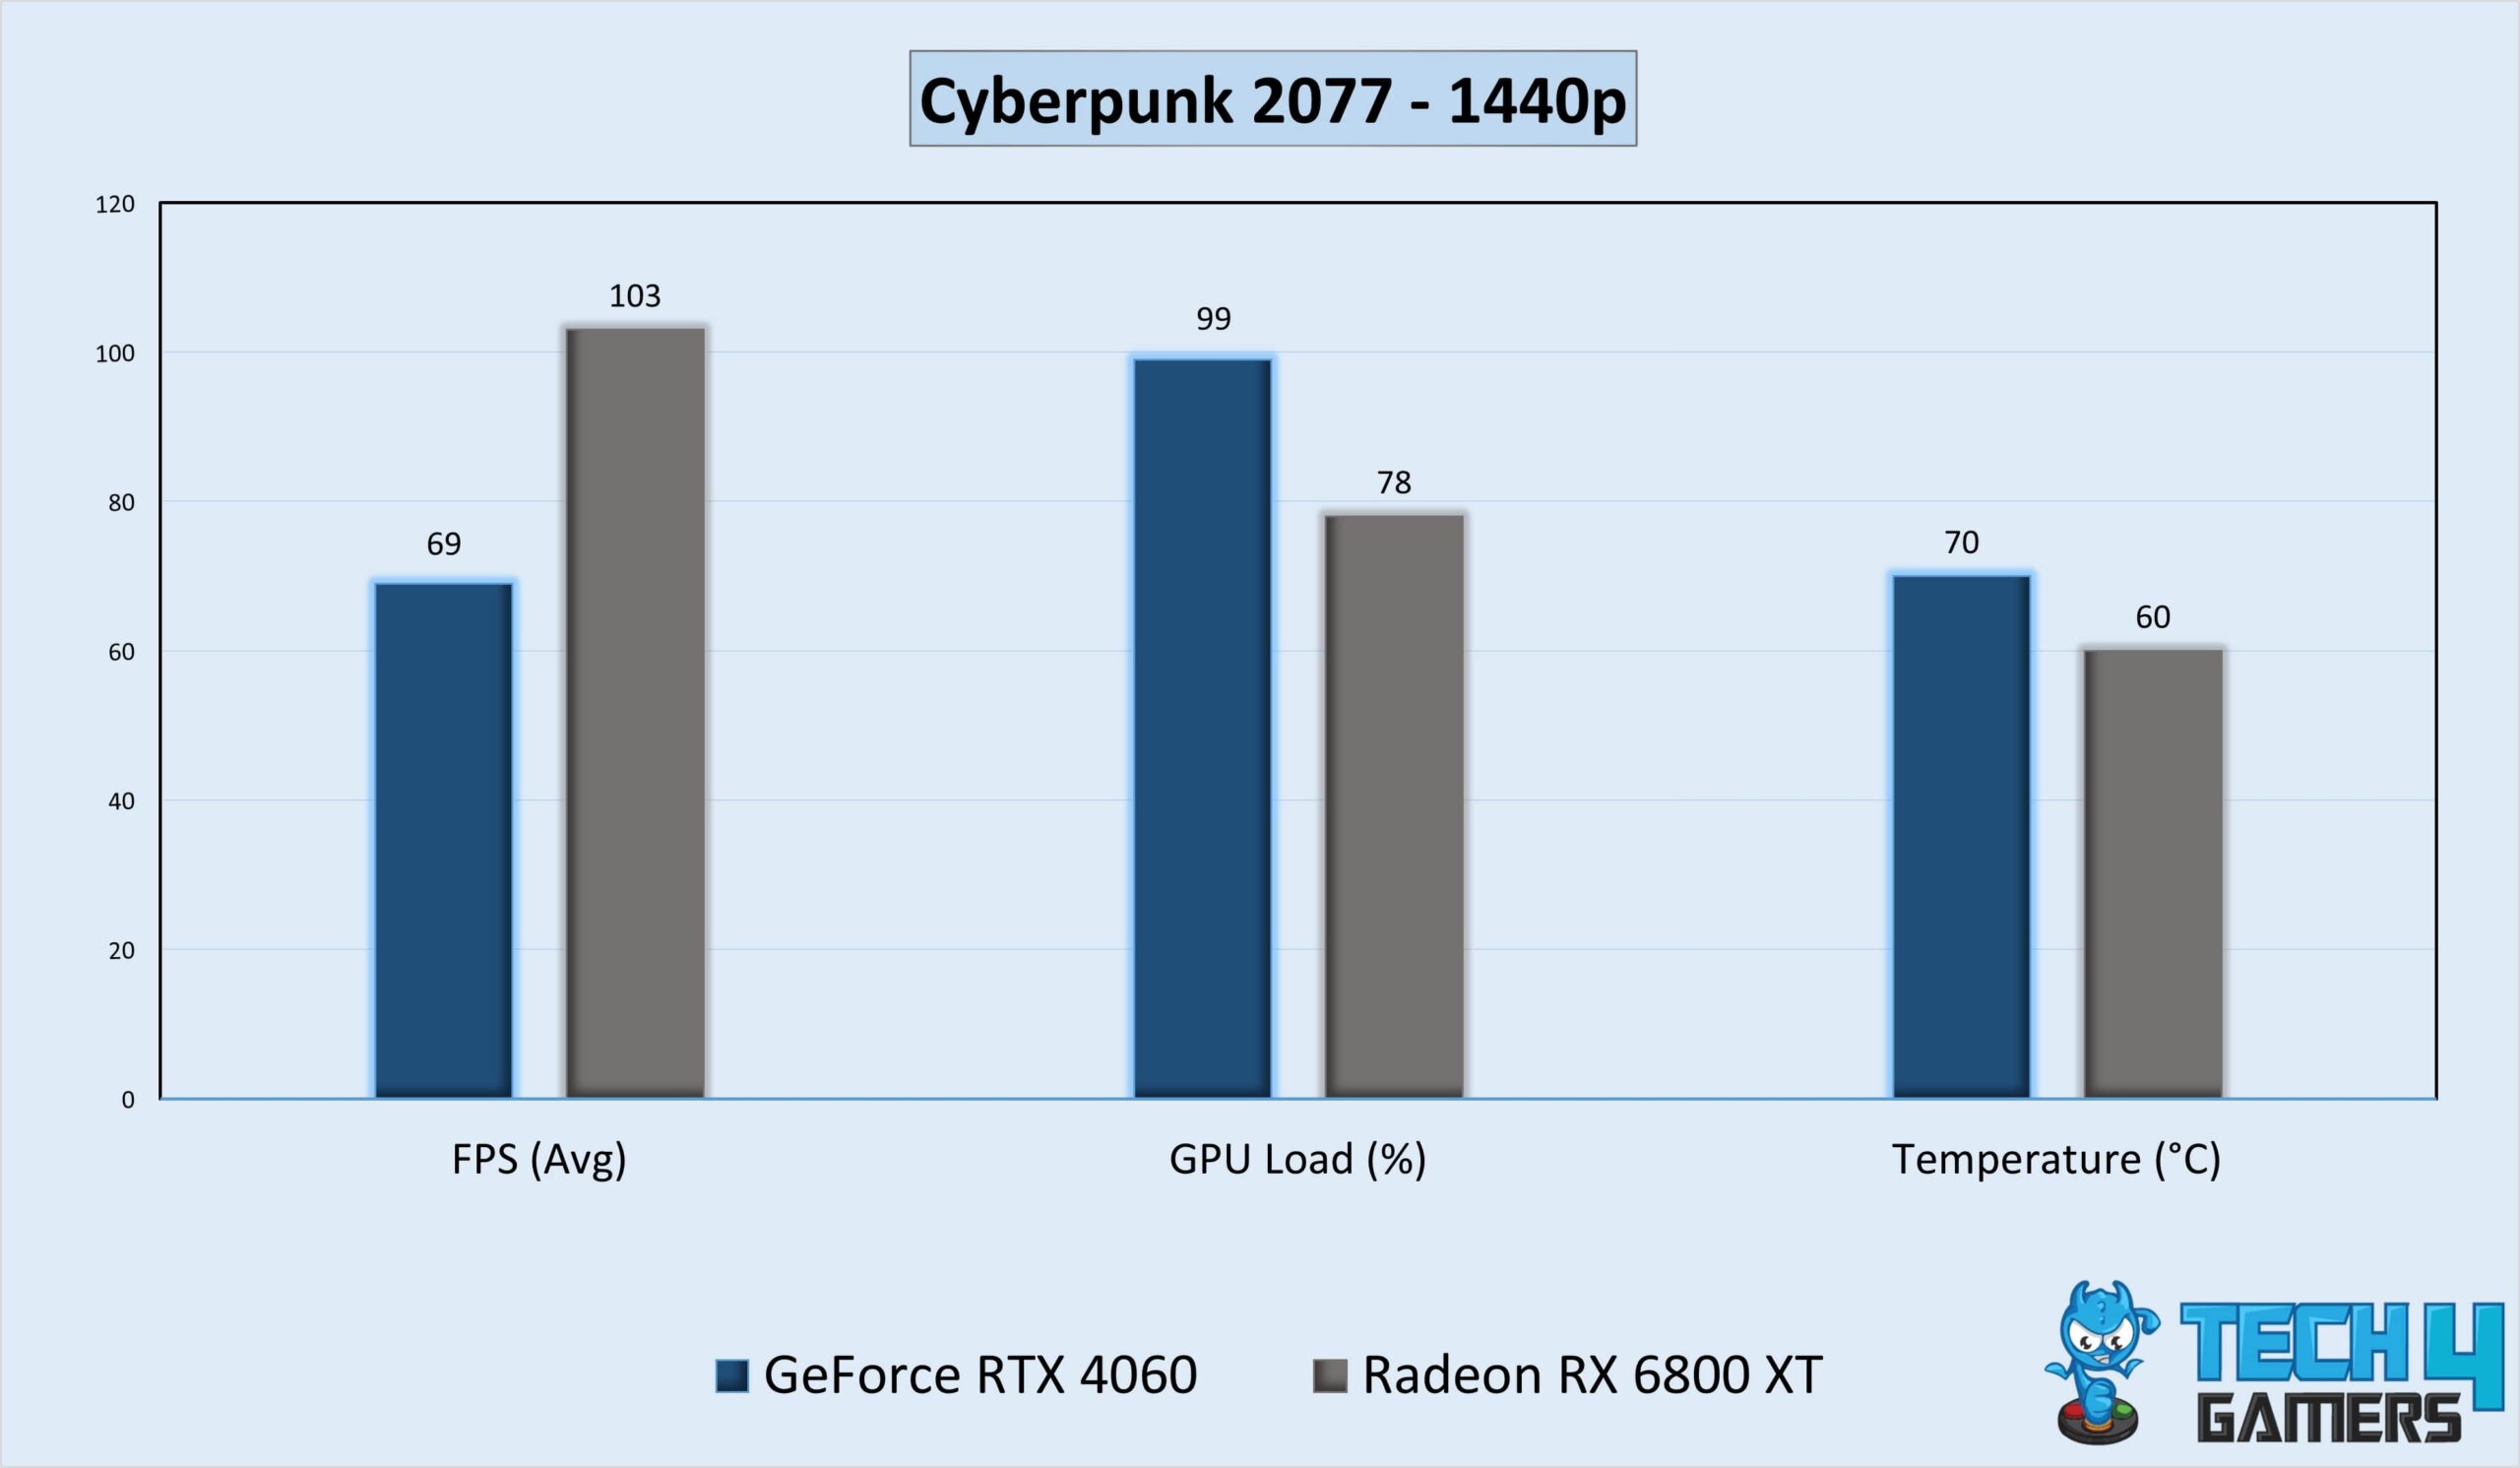
- The RX 6800 XT dominated Cyberpunk 2077, outperforming the RTX 4060 by an average margin of 50%.
- At 1440p, the RX 6800 XT achieved an impressive average of 103 FPS, while the RTX 4060 lagged with just 69 FPS on average.
Assassin’s Creed Valhalla
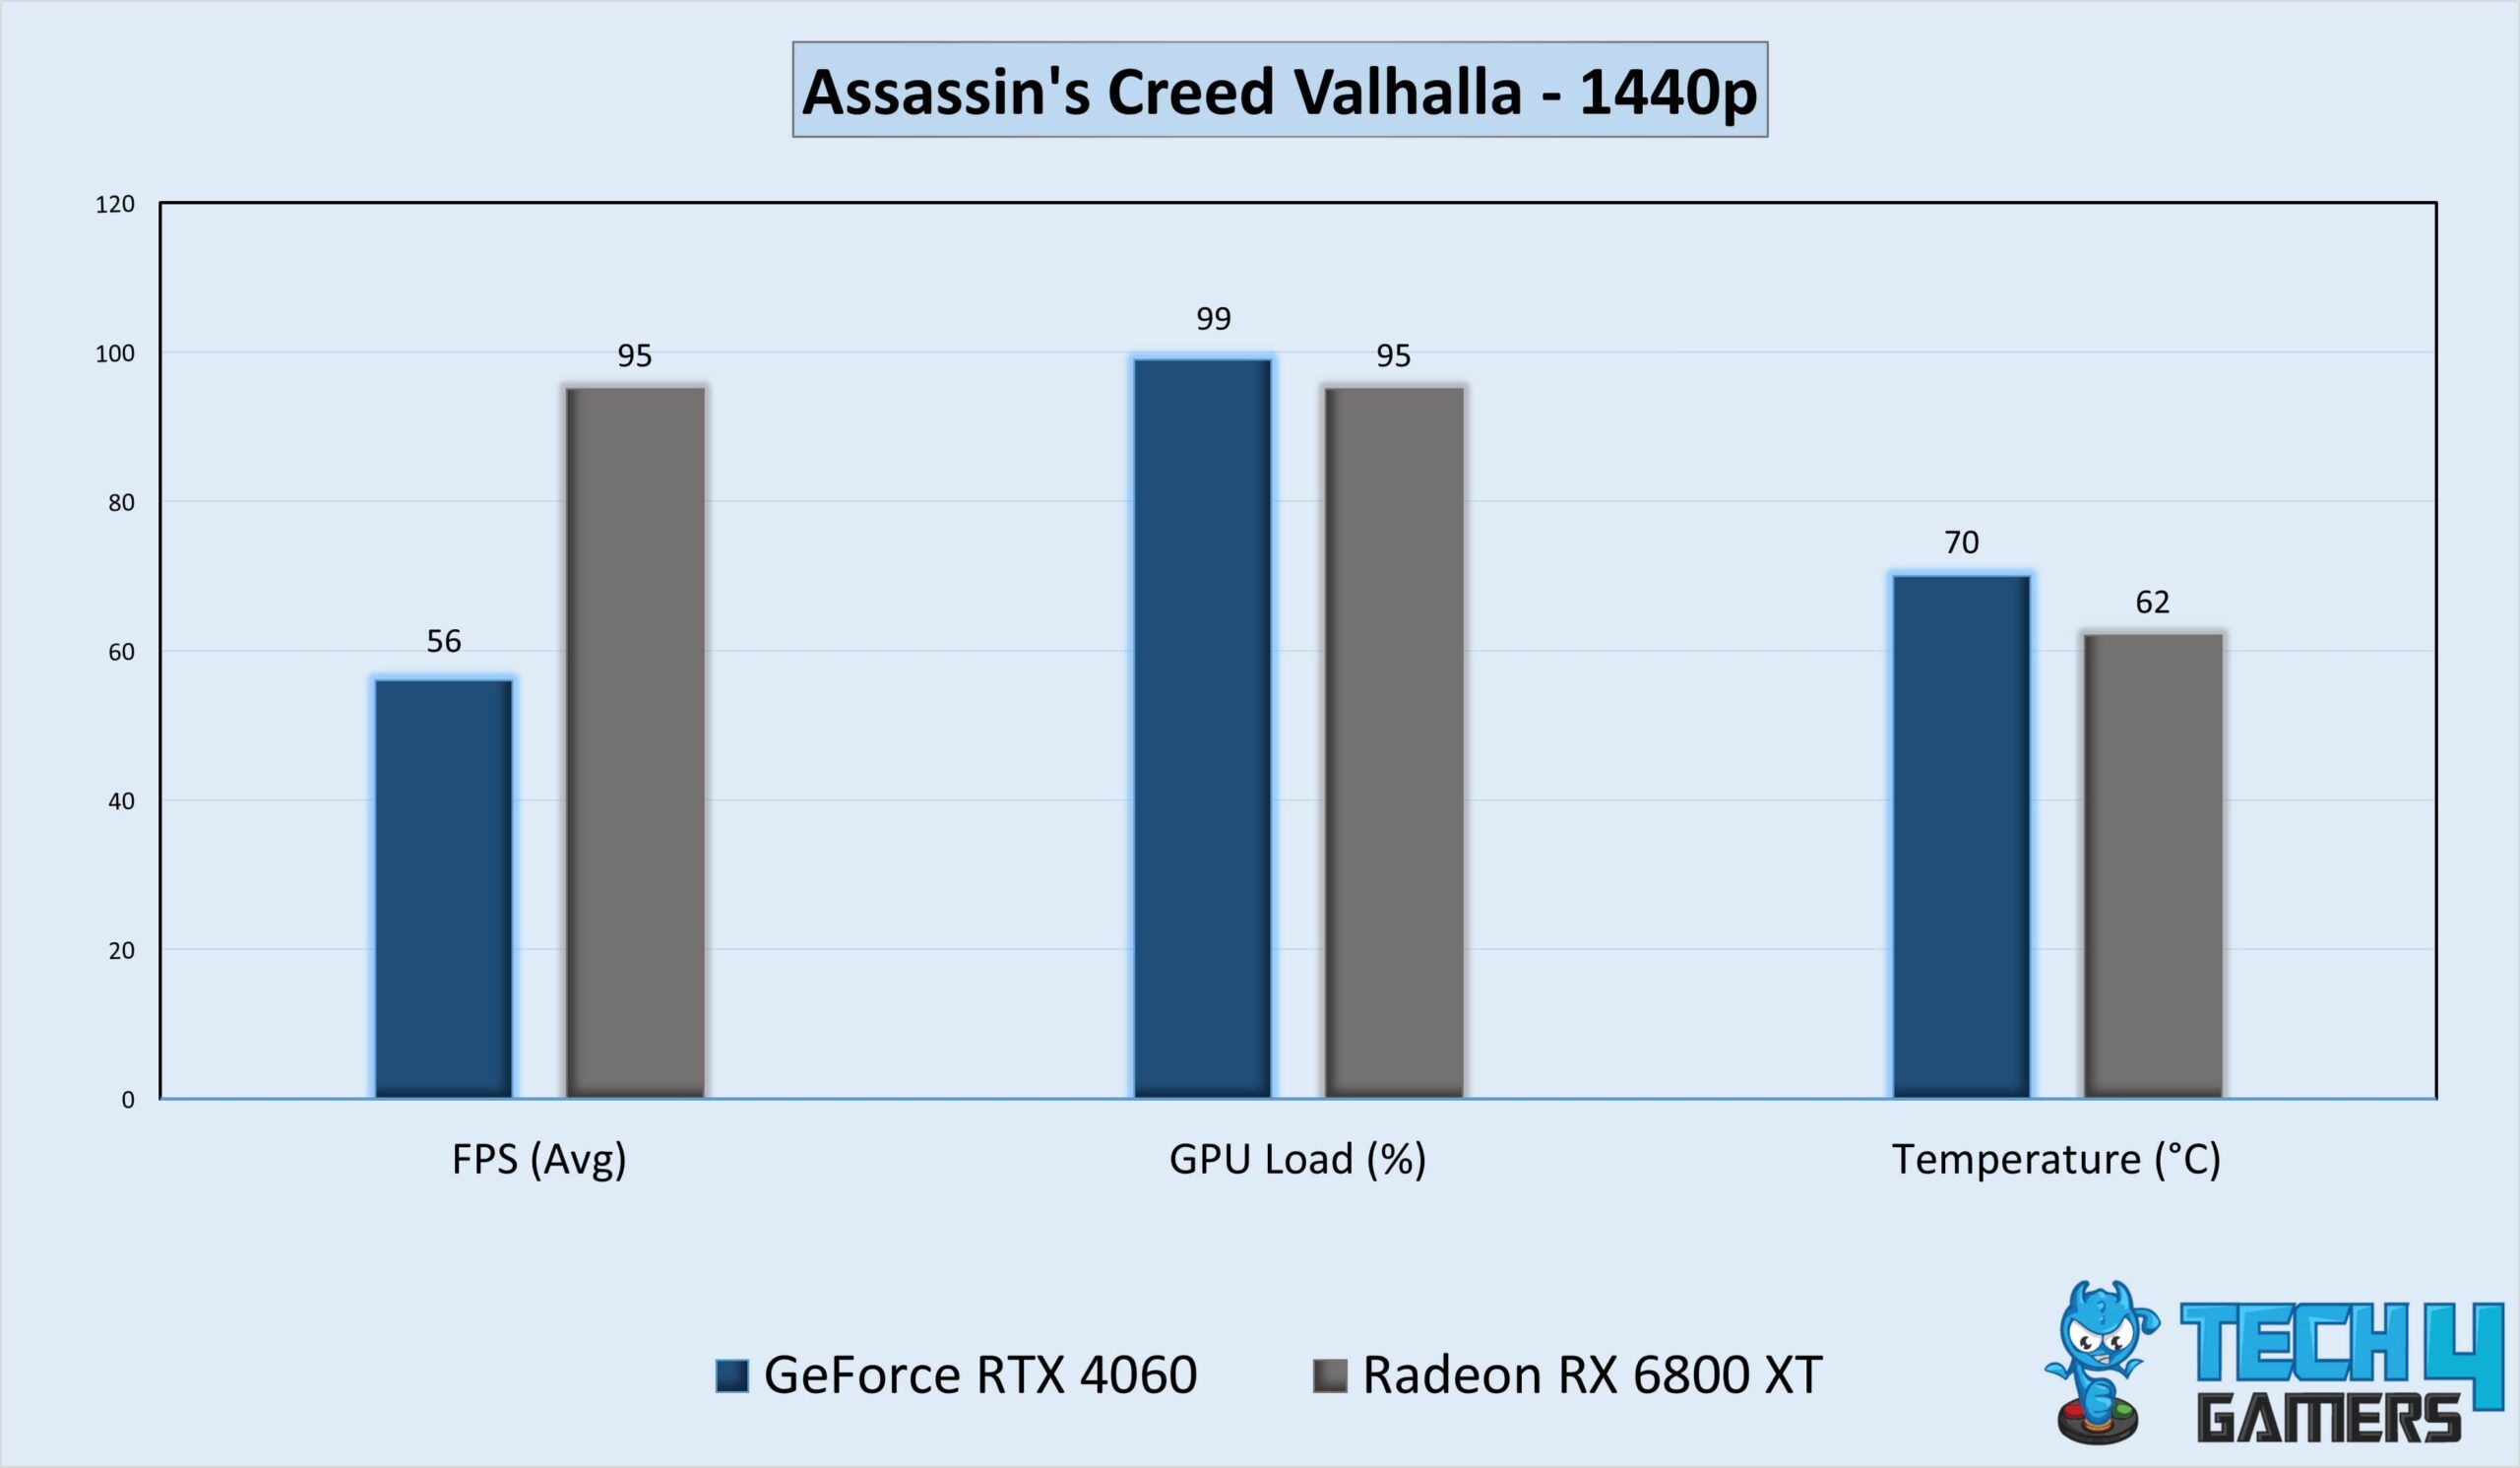
- At 1440p, the RX 6800 XT defeated the RTX 4060 by an average performance margin of around 70% in our Assassin’s Creed Valhalla gameplay.
- The RX 6800 XT delivered an exceptional average of 95 FPS at 1440p, whereas the RTX 4060 produced only 56 FPS on average.
Doom Eternal
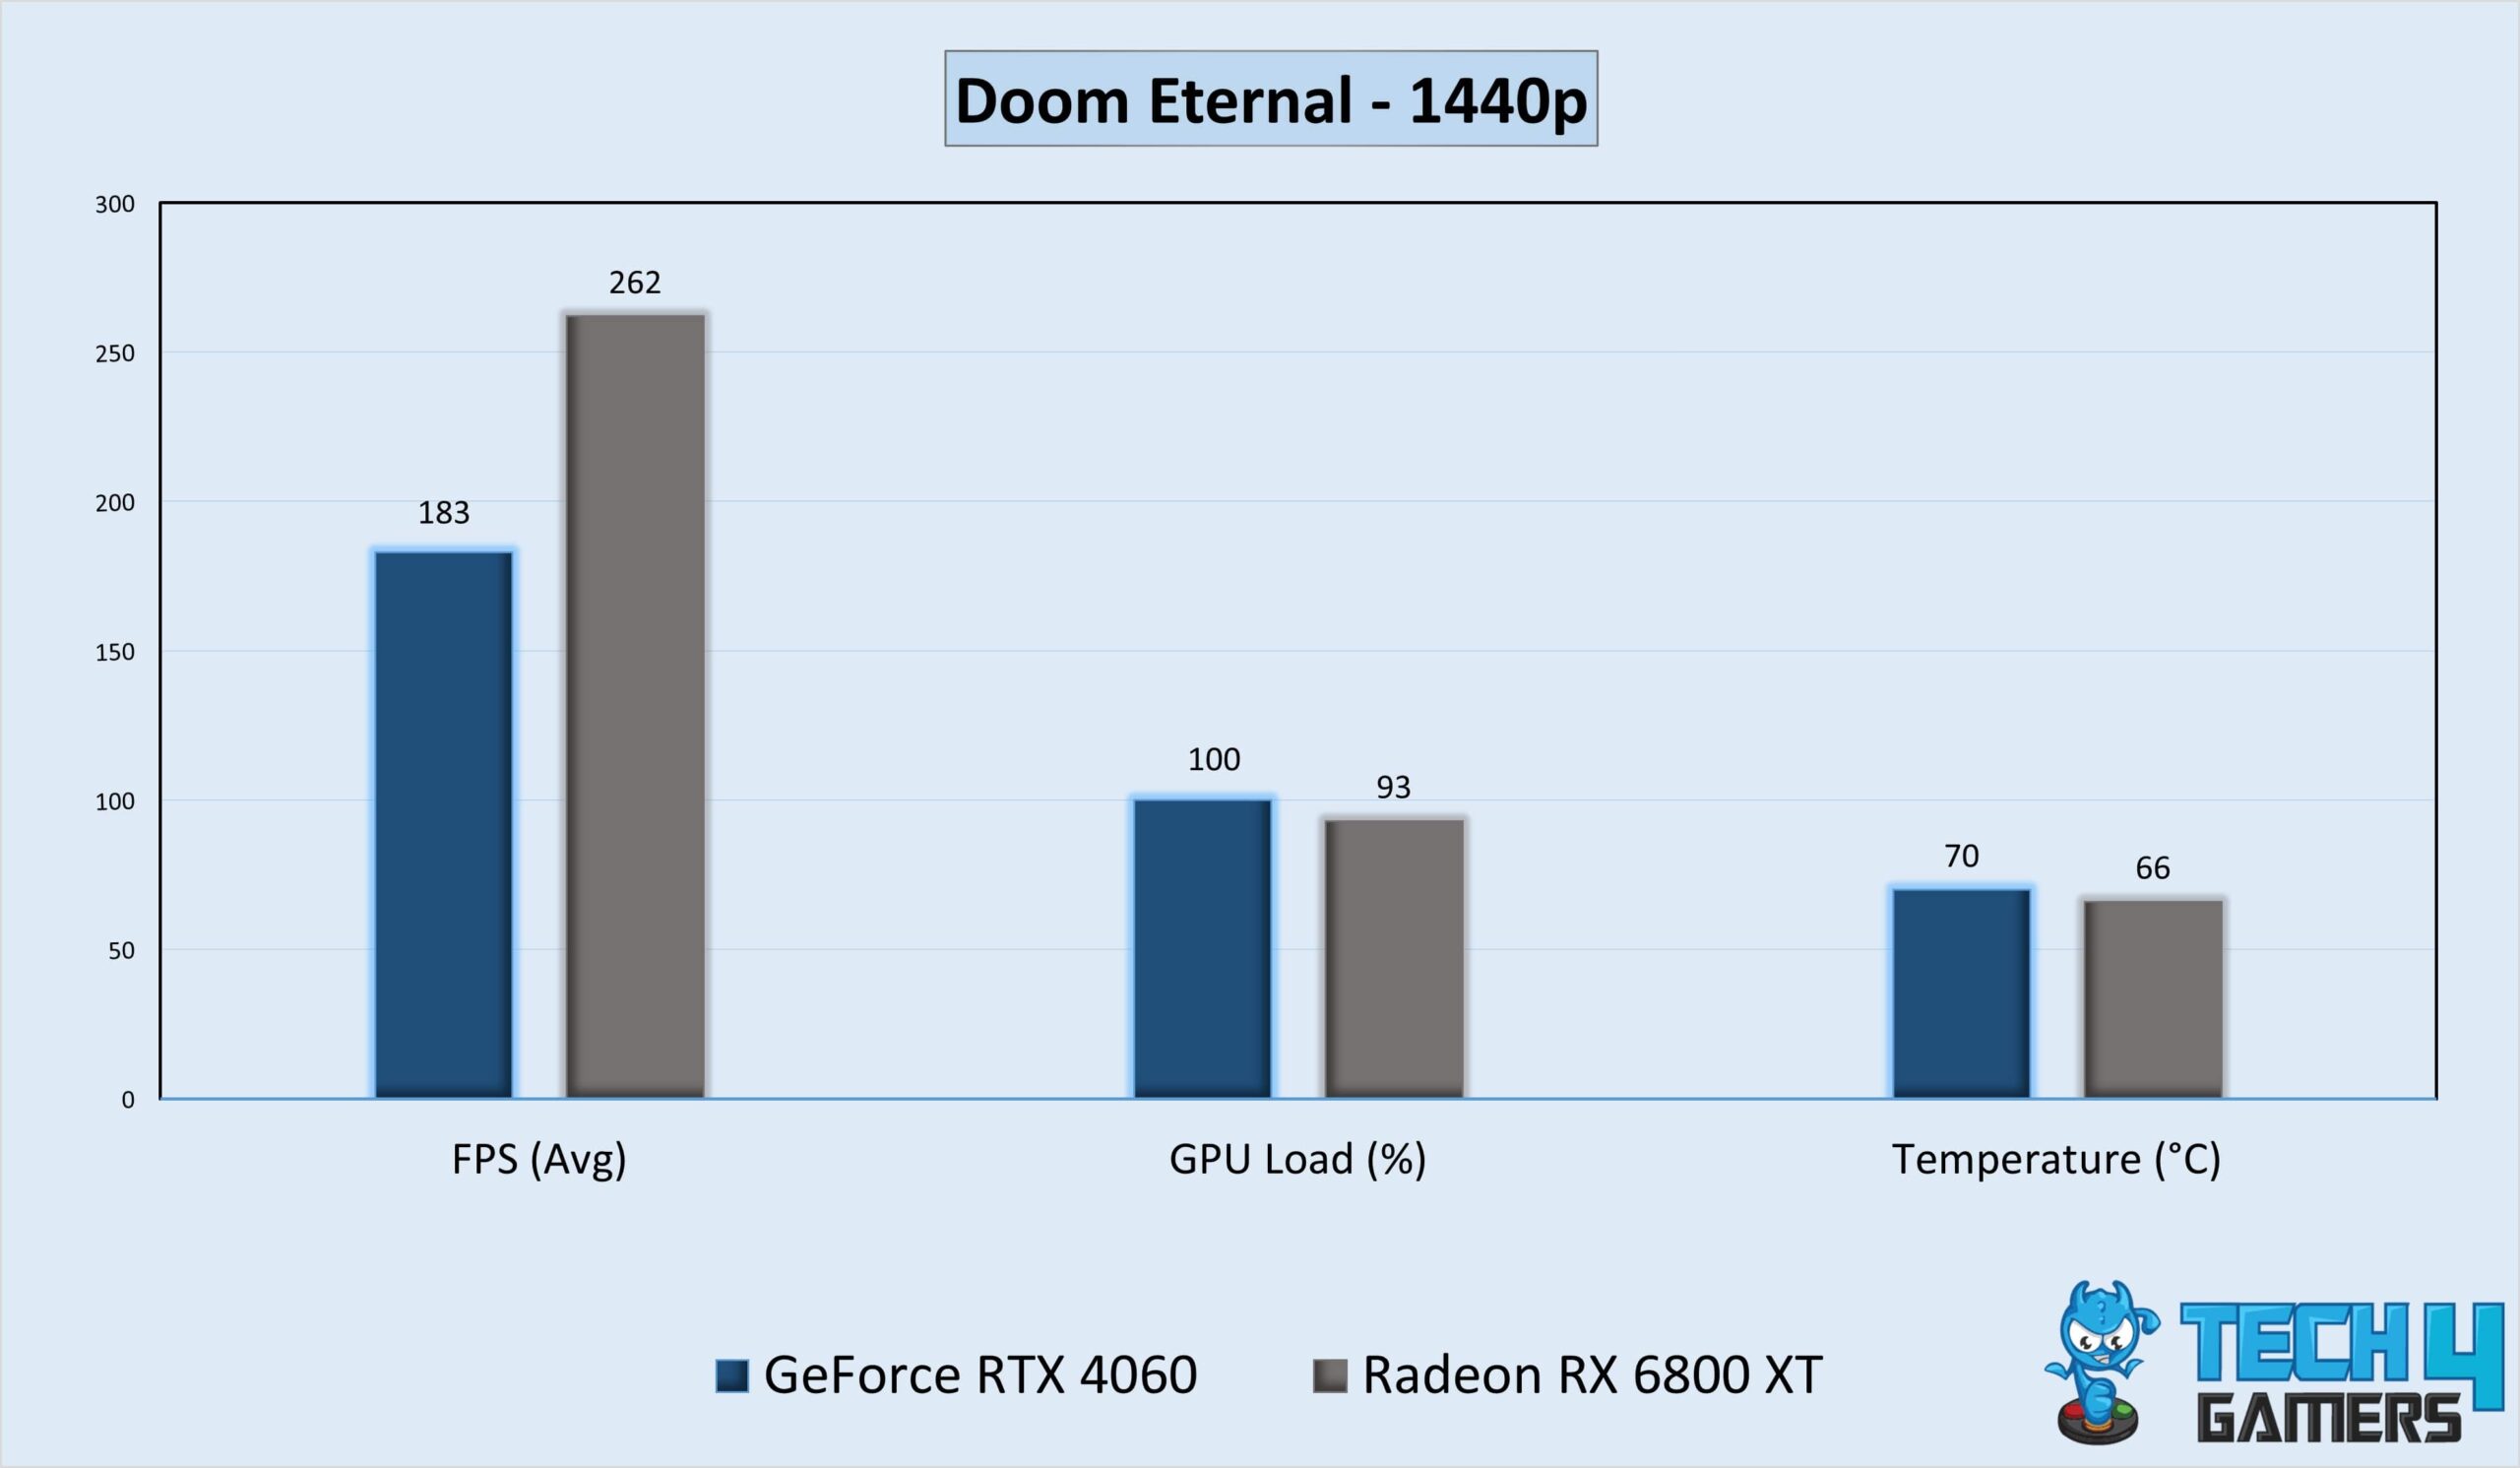
- By surpassing the RTX 4060 by an average lead of 43%, the RX 6800 XT prevailed in Doom Eternal.
- The RX 6800 XT impressively averaged 262 FPS at 1440p, whereas the RTX 4060 struggled with just 183 FPS.
Horizon Zero Dawn
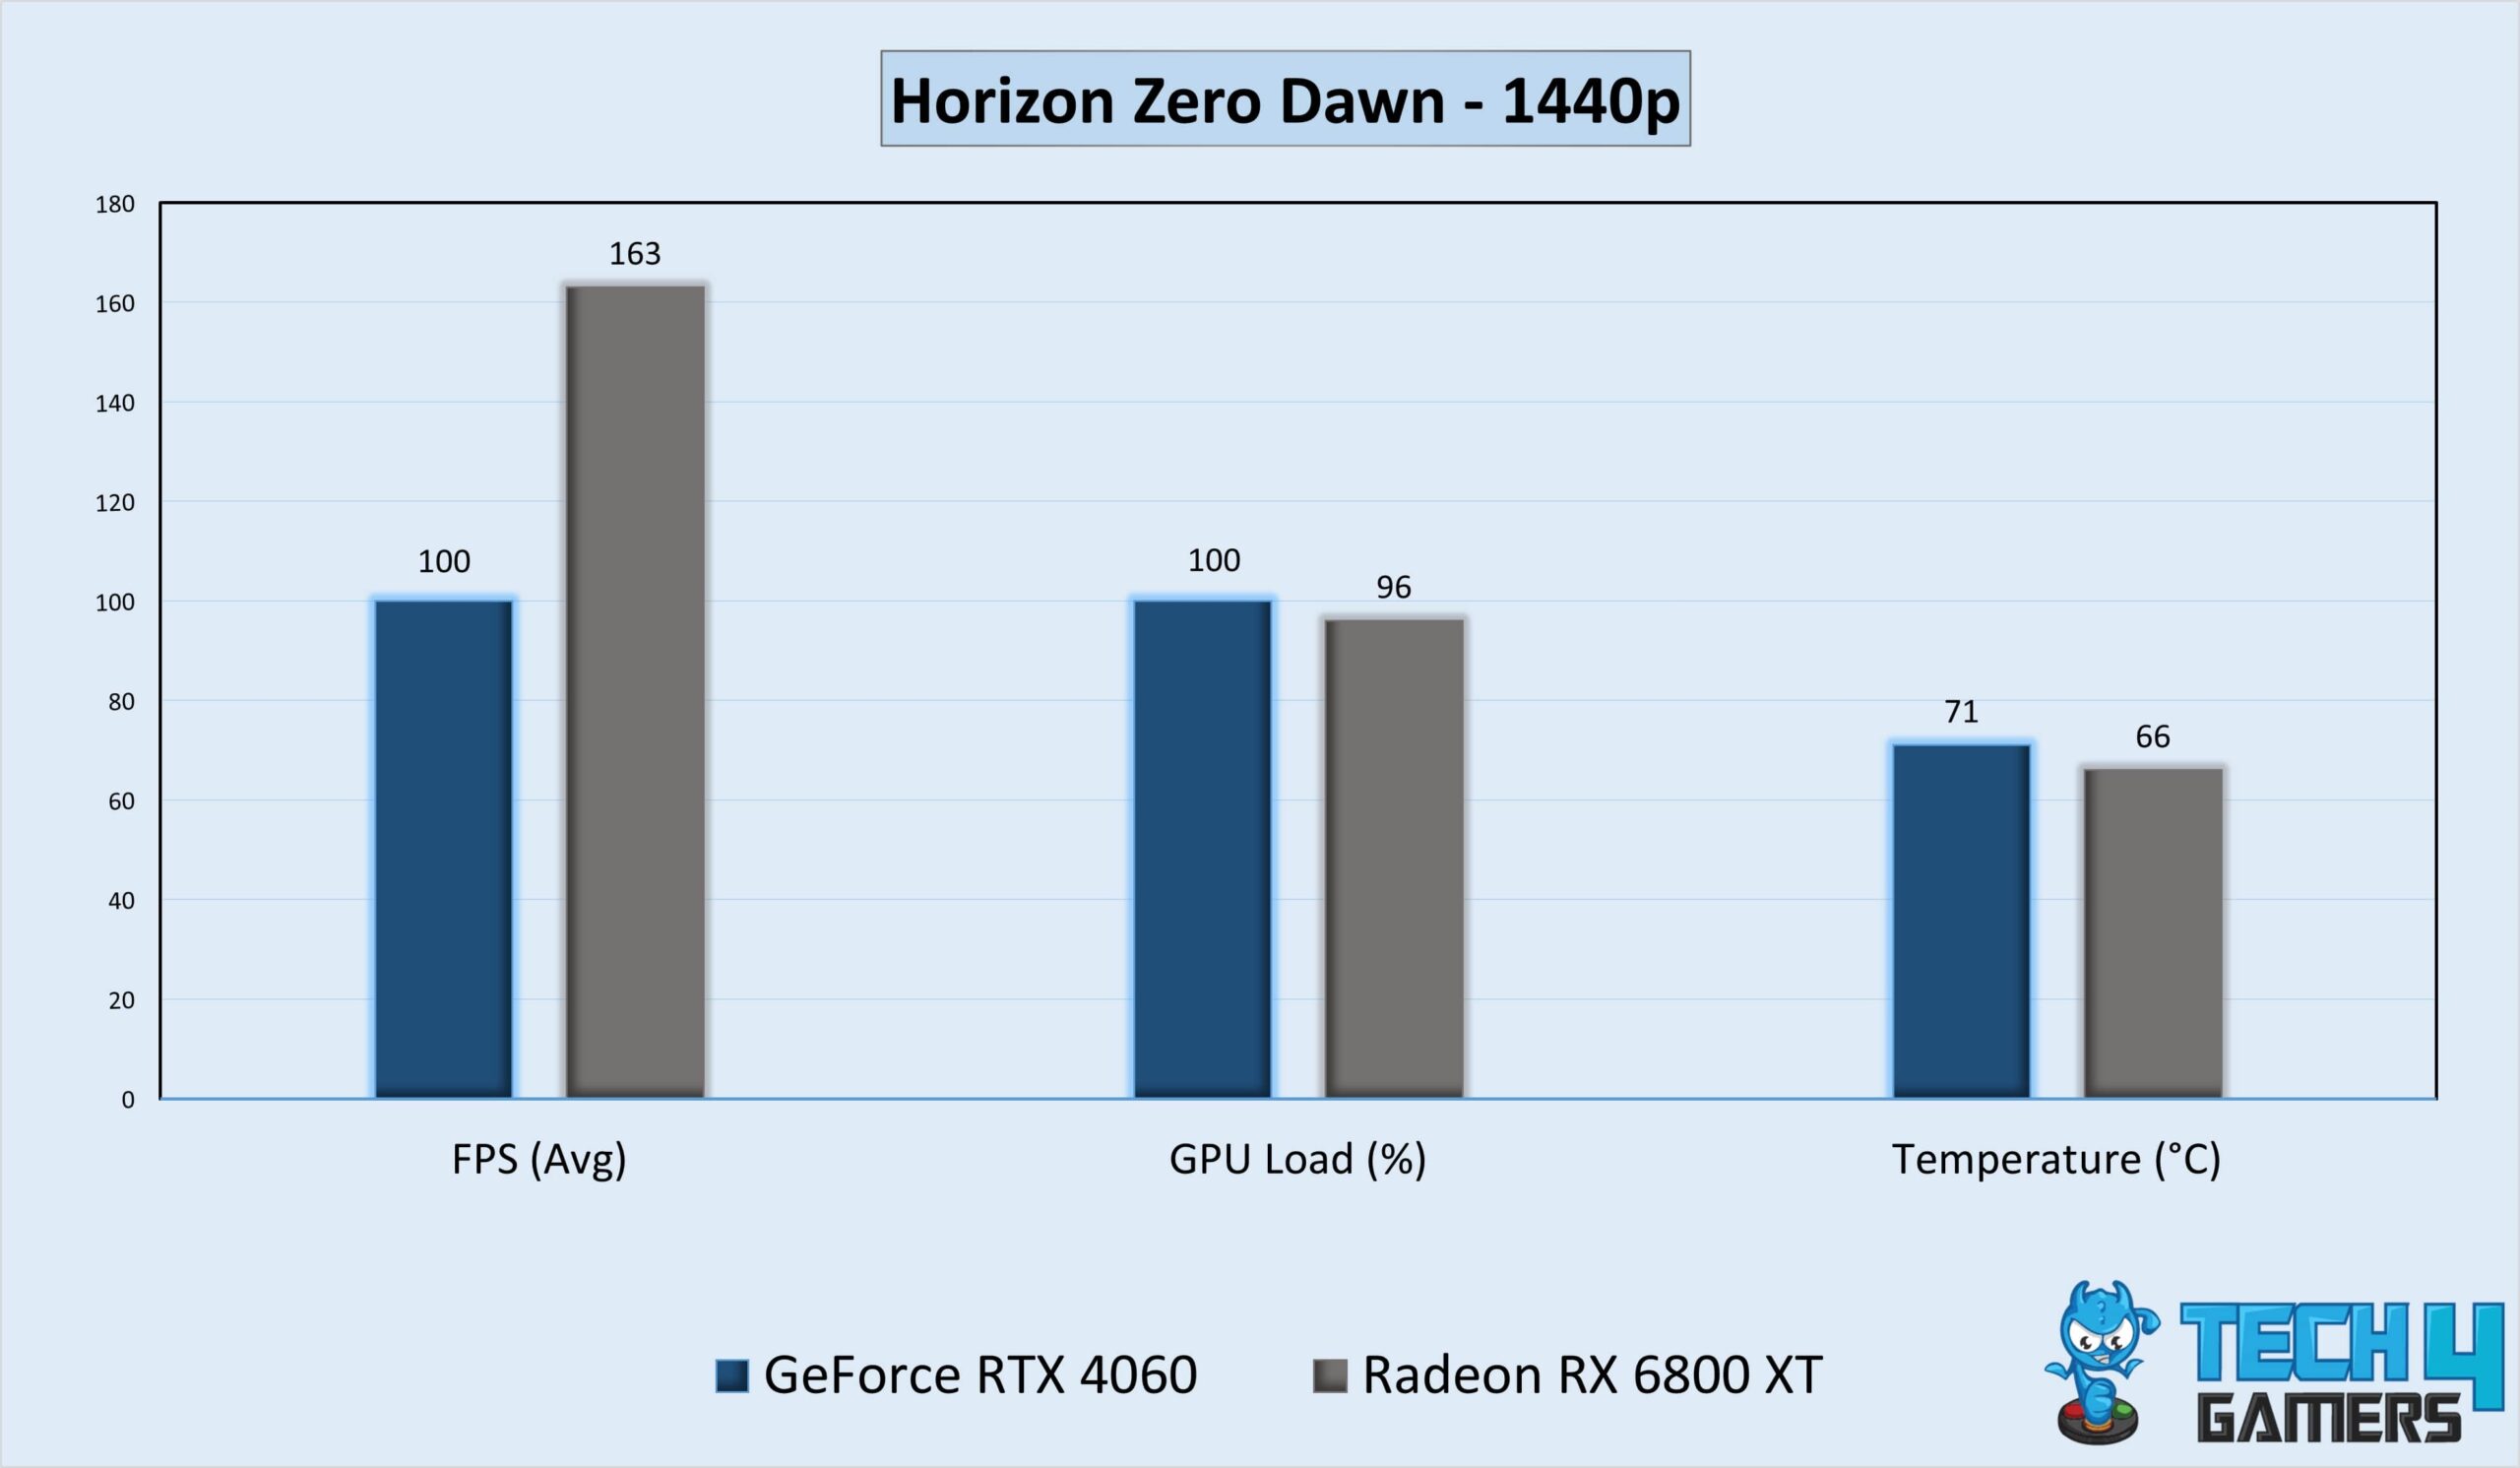
- In our session of Doom Eternal, the RX 6800 XT conquered by outperforming the RTX 4060 by a mean edge of 63%.
- The RTX 4060 labored to achieve 100 FPS on average at 1440p, while the RX 6800 XT admirably averaged 163 FPS.
Red Dead Redemption 2
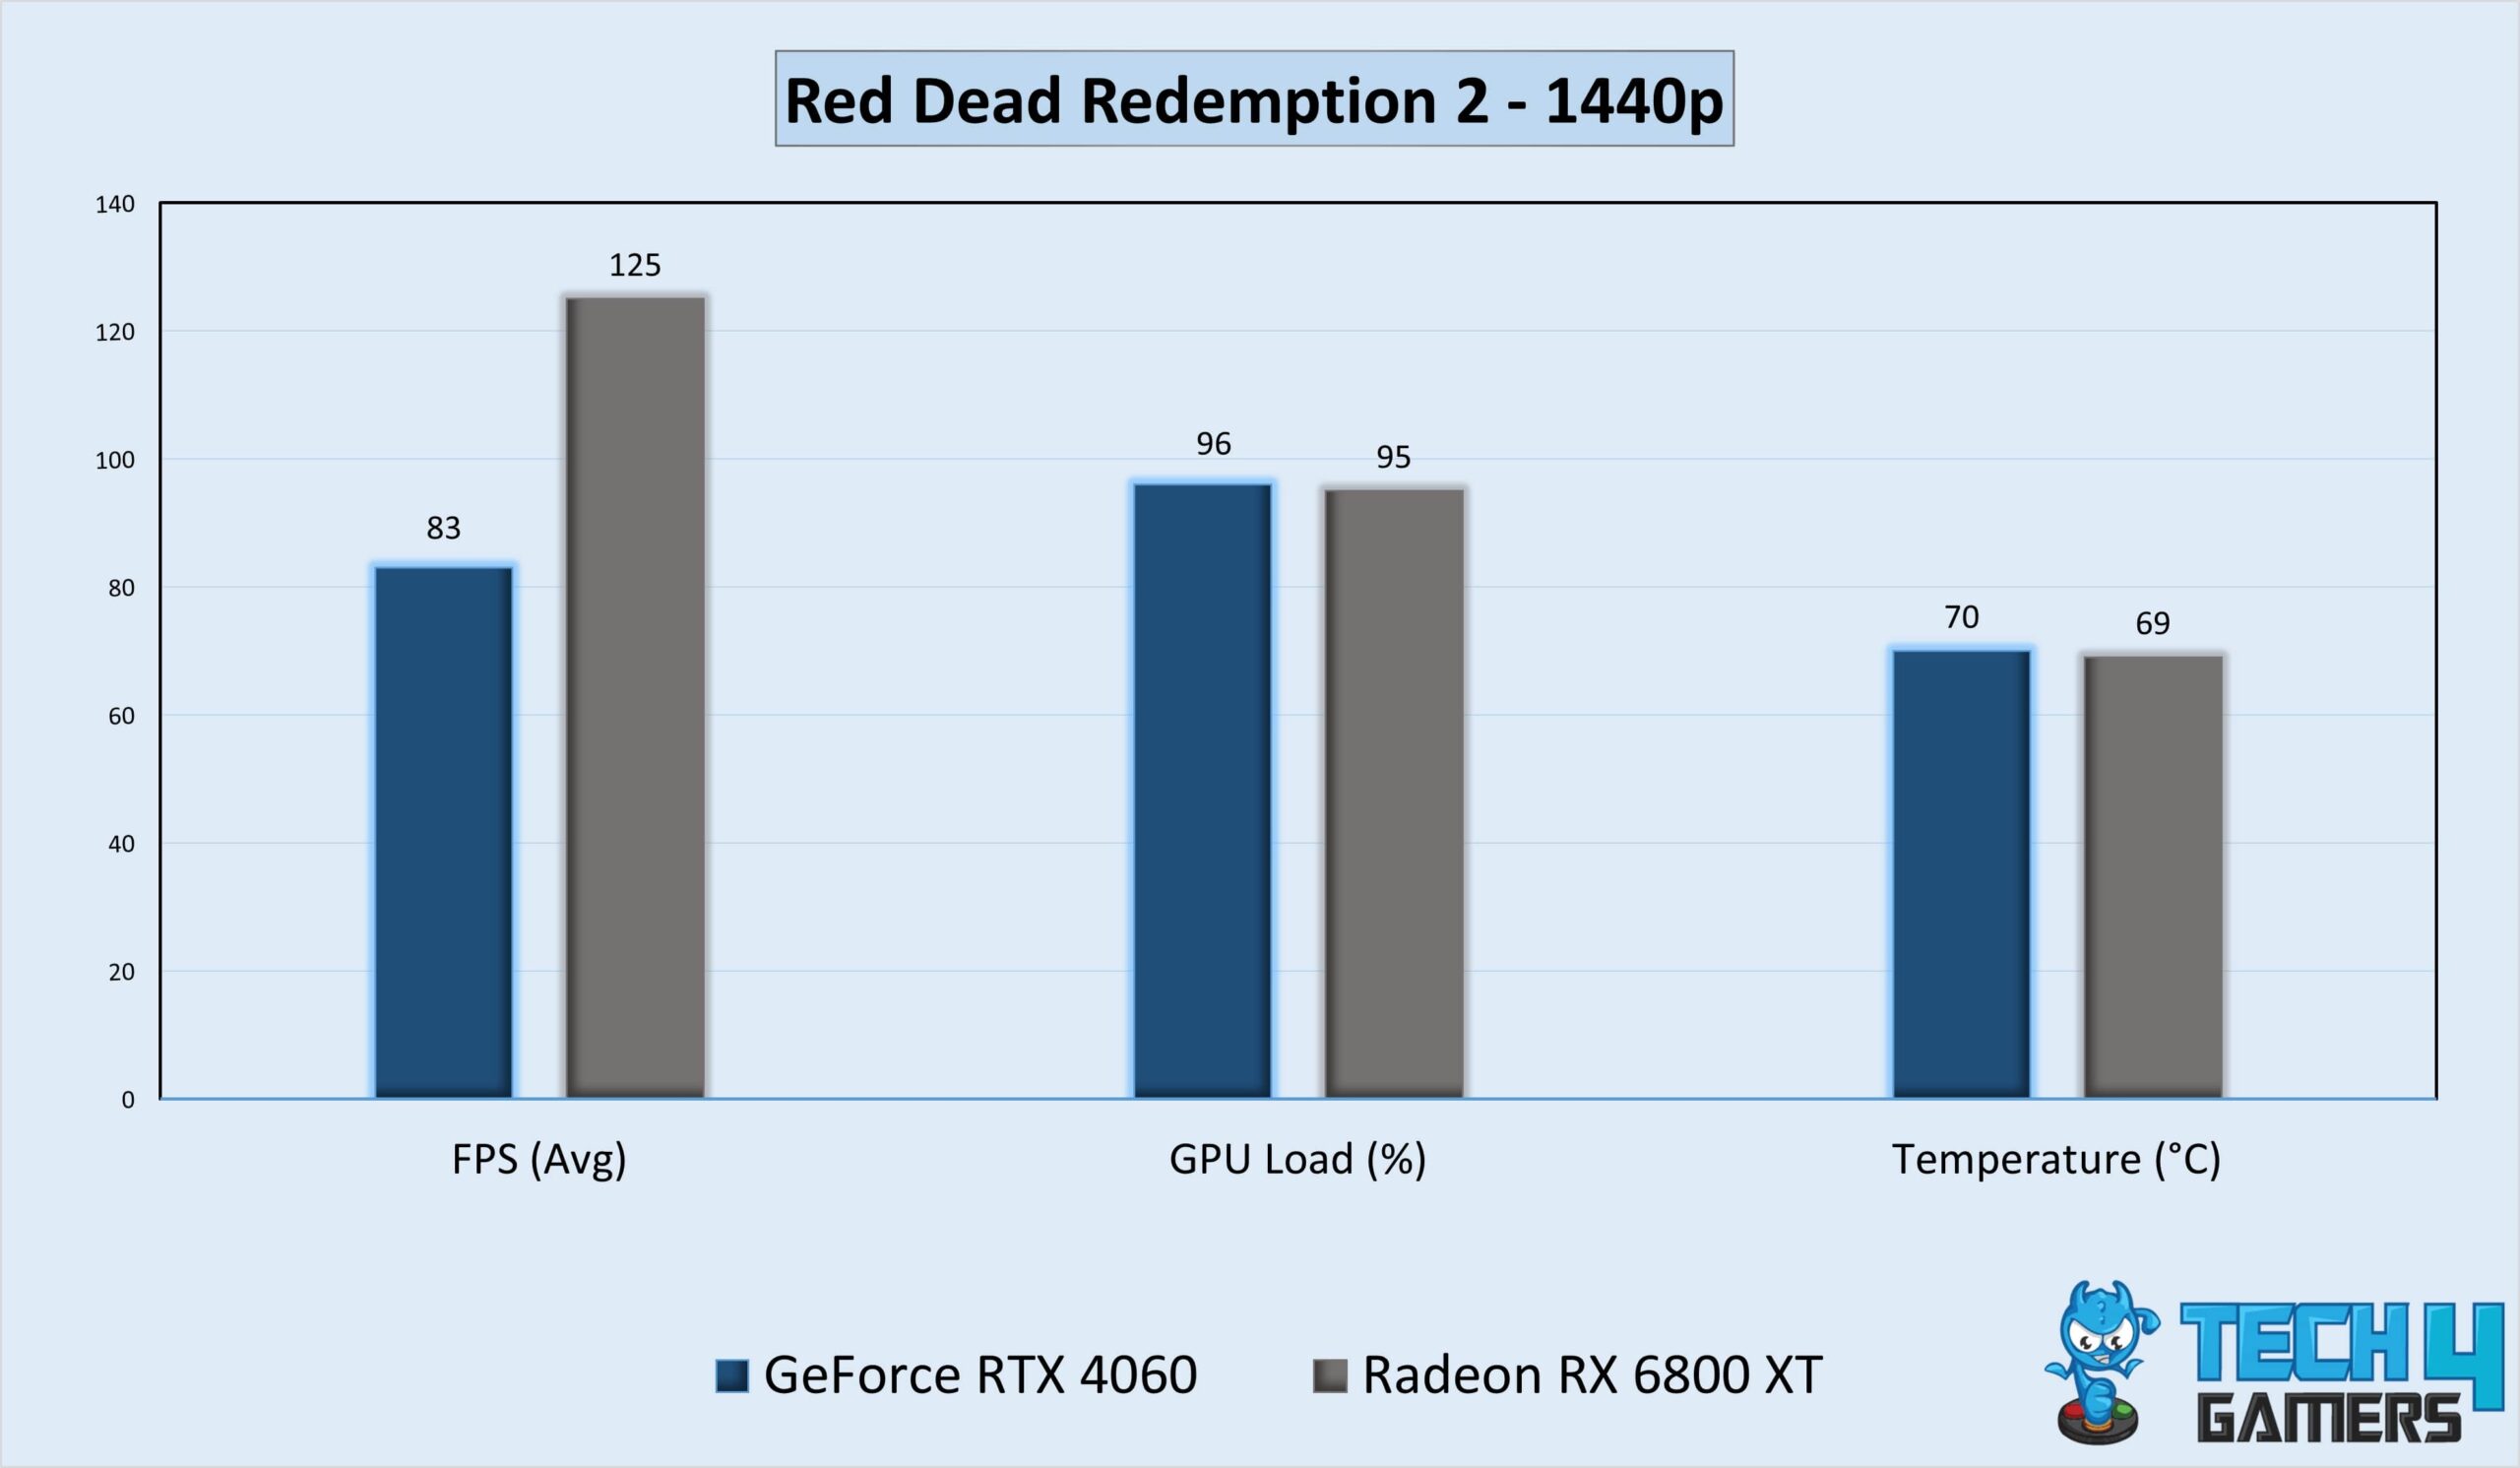
- The RX 6800 XT fared well in Red Dead Redemption 2, outperforming the RTX 4060 by a 50.6% performance gap.
- During the gameplay, the RX 6800 XT excelled with a commendable average of 125 FPS, while the RTX 4060 mustered an average of 83 FPS at 1440p.
Watch Dogs Legion
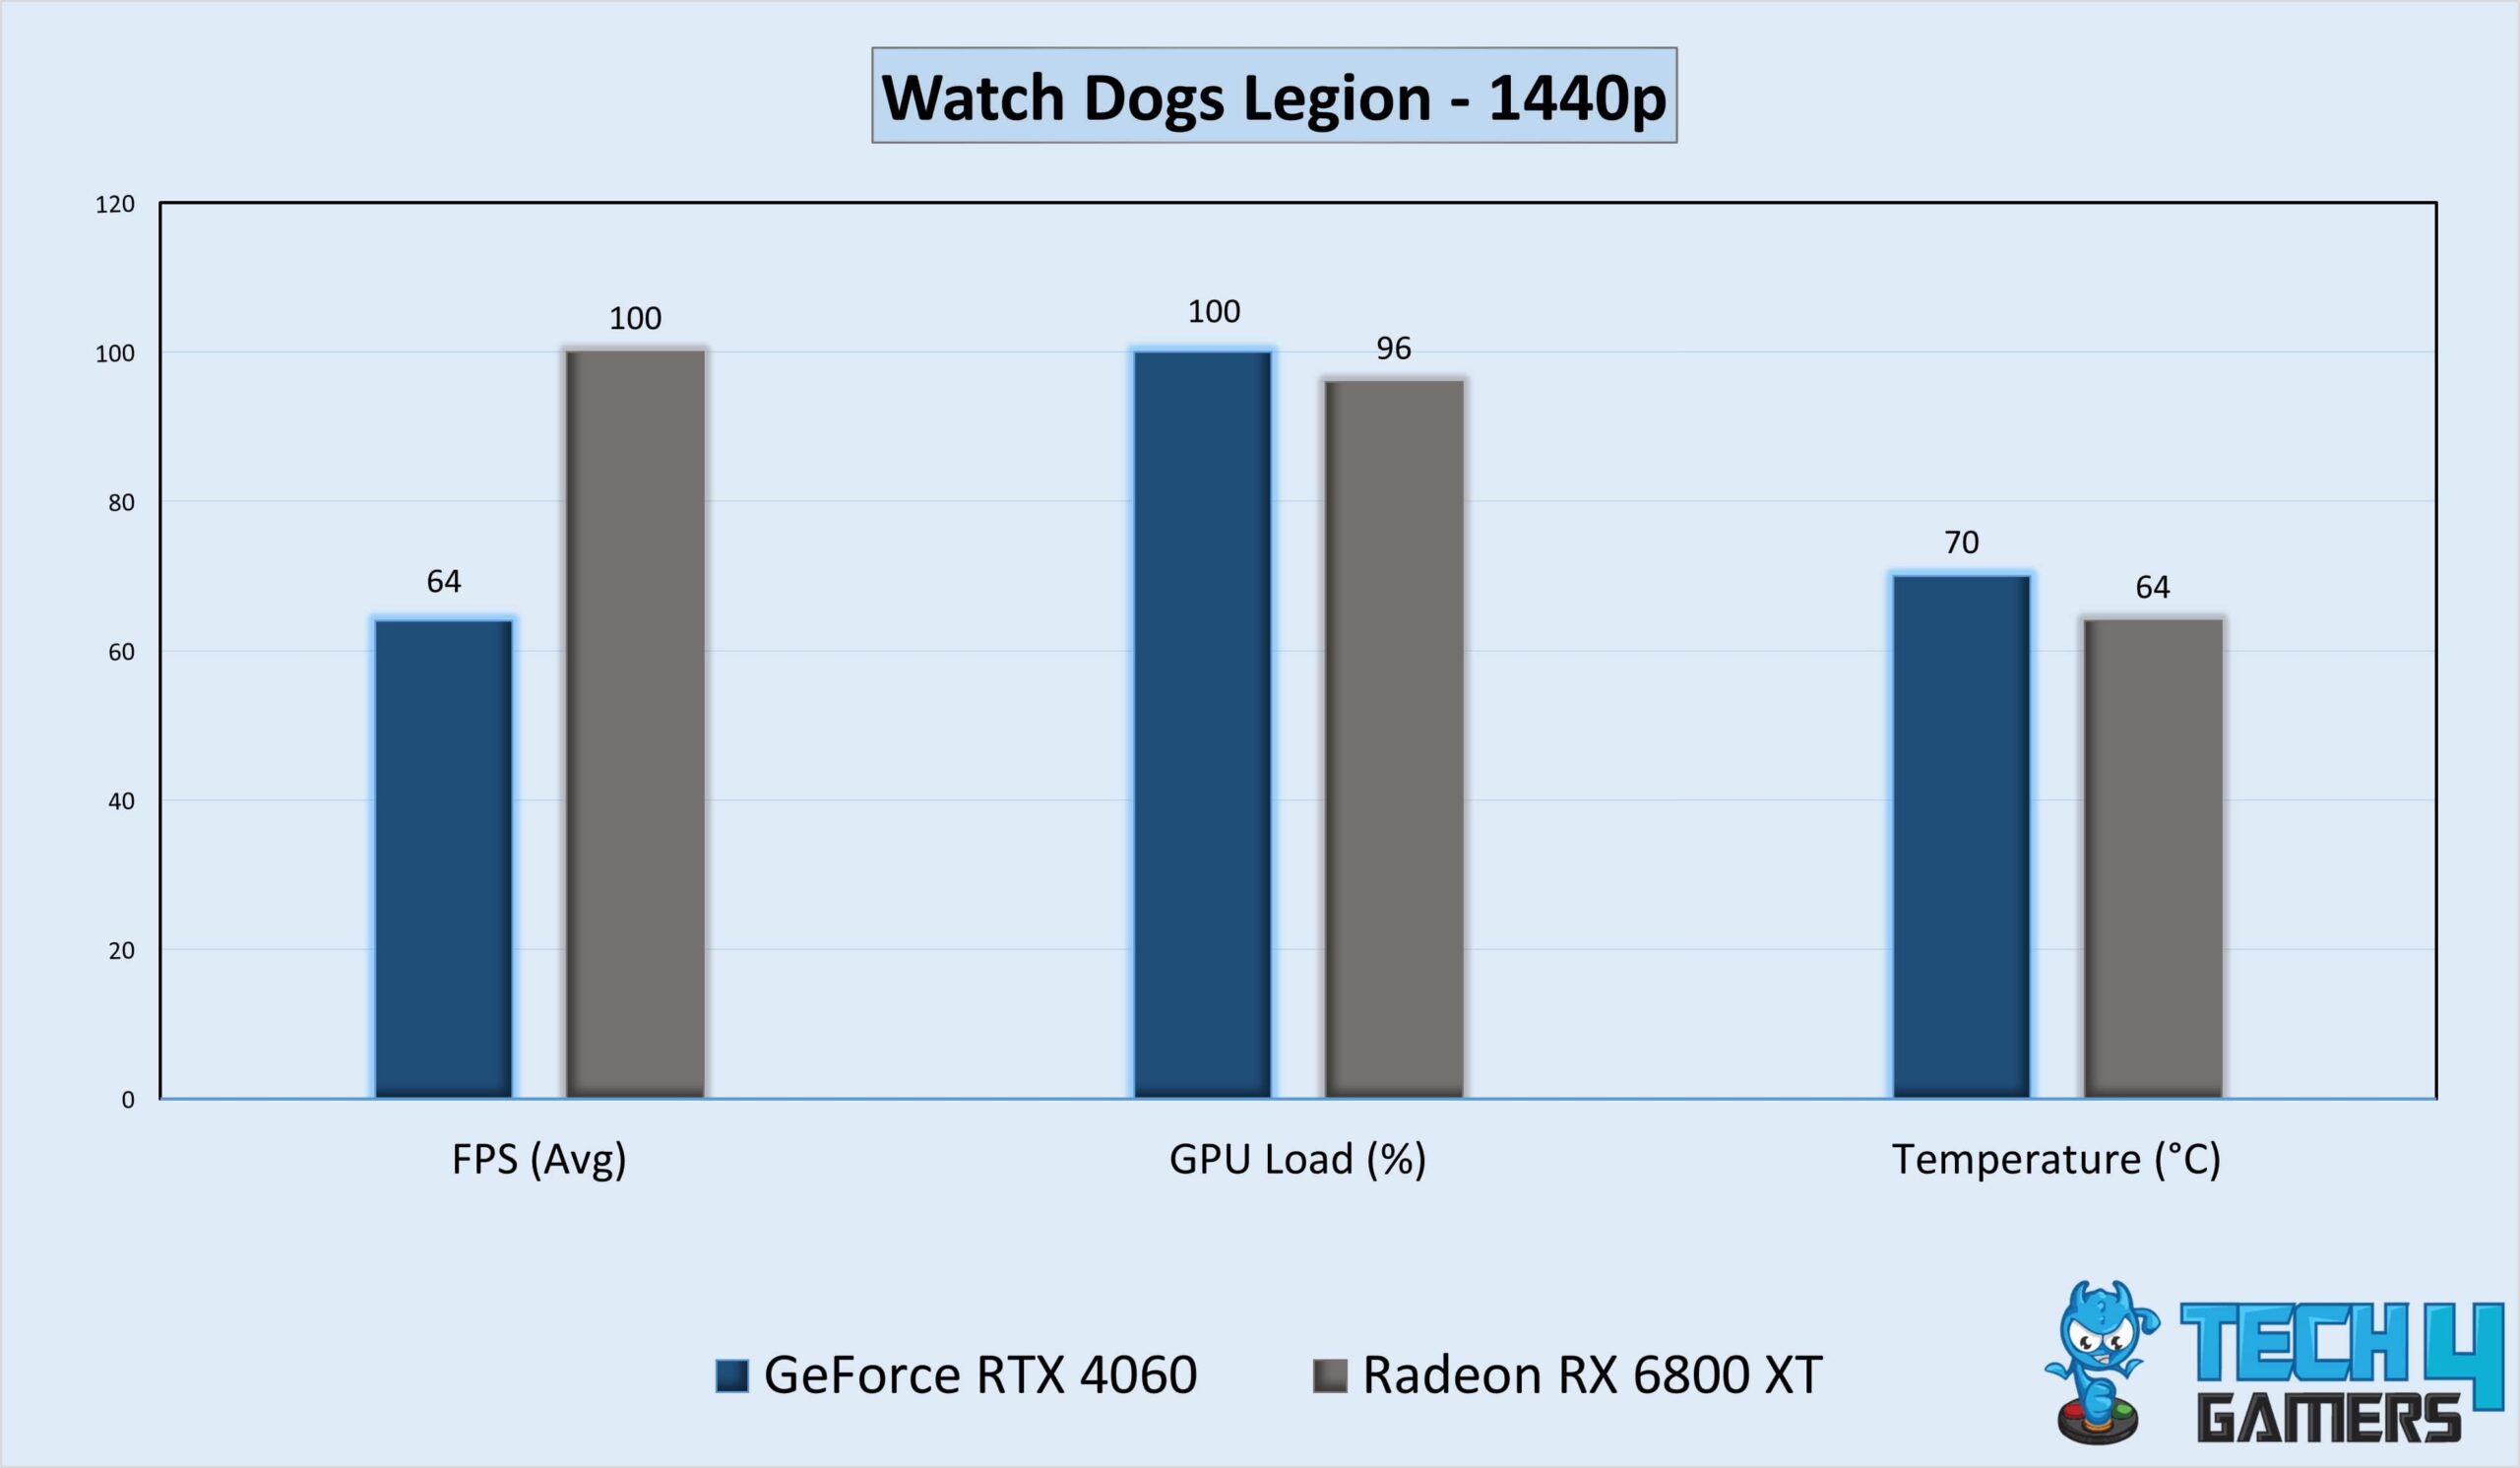
- In our last Watch Dogs Legion gameplay, the RX 6800 XT edged out the RTX 4060 by a strong 56% performance lead.
- The RTX 4060 struggled to reach an average of 64 FPS at 1440p, whereas the RX 6800 XT excelled with an admirable average of 100 FPS.
Overall Gaming Stats
Performance
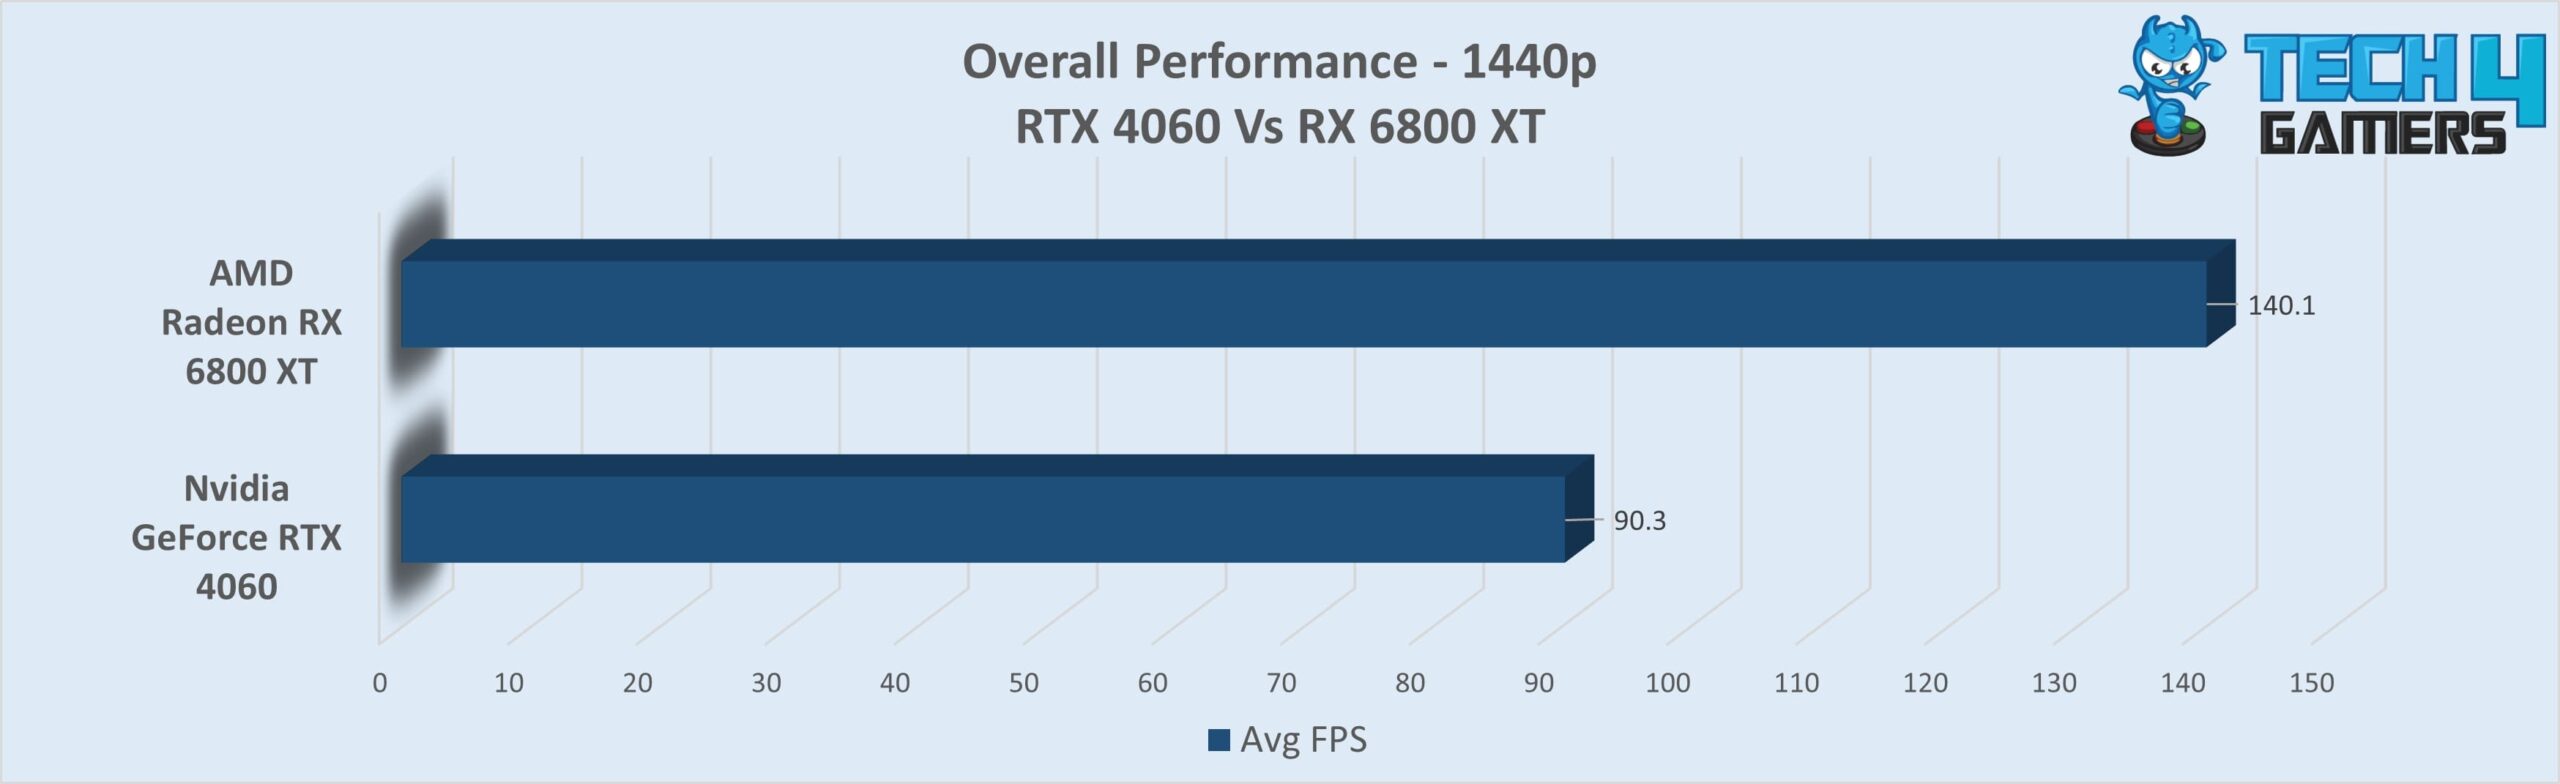
After analyzing the performance data from the mentioned games, we concluded that the RX 6800 XT outperforms the RTX 4060 with a remarkable 55% margin. Delivering an exceptional average frame rate of dazzling 140.1 FPS at 1440p in the seven games considered, the RX 6800 XT affirms its superiority over the RTX 4060, which averaged 90.3 FPS.
The RX 6800 XT outperforms the RTX 4060 in gaming with its superior average and low 1% frame rates, making it the clear choice for gamers.
Winner: GeForce RTX 4060
Thermal Efficiency
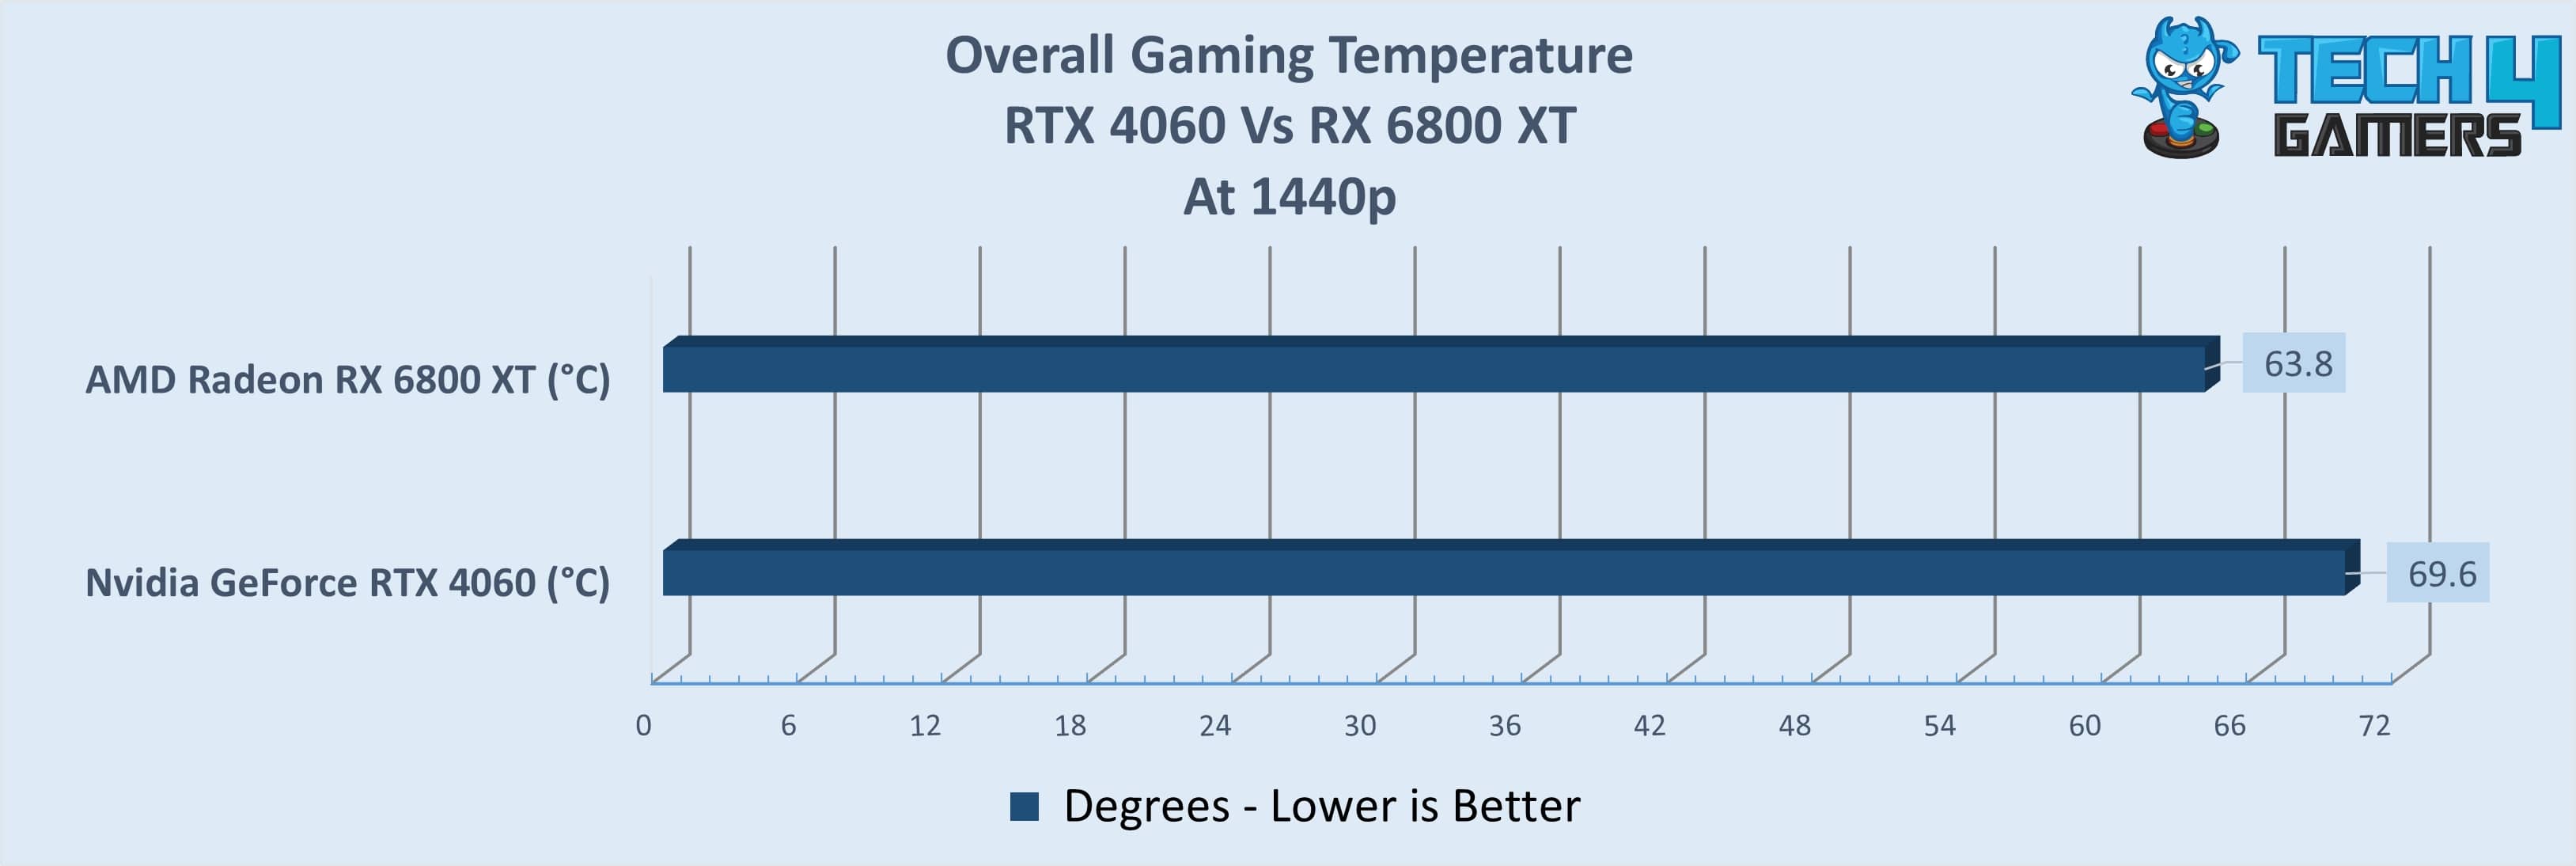
The RTX 4060 operated at an average temperature of 69.6°C, compared to the RX 6800 XT’s 63.8°C in the seven games above. Considering the gaming temperature, it can be concluded that the RX 6800 XT proves approximately 9.1% better thermal efficiency than the RTX 4060.
Winner: Radeon RX 6800 XT
Price And Availability
| GPU | Launch MSRP | Current Price |
|---|---|---|
| GeForce RTX 4060 | 💲299 | 💲289 |
| Radeon RX 6800 XT | 💲649 | 💲489 |
| Difference | 117% | 65.7% |
The RTX 4060 remains near its launch MSRP due to high demand and low pricing, while the RX 6800 XT’s price has dropped due to its age. Both GPUs are widely available: the RTX 4060 can be purchased from Nvidia’s official store, and the RX 6800 XT is accessible through online retailers such as Amazon and NewEgg.
Final Verdict – What Do We Recommend?
AMD Radeon RX 6800 XT: For those seeking an unparalleled gaming experience with exceptional performance and no budget constraints, the RX 6800 XT stands out as the apex choice over the RTX 4060. Its superior capabilities and features guarantee unparalleled gaming satisfaction and greater overall value.
Nvidia GeForce RTX 4060: The RTX 4060 boasts enhanced energy efficiency, thereby reducing electricity costs while delivering remarkable standalone performance. It’s also $200 cheaper than the RX 6800 XT.
Now that we have thoroughly examined the RTX 4060 vs RX 680 XT, the optimal GPU selection depends on your individual requirements and budgetary restrictions.
The RX 6800 XT is better for gaming due to its greater performance. The RX 6800 XT has double the VRM of the RTX 4060. Yes. If we see the TDP of these GPUs, the RTX 4060 has only 115W TDP, while the TDP of the RX 6800 XT is 300W. Moreover, the gaming power consumption of the RX 6800 XT is also higher than the RTX 4060. Indeed, both graphics cards can handle 4K gaming. Nevertheless, the RX 6800 XT performs better in specific scenarios owing to its higher TDP.Frequently Asked Questions
More From RTX 4060
More From RX 6800 XT
Thank you! Please share your positive feedback. 🔋
How could we improve this post? Please Help us. 😔
[Comparisons Expert]
Shehryar Khan, a seasoned PC hardware expert, brings over five years of extensive experience and a deep passion for the world of technology. With a love for building PCs and a genuine enthusiasm for exploring the latest advancements in components, his expertise shines through his work and dedication towards this field. Currently, Shehryar is rocking a custom loop setup for his built.
Get In Touch: shehryar@tech4gamers.com


