

In our last comparison, we saw AMD’s RX 7900 XT claim victory against NVIDIA’s RTX 3080 Ti in terms of performance. Today, we’re delving into the RX 6800 XT vs RTX 3080 Ti battle to see which one will dominate the market in terms of gaming prowess and other features.
Key Takeaways
- The Radeon RX 6800 XT relies on the older RDNA 2.0 architecture, whereas the GeForce RTX 3080 Ti is powered by NVIDIA’s more recent Ampere design.
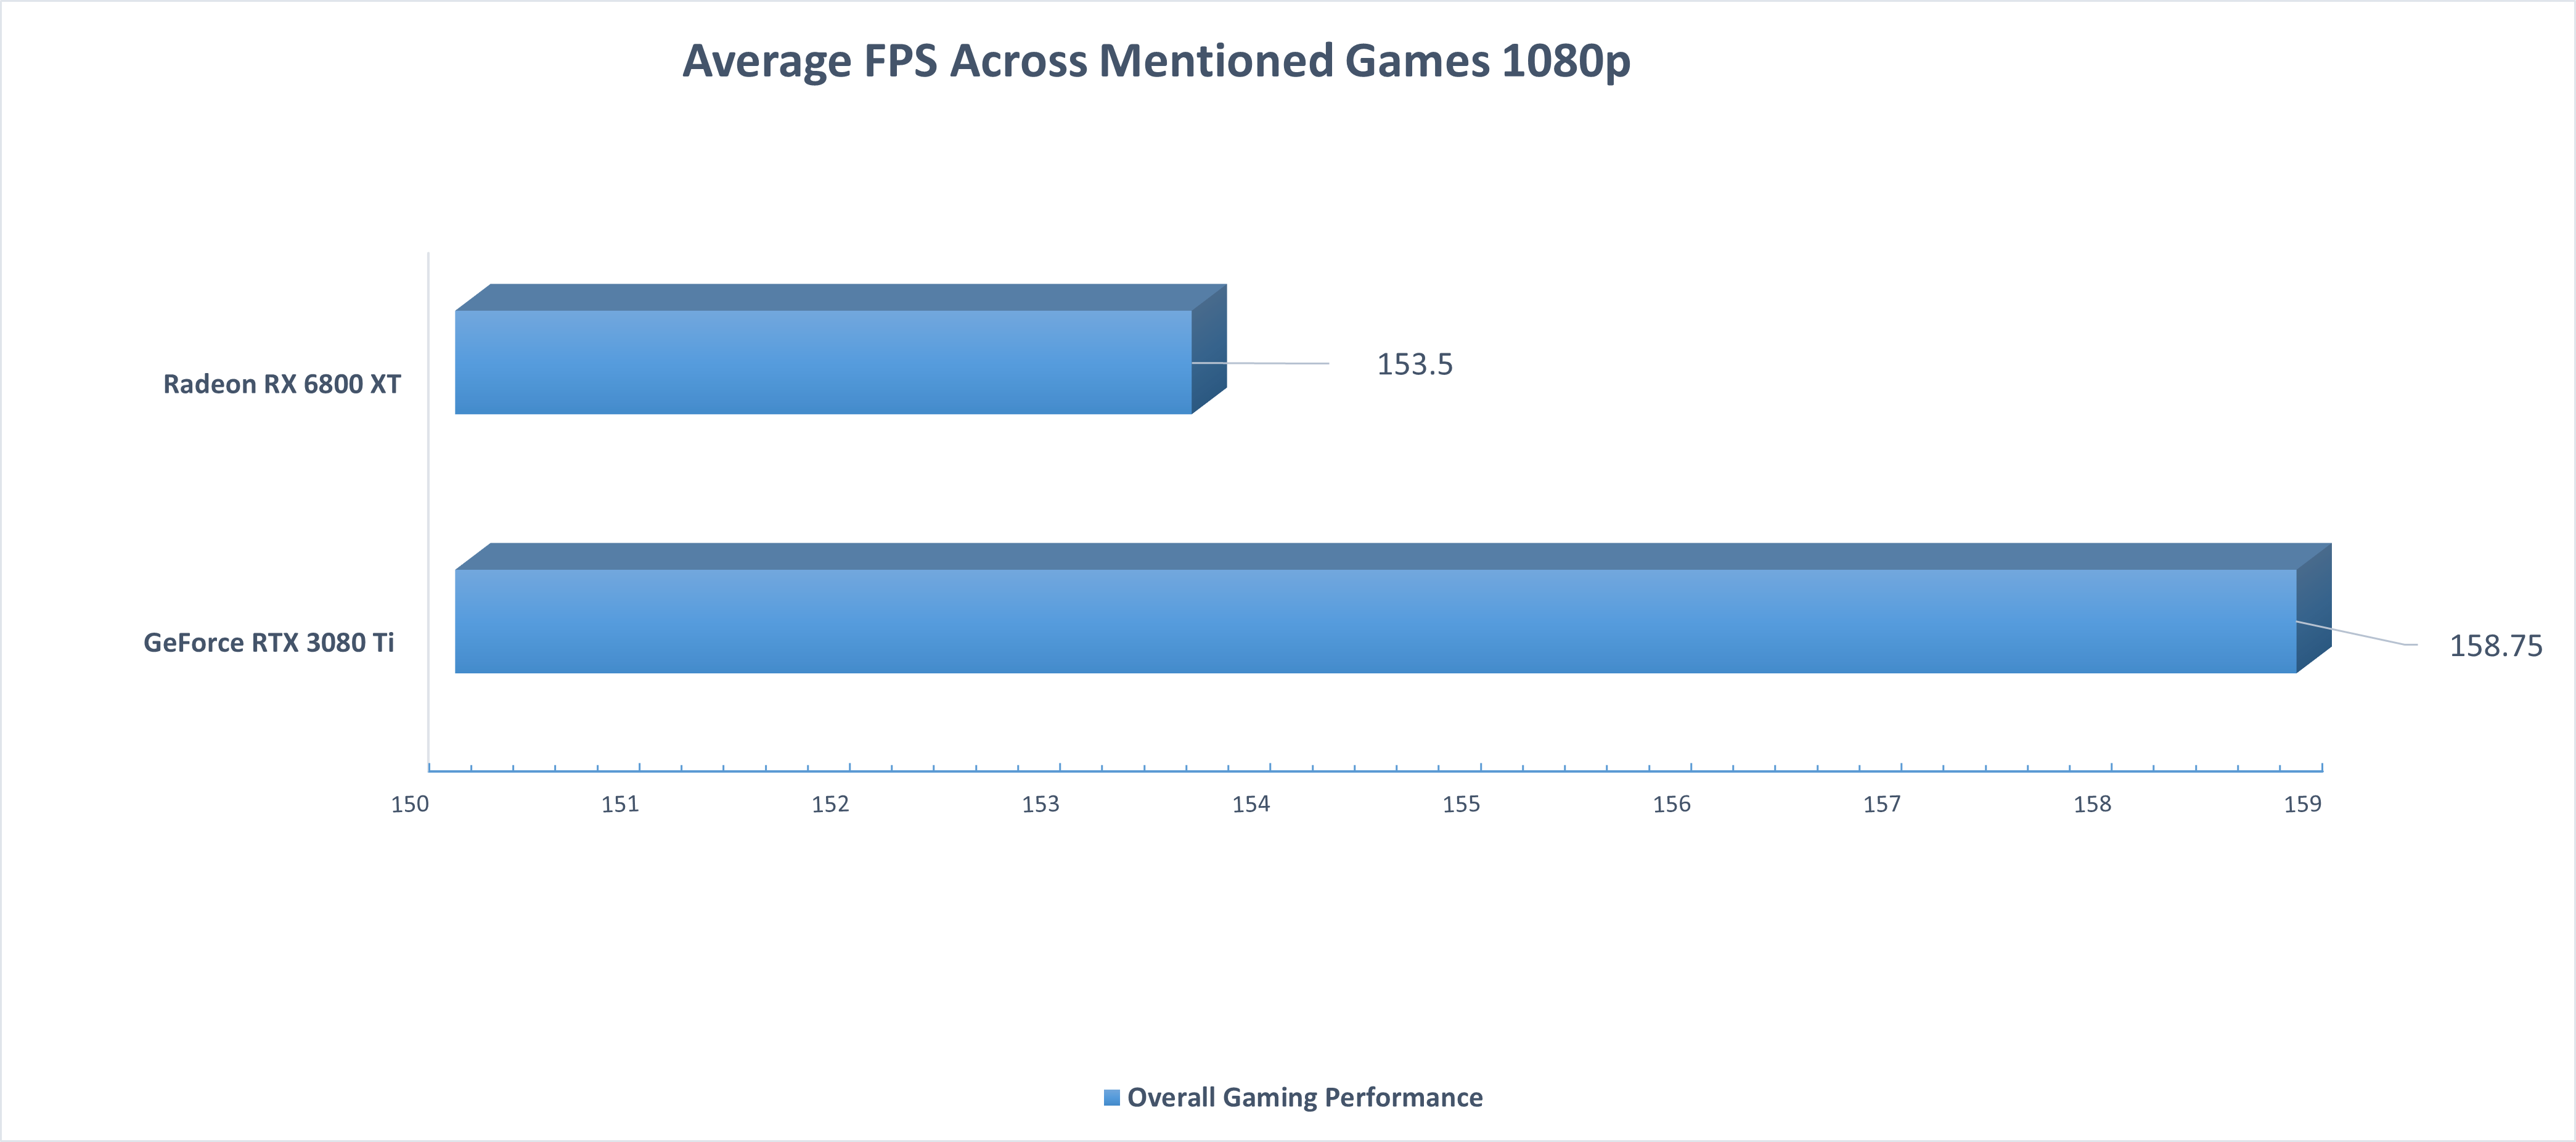
- Based on our in-depth testing, the GeForce RTX 3080 Ti showcases better gaming performance than the Radeon RX 6800 XT. We observed a 3.3% increase in average FPS at 1080p when comparing the two GPUs.
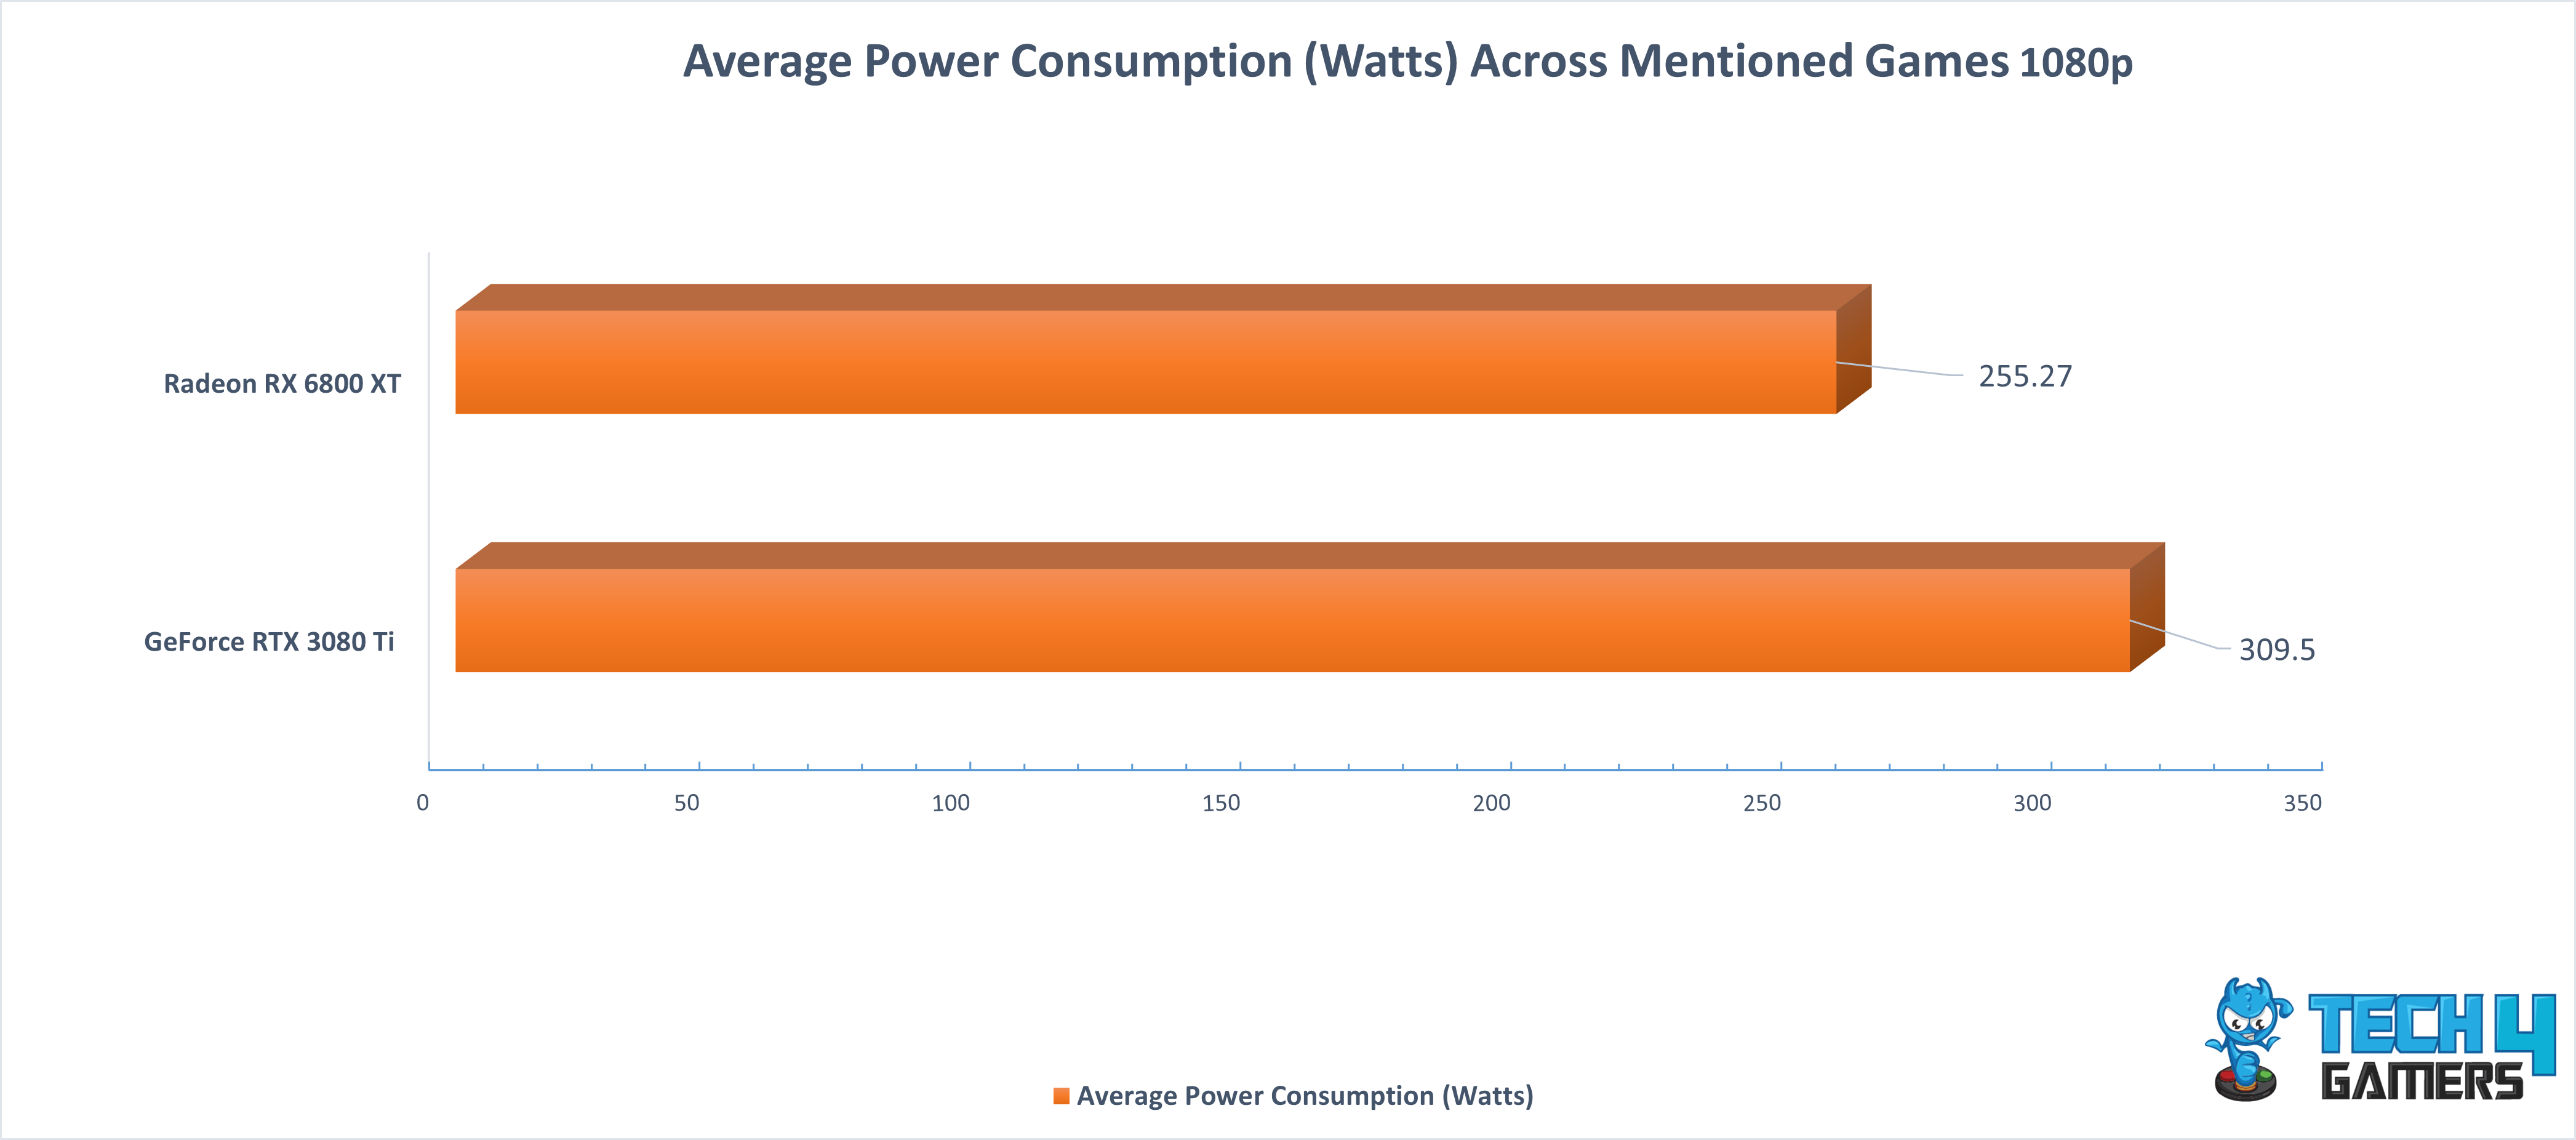
- Radeon RX 6800 XT is more power efficient, delivering 19.2% power efficiency at 1080p, respectively, compared to the GeForce RTX 3080 Ti.
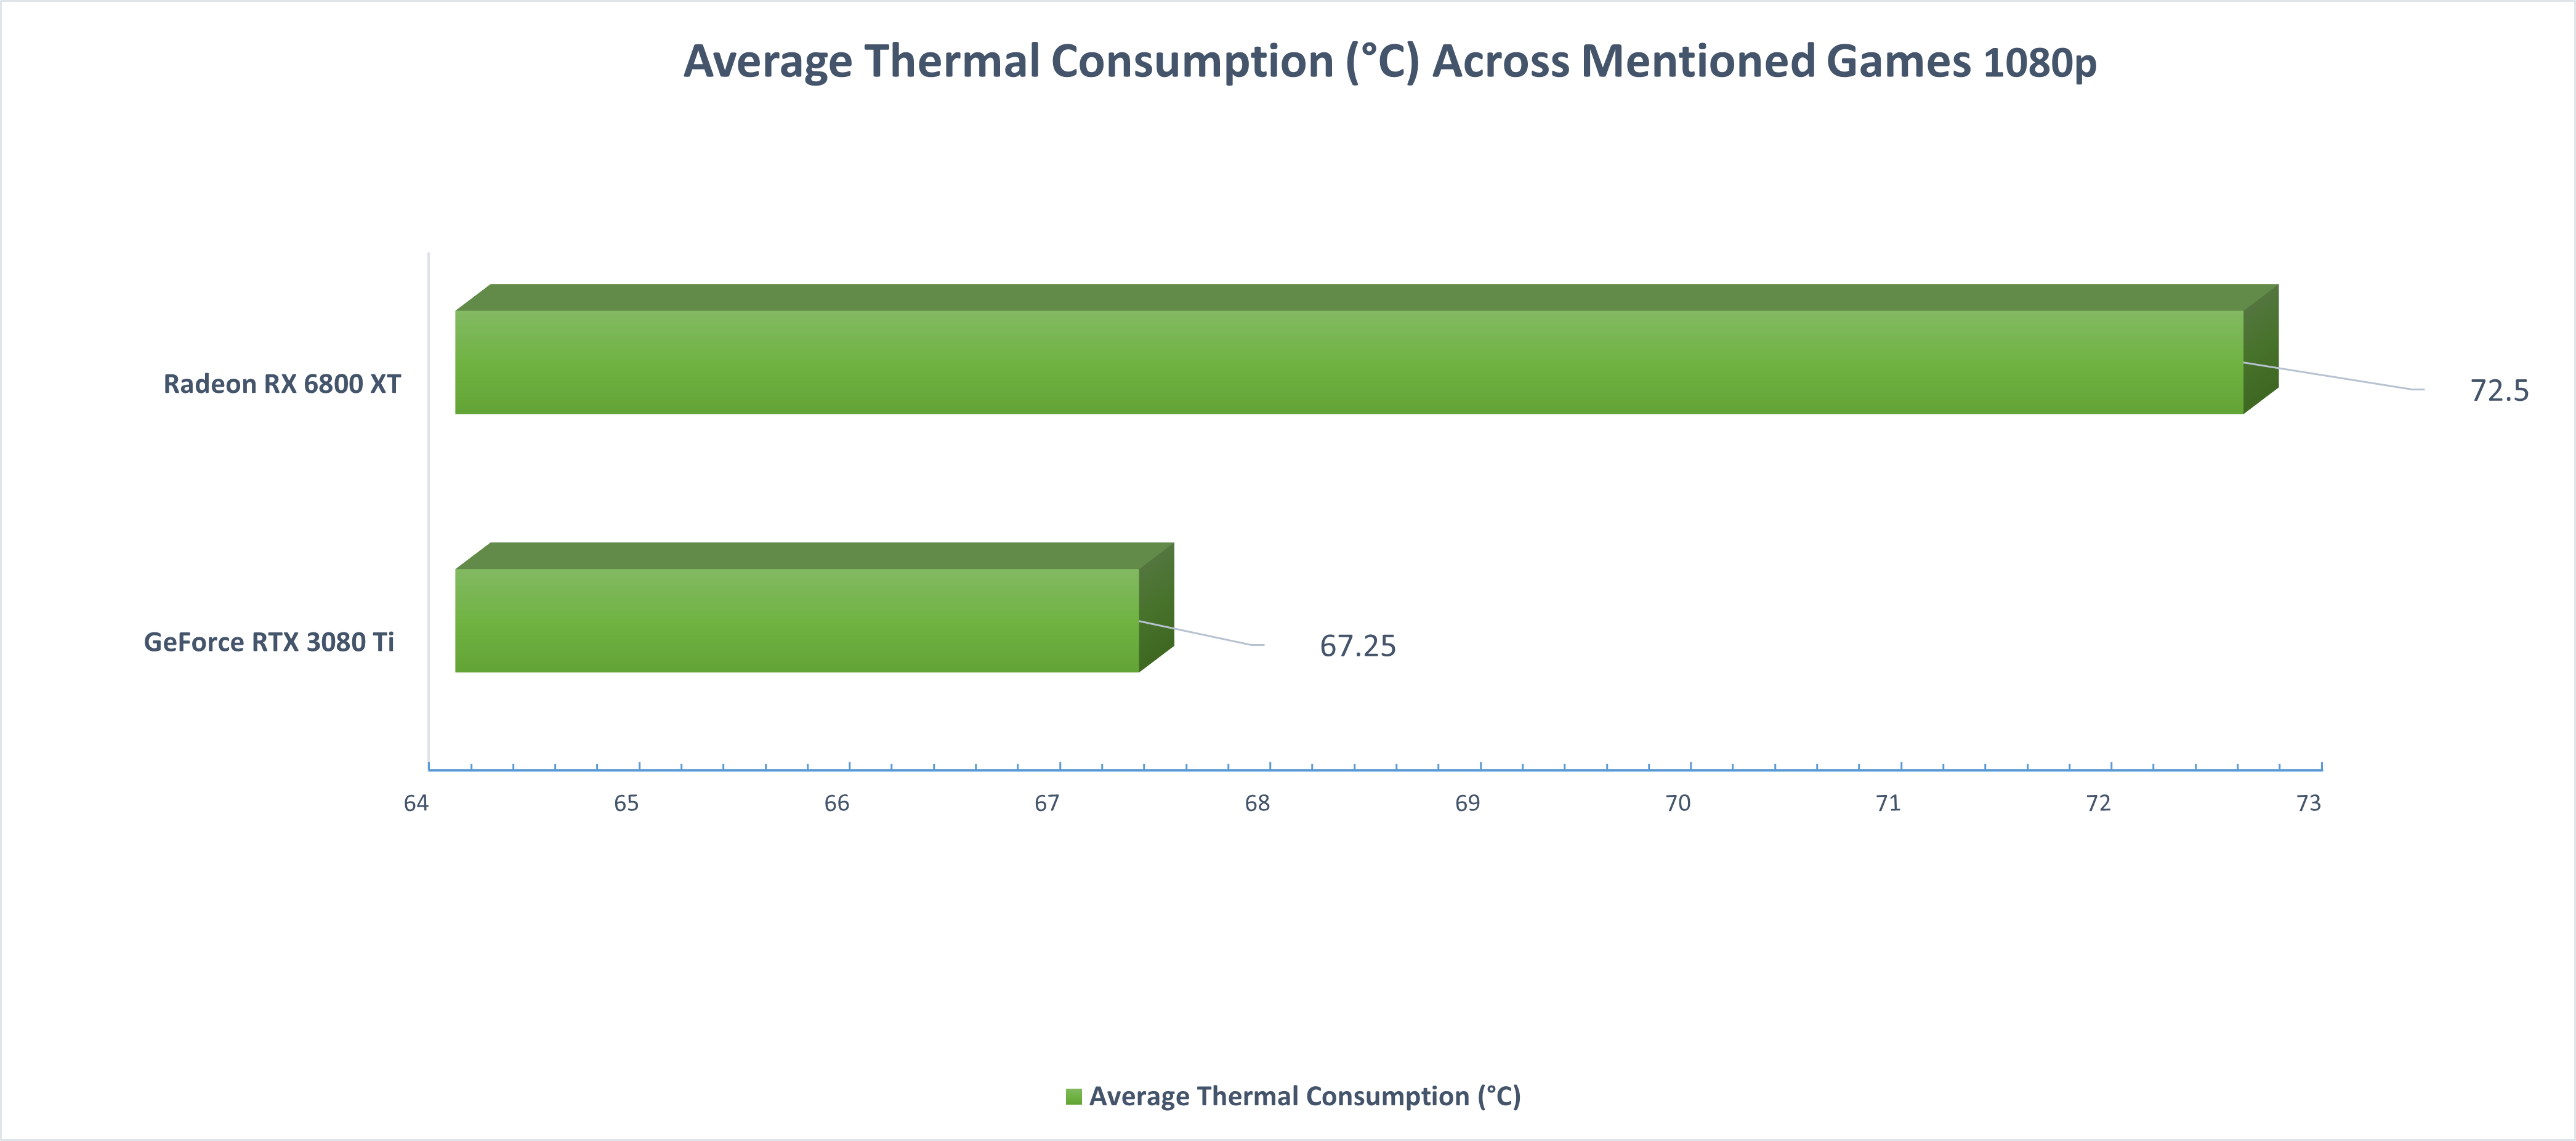
- Our testing results reveal that the GeForce RTX 3080 exhibits superior thermal efficiency compared to the Radeon RX 6800 XT. Specifically, we observed a 7.5% improvement in thermal efficiency at 1080p.
Comparison Table
| Technical Specs | GeForce RTX 3080 Ti | Radeon RX 6800 XT |
| GPU Name | GA102 | Navi 21 |
| Architecture | Ampere | RDNA 2.0 |
| Transistors | 28,300 million | 26,800 million |
| Shading Units | 10240 | 4608 |
| Tensor Cores | 320 | NA |
| RT Cores | 80 | 72 |
| TMUs | 320 | 288 |
| ROPs | 112 | 128 |
| L1 Cache | 128 KB (per SM) | 128 KB per Array |
| L2 Cache | 6 MB | 4 MB |
| Memory Bus Width | 384 bit | 256 bit |
| Memory Bandwidth | 912.4 GB/s | 512.0 GB/s |
| Suggested PSU | 750W | 700W |
| Release Date | May 31st, 2021 | Oct 28th, 2020 |
| Approximated Price | 1000 USD | 500 USD |
| Best Variants | Best RTX 3080 Ti Cards | Best RX 6800 XT Cards |
Architectural Differences
- Process Node: The RTX 3080 Ti utilizes an 8nm process node, while the RX 6800 XT relies on a 7nm process node.
- Clock Speed: The RTX 3080 Ti boasts a base clock of 1365 MHz and a boost clock of 1665 MHz, while the RX 6800 XT features a base clock of 1825 MHz and a boost clock of 2250 MHz.
- VRAM: In terms of VRAM, the RTX 3080 Ti offers 12GB of GDDR6X VRAM, whereas the RX 6800 XT provides 16GB of GDDR6 VRAM.
- TDP: The RTX 3080 Ti comes with a 350W TDP, while the RX 6800 XT features a 300W TDP showcasing different power efficiency and requirements.
- Supported Technologies: Furthermore, the RTX 3080 Ti supports DLSS (Deep Learning Super Sampling), while the RX 6800 XT utilizes FSR (FidelityFX Super Resolution) for AI-enhanced graphics and performance optimization.
RX 6800 XT Vs RTX 3080 Ti: Gaming Benchmarks
Now that we have covered the differences, it’s time to see how these graphics cards perform in popular games and which one comes out on top. We’ll be putting the RX 6800 XT and the GeForce RTX 3080 Ti to the test in real-world gaming scenarios.
Testing Rig
The following specs have been used in the testing rig.
- OS: Windows 11
- CPU: Intel Core i7-13700K
- Motherboards: ASRock Z790 Taichi Lite Motherboard
- RAM: Kingston Fury Renegade RGB DDR5 32GB 7200MHz
- SSD: XPG GAMMIX S70 BLADE 2TB NVMe SSD
- PSU: Enermax Revolution D.F. X 1050W
- CPU Cooler: MSI MAG CORELIQUID E360 CPU Liquid Cooler
Note: It’s worth noting that benchmark tests are not always a perfect representation of real-world performance. The results can be influenced by a variety of factors, including ambient temperature, system configurations, and the presence of background software.
Forza Horizon 5
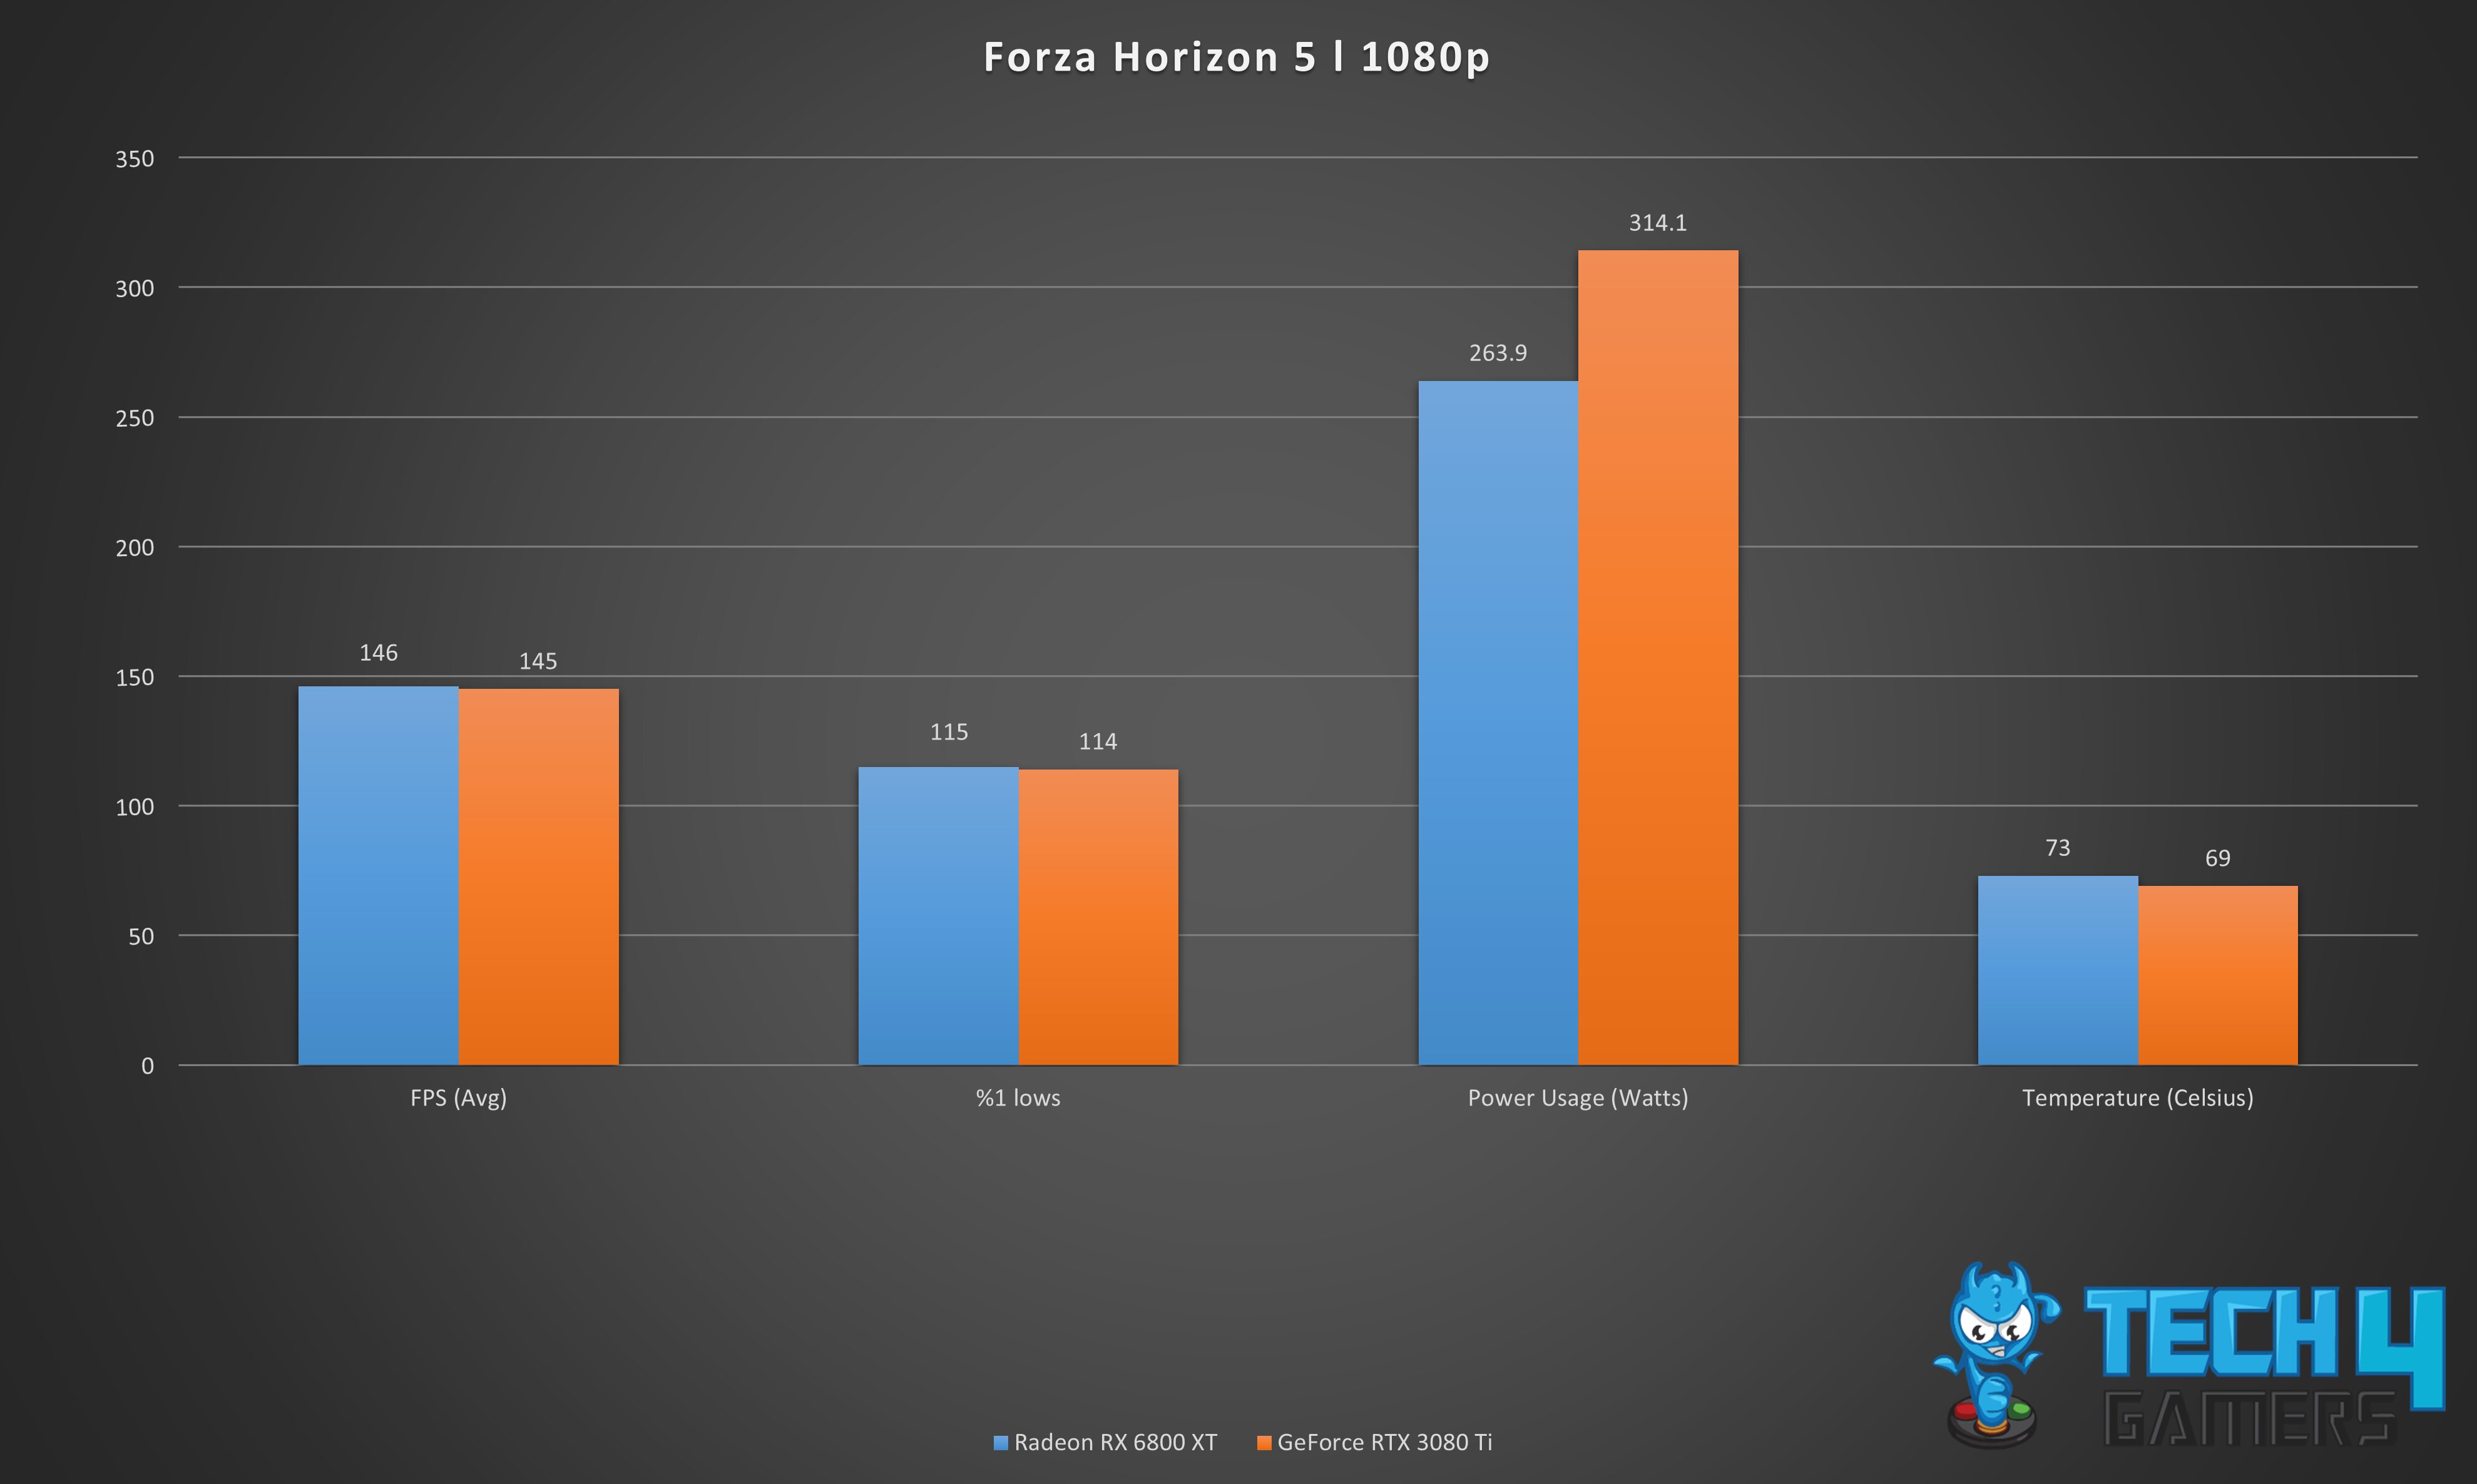
- In our benchmarks, the RTX 3080 Ti closely competes with the RX 6800 XT, delivering a nearly identical performance. The RTX 3080 Ti achieved an average FPS of 145, which is only 0.6% lower than the RX 6800 XT’s 146 FPS.
- In addition, the RTX 3080 Ti again comes behind the RX 6800 XT with its 1% lows at 114 FPS, demonstrating a 0.8% decrease in performance compared to the RX 6800 XT’s 115 FPS.
- In our testing, we found that the RX 6800 XT consumes significantly less power compared to the RTX 3080 Ti, with a power draw that is 17.3% lower. The RX 6800 XT drew only 263.9 watts, while the RTX 3080 Ti consumed 314.1 watts.
- The RX 6800 XT has a higher average temperature of 73°C compared to the RTX 3080 Ti’s 69°C, which is 5.6% or 4°C higher.
Assassin’s Creed Valhalla
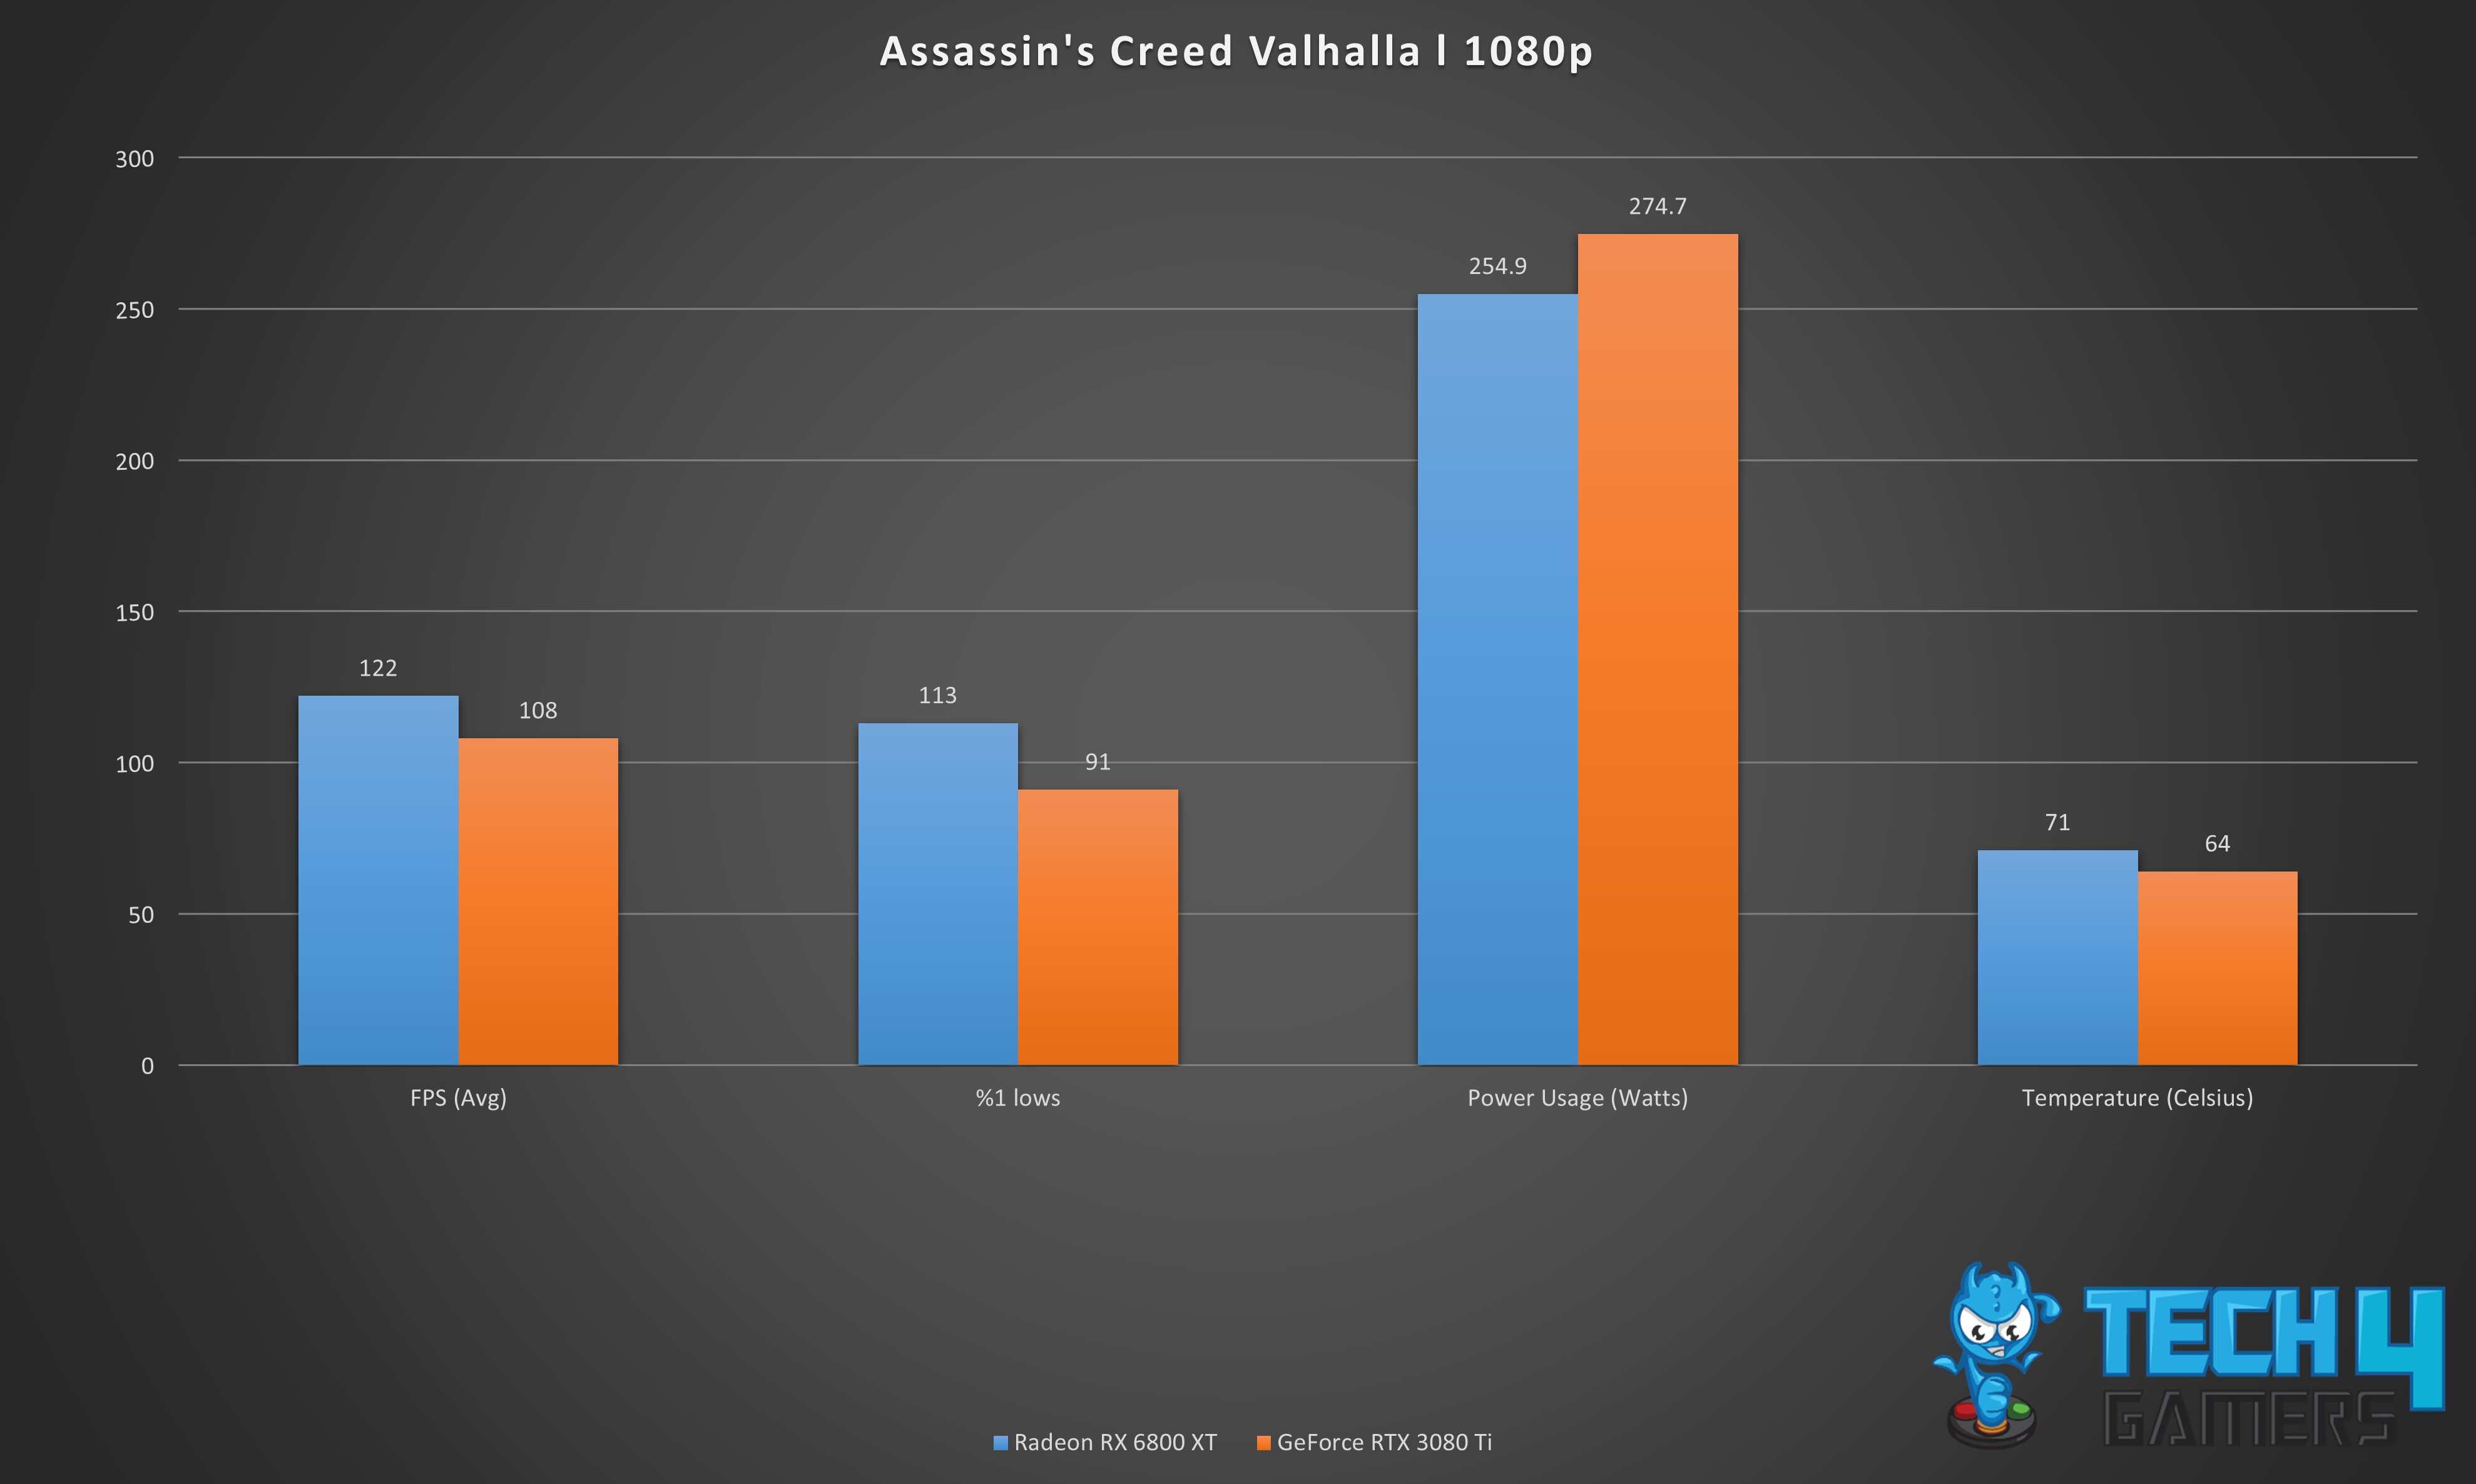
- While the RX 6800 XT produces an average of 122 FPS, it falls ahead of the RTX 3080 Ti’s outstanding performance boost of 12.1% and an average FPS of 108.
- In our own testing, we found that when it comes to 1% lows, the RTX 3080 Ti lags behind the RX 6800 XT. The RTX 3080 Ti averaged 91 FPS for 1% lows, which is 21.5% lower than the RX 6800 XT’s 113 FPS.
- While benchmarking, we observed that the RTX 3080 Ti consumes more power than the RX 6800 XT, with a difference of 7.4%. The RTX 3080 Ti drew 274.7 watts of power compared to the RX 6800 XT’s 254.9 watts.
- Despite being outperformed, the RTX 3080 Ti maintains better temperature management with an average temperature of 64°C compared to the RX 6800 XT’s 71°C, which is 10.3% or 7°C higher.
God of War
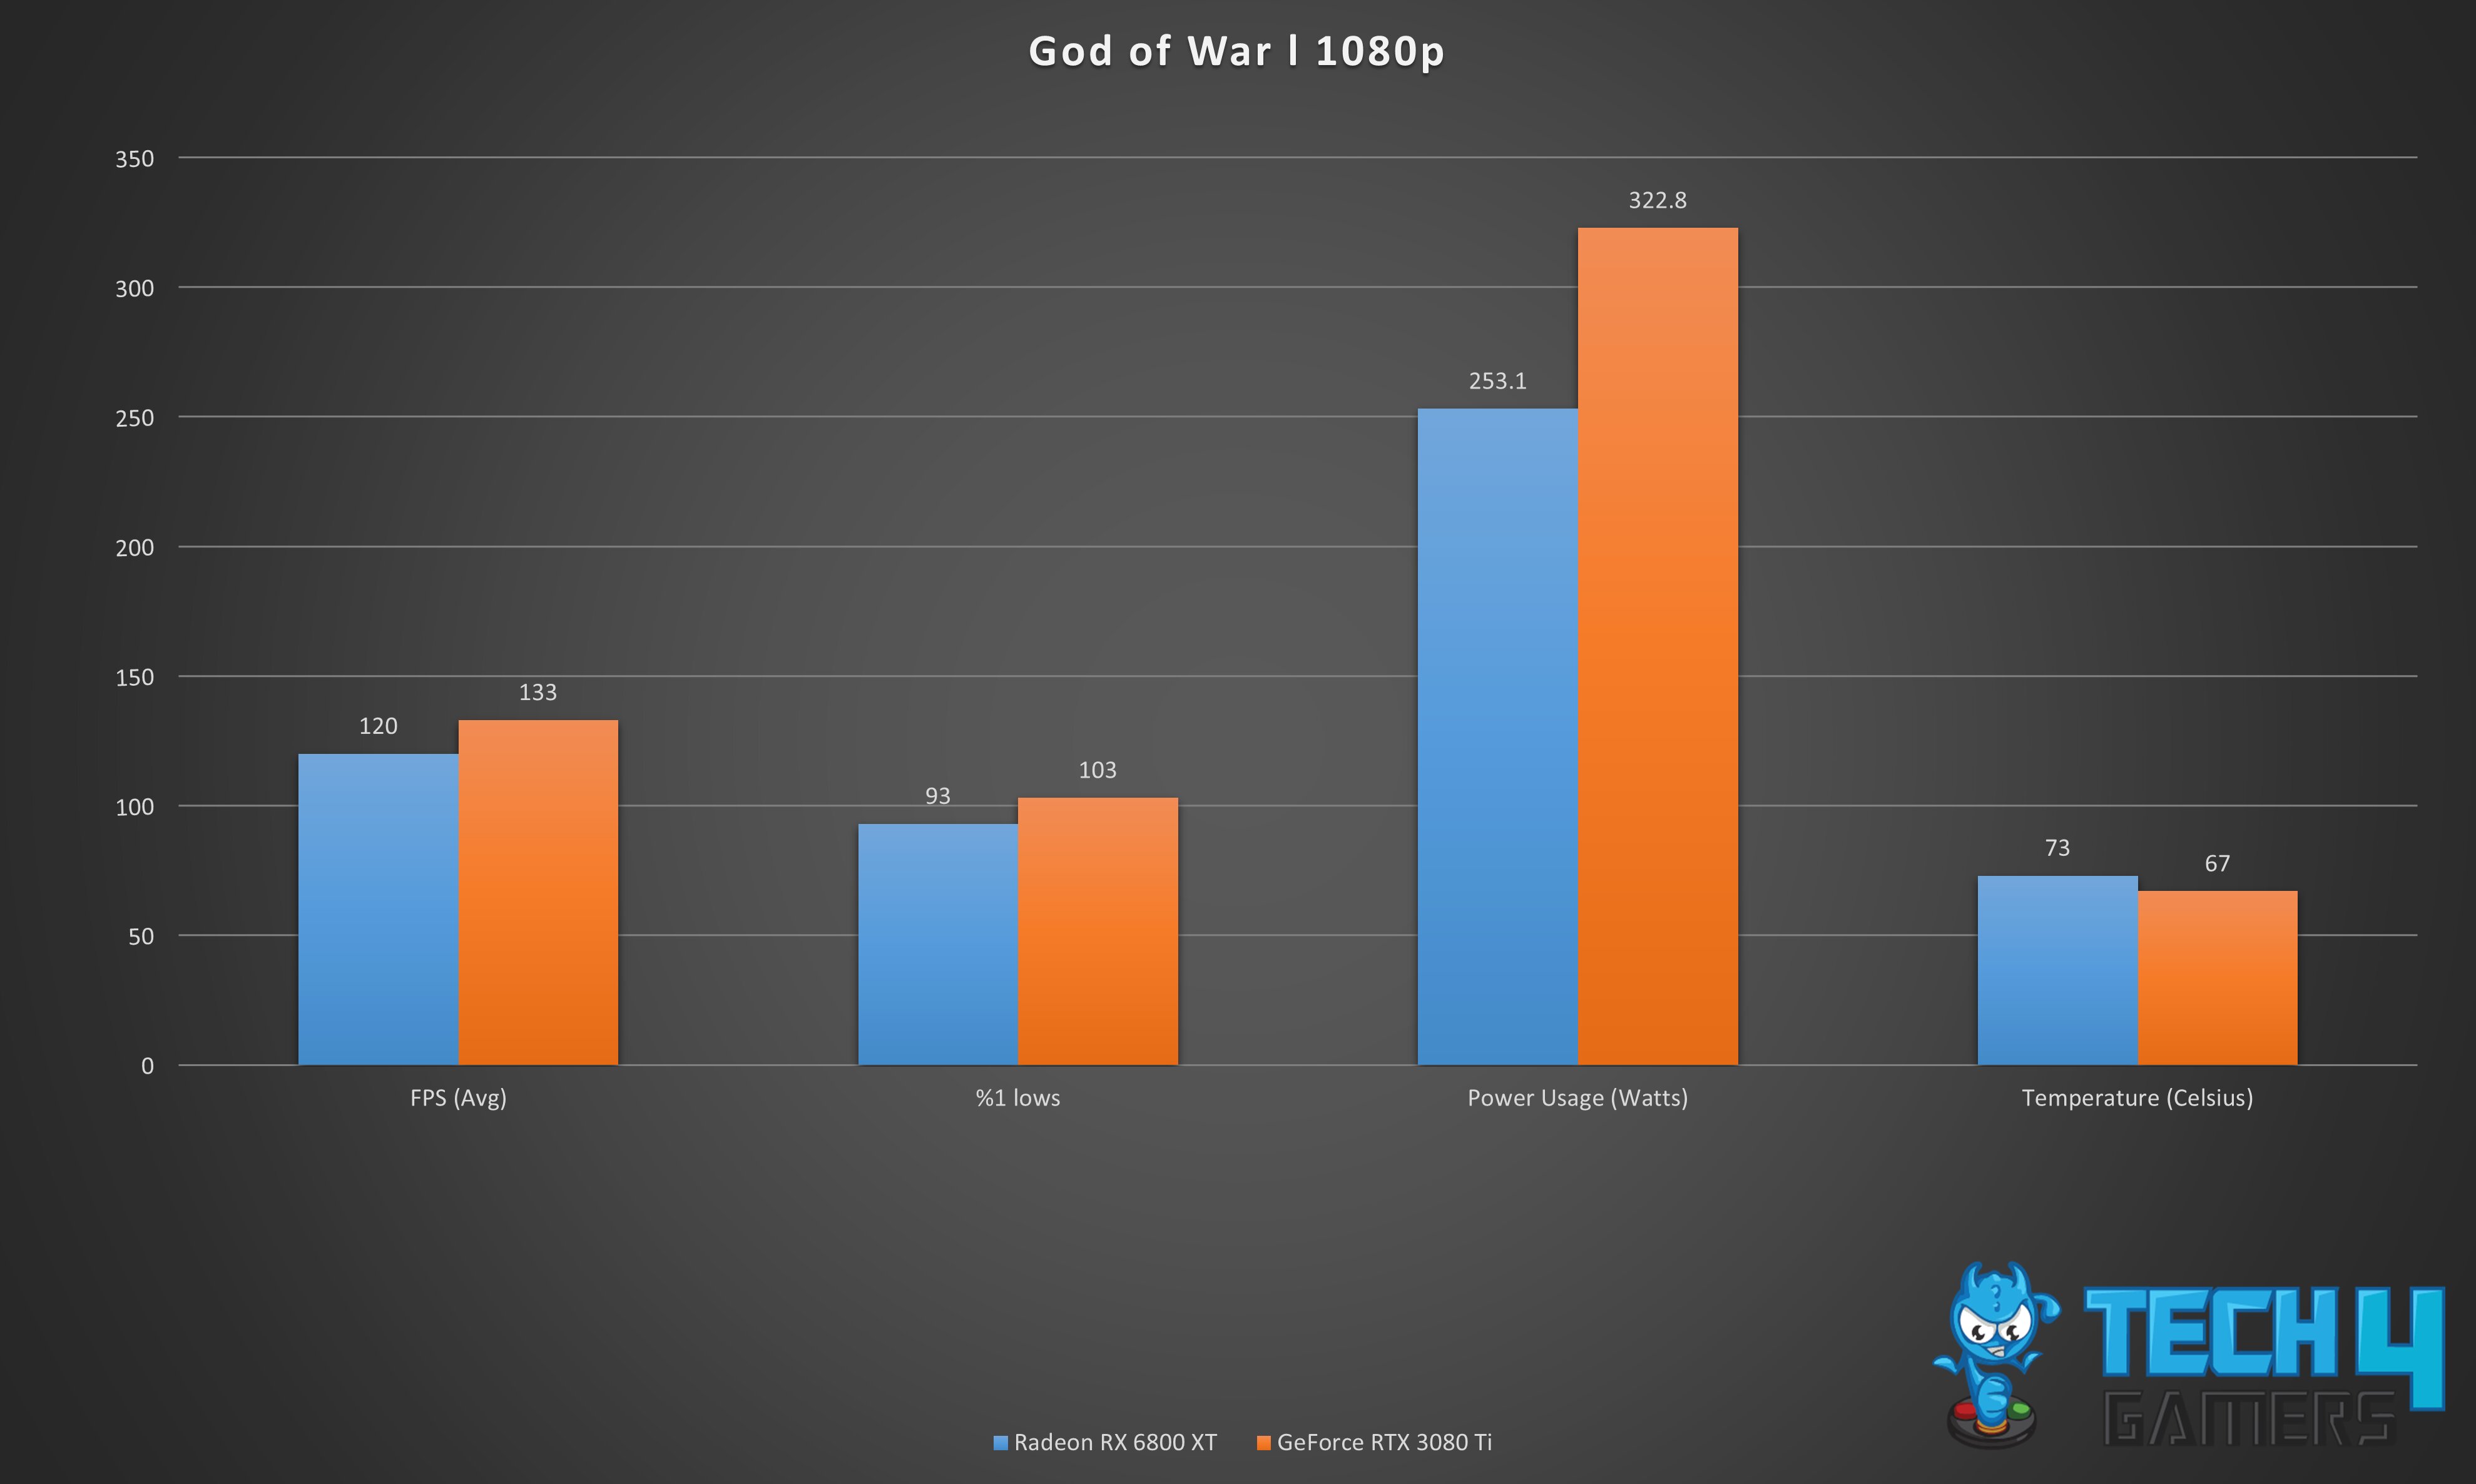
- According to our results, with an average FPS of 133 and an impressive 10.2% performance boost, the RTX 3080 Ti beats the RX 6800 XT, which lags behind at 120 FPS.
- With an average of 103 FPS, the RTX 3080 Ti showcases exceptional 1% lows performance, giving it a 10.2% performance advantage over the RX 6800 XT’s 93 FPS.
- Based on our tests, the RX 6800 XT performs admirably against the RTX 3080 Ti, and it does so with a significantly lower power draw. The RX 6800 XT consumed 24.2% less power at 253.1 watts compared to the RTX 3080 Ti’s 322.8 watts.
- The RX 6800 XT’s average temperature is 73°C, which is higher than the RTX 3080 Ti’s 67°C, showcasing a difference of 6°C or 8.5%.
Hitman 3
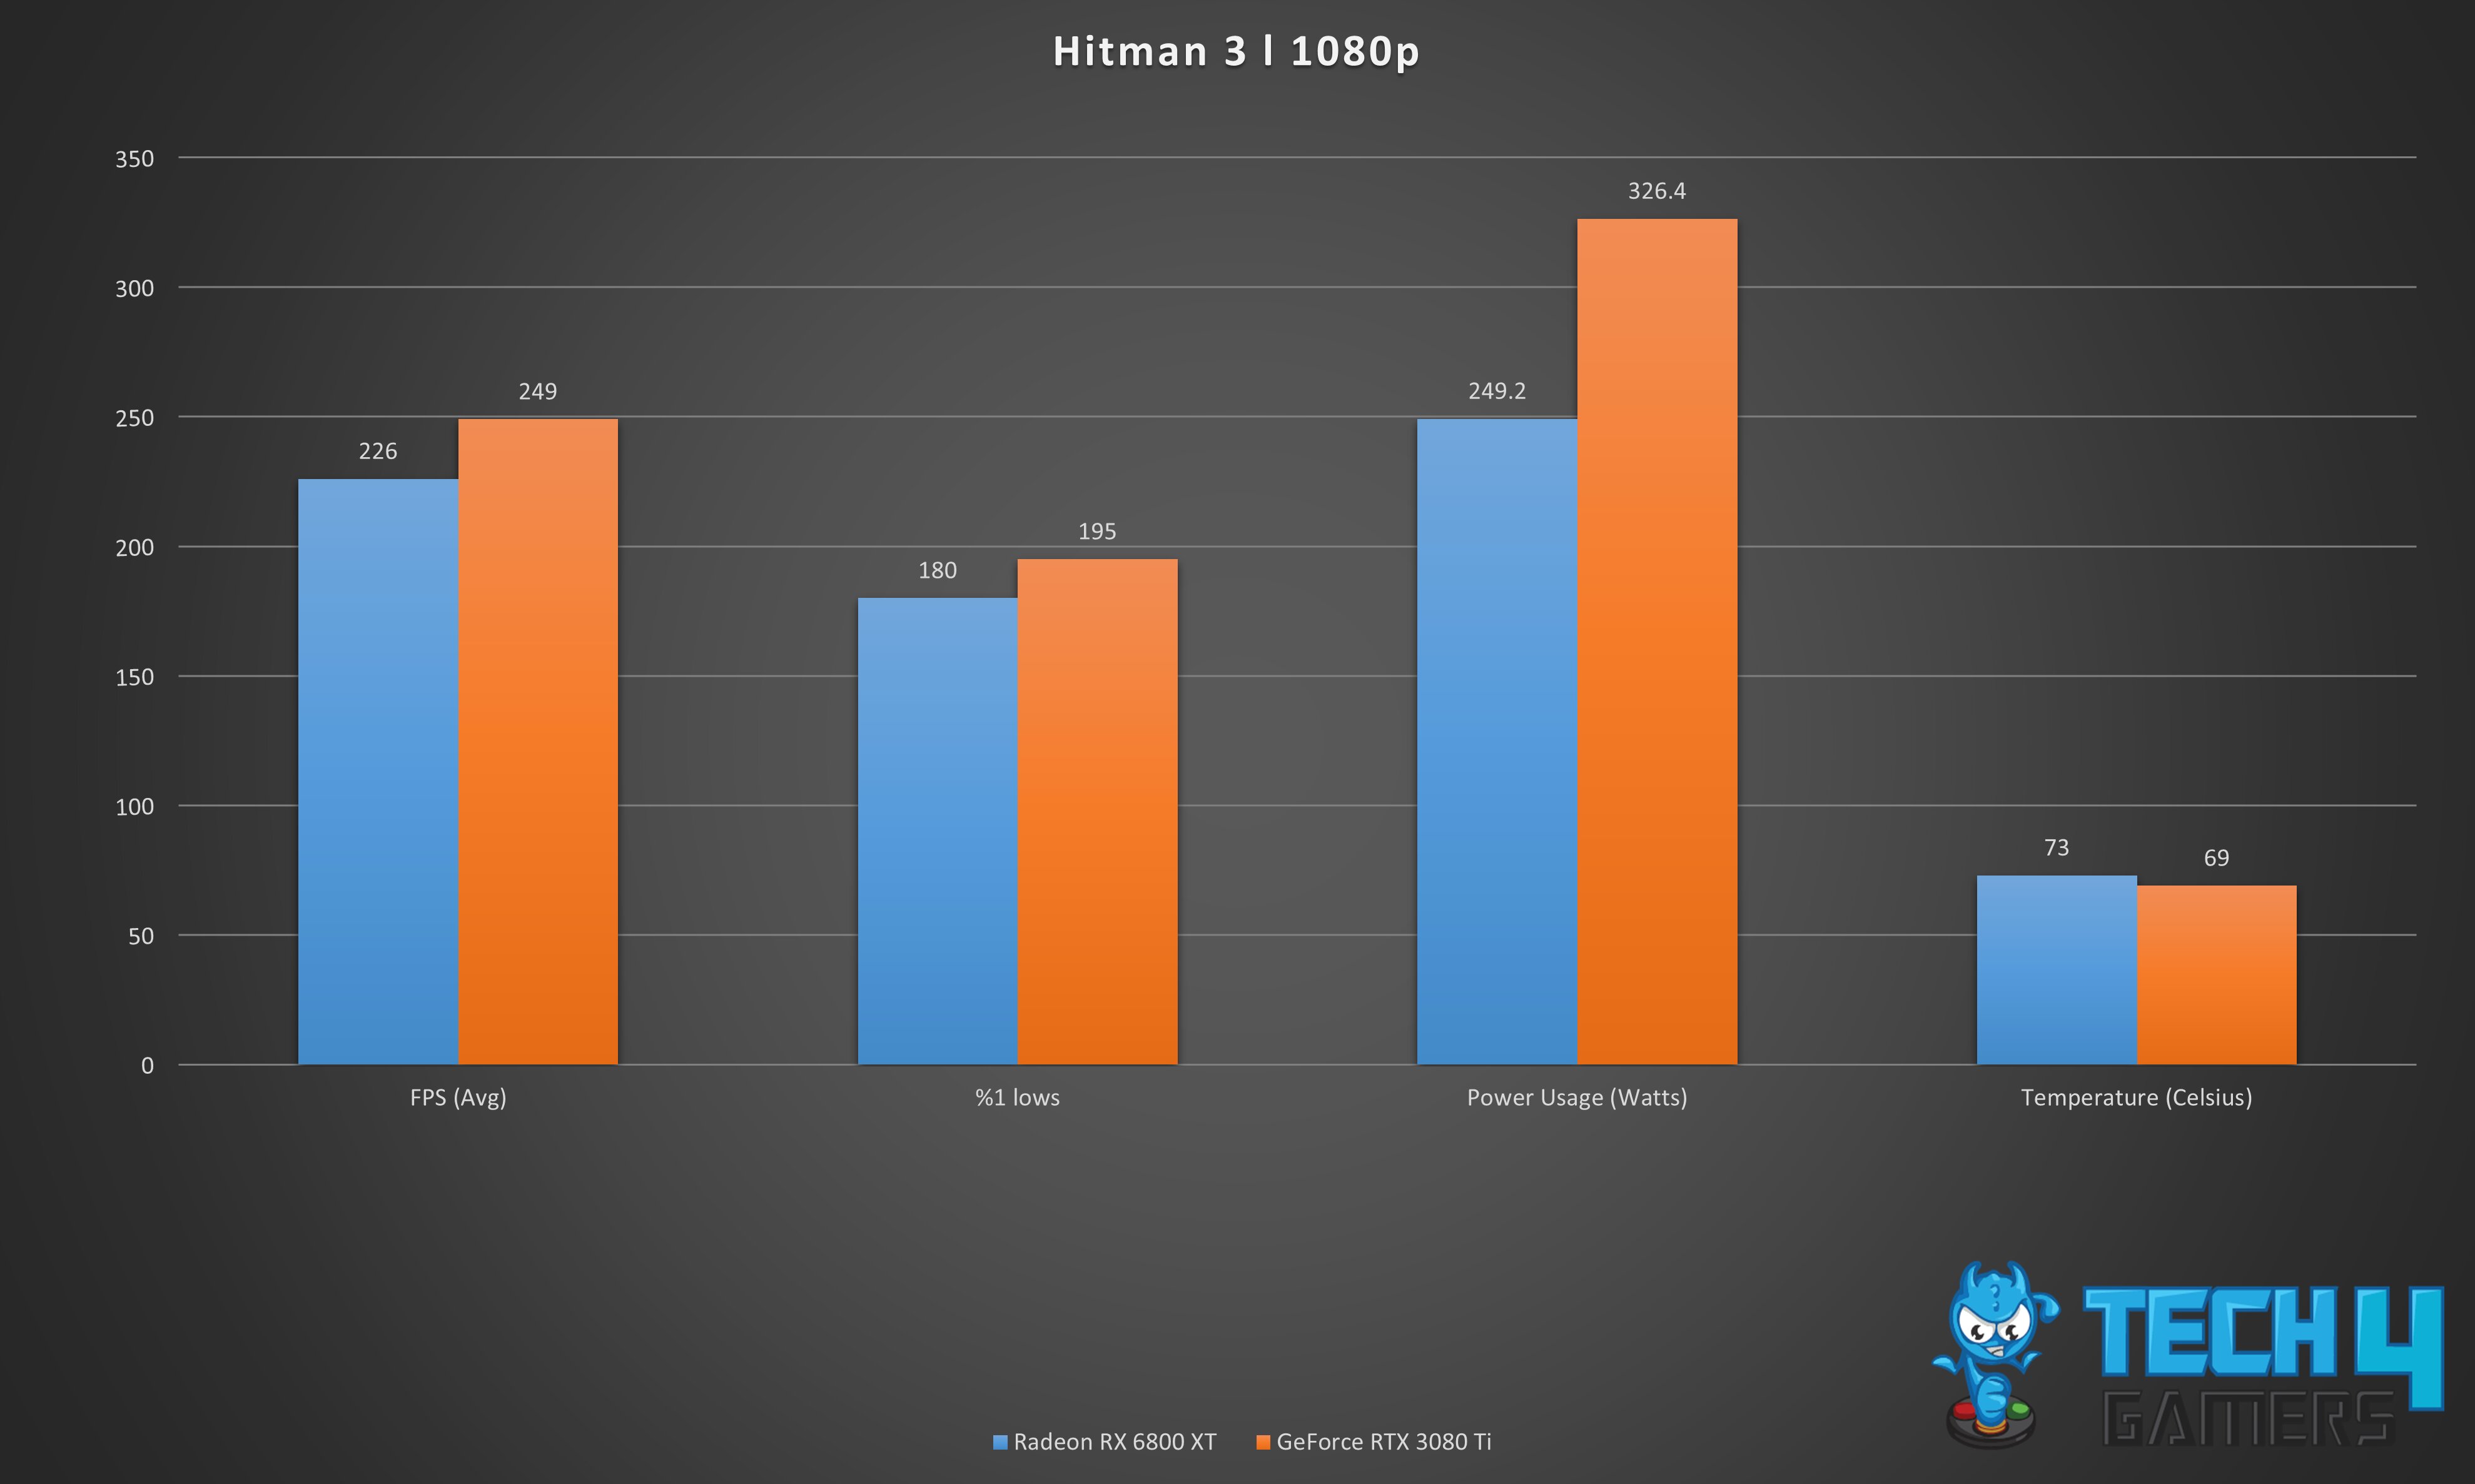
- The RTX 3080 Ti takes the lead with a stunning 9.7% performance boost and an average FPS of 249, while the RX 6800 XT trails behind at 226 FPS.
- The RX 6800 XT falls short of the RTX 3080 Ti in terms of 1% lows, with an average of 180 FPS, while the latter delivers impressive performance with 195 FPS, an 8% increase over the RX 6800 XT.
- In our examinations, it’s evident that the RTX 3080 Ti outperforms the RX 6800 XT, but it comes at a cost in terms of power consumption. The RTX 3080 Ti draws 26.8% more power, consuming 326.4 watts compared to the RX 6800 XT’s 249.2 watts.
- Moreover, the RTX 3080 Ti exhibits superior temperature management during our testing, with an average temperature of 69°C, which is 5.6% lower than the RX 6800 XT’s average temperature of 73°C.
Overall Gaming Performance
Average Power Consumption
Average Thermal Statistics
Pricing And Availability
Since we have conducted an in-depth analysis of the performance of the RX 6800 XT vs RTX 3080 Ti, the Radeon RX 6800 XT, and the GeForce RTX 3080 Ti, it’s equally important to assess their pricing and availability. These cards are among the most advanced options available, but their price and availability can vary significantly depending on the manufacturer and model.
According to our research, the Radeon RX 6800 XT has a price tag of approximately $500, while the NVIDIA RTX 3080 Ti has an approximate price of $1000, making the RTX 3080 Ti almost 66.6% more expensive than the RX 6800 XT.
RX 6800 XT Vs RTX 3080 Ti: Which One Would We Recommend?
Based on our extensive testing, we recommend the Radeon RX 6800 XT over the GeForce RTX 3080 Ti for gamers aiming to strike a balance between excellent performance and affordability.
Moreover, we found that the RTX 3080 Ti holds a slight edge in FPS performance at 1080p and in 4K gaming, making the RTX 3080 Ti the better choice for high-resolution gaming.
The RX 6800 XT showed us that its win lies in its superior power efficiency, with a 19.2% advantage at 1080p and a 24.3% advantage at 4K, ensuring a more cost-effective gaming experience.
Notably, the Radeon RX 6800 XT maintains better thermal management, running cooler by 7.5% at 1080p and 5.3% at 4K when compared to the RTX 3080 Ti.
Moreover, we found a substantial cost difference of approximately 66.6%, making the RX 6800 XT a highly recommended option for gamers looking for a powerful GPU without breaking the bank.
Pros And Cons
| GPU | Pros | Cons |
| Radeon RX 6800 XT |
|
|
| GeForce RTX 3080 Ti |
|
|
FAQs
The AMD 6800 XT is a powerful high-end graphics card that delivers impressive performance and features, making it a worthwhile investment for gamers and content creators.
While the AMD 6800 XT supports ray tracing, it falls behind Nvidia’s RTX series in terms of dedicated ray tracing hardware, resulting in less impressive ray tracing performance.
Yes, the Nvidia GeForce RTX 3080 Ti is a high-end graphics card designed for demanding gaming and content creation applications.
The Nvidia GeForce RTX 3080 Ti provides a major improvement over the 2080 Ti in terms of gaming performance, making it a significant upgrade for those looking for smoother gameplay.
More From RTX 3080 Ti:
More From RX 6800 XT:
Thank you! Please share your positive feedback. 🔋
How could we improve this post? Please Help us. 😔
[Comparisons Expert]
Abdemanaf is a skilled creative writer who has been honing his craft since 2011. While initially working in different fields, he found a passion for technology and has been exploring the tech world since early 2015. Over the years, he has developed an in-depth knowledge of the latest tech trends and product offerings by various companies.
Abdemanaf’s writing reflects his analytical mindset and ability to think critically. He has a knack for breaking down complex technical information into easily digestible pieces, making his articles engaging and accessible to readers from all backgrounds. In February 2022, he joined Tech4Gamers as a blog and product comparison writer, where he has been able to hone his skills further.
As a writer, Abdemanaf is dedicated to staying up-to-date with the latest technological advancements and trends, enabling him to provide readers with the most relevant and accurate information. He is always eager to learn more and is constantly seeking new challenges to improve his skills.
Get In Touch: manaf@tech4gamers.com


Feedback By: