GeForce RTX 3090 Ti
Rated: 8/10
Radeon RX 7900 XTX
Rated: 9.5/10
Pros & Cons
| GPUs | Pros | Cons |
|---|---|---|
| RX 7900 XTX | ✅ Extreme performance with lower price point. ✅ Better power efficiency | ❌ Doesn't have GDDR6X memory. |
| RTX 3090 Ti | ✅ Lower temperatures. ✅ Higher specs such as CUDA cores & TMUs. | ❌ Larger process node might be outdated. |
- In our 4k gaming benchmarks, the RX 7900 XTX was about 22% faster than the RTX 3090 Ti in terms of average FPS.
- Despite its lower performance, the RTX 3090 Ti consumed 20% more power than the 7900 XTX.
- The 7900 XTX ran about 18% hotter than the 3090 Ti on average in our gaming benchmarks.
- We recommend the RX 7900 XTX if you want a high-end card with relentless gaming performance at a much lower price.
Comparison Table
| Specifications | Radeon RX 7900 XTX | GeForce RTX 3090 Ti |
|---|---|---|
| Shading Units | 6144 | 10752 |
| Tensor Cores | 96 | 336 |
| RT Cores | 96 | 84 |
| TMUs | 384 | 336 |
| ROPs | 192 | 112 |
| Memory Speed | 960.0 GB/s | 1008 GB/s |
| Approximate Price | $1049 | $2210 |
| Best Variants | Best RX 7900 XTX | Best RTX 3090 Ti Graphic Cards |
| Best PSU | Best PSU For RX 7900 XTX | – |
| Best CPU | Best CPU For RX 7900 XTX | – |
Architectural Differences
- Processing Nodes: The RX 7900 XTX uses a chipset design that employs both 4nm and 5nm processing nodes, whereas the RTX 3090 Ti uses older 8nm manufacturing nodes.
- Clock Speed: The base clock of the RX 7900 XTX is about 1855MHz, while it boasts up to 2500MHz, whereas the RTX 3090 Ti has a base clock of 1560MHz and a boost clock of up to 1860MHz.
- VRAM: Both graphics cards have the same VRAM buffer size of 24GB. The RTX 3090 Ti utilizes GDDR6X technology, whereas the RX 7900 XTX uses less advanced GDDR6 memory technology.
- Memory Bus: Unlike the lower-end and midrange offerings from Nvidia, both the RTX 3090 Ti and the RX 7900 XTX utilize a wide 384-bit memory bus.
- TDP: The RX 7900 XTX has a TDP of around 355 watts, whereas the RTX 3090 Ti has a TDP of up to 450 watts.
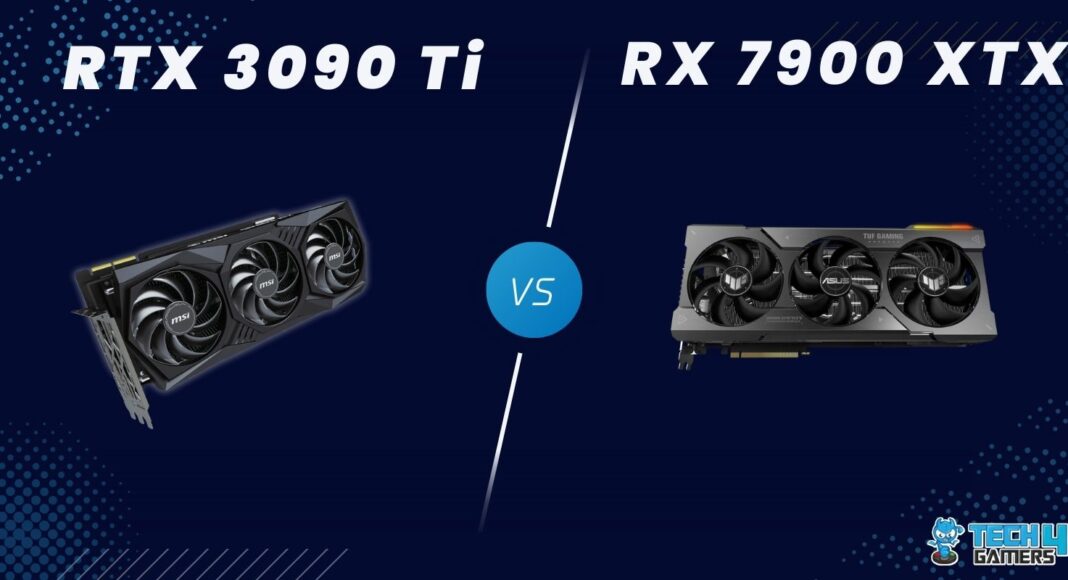
In the comparison between the RTX 3090 Ti and RX 7900 XTX, we’ll determine if AMD’s intentions were realized or if Nvidia’s previous generation outperforms Radeon’s latest flagship. So, let’s begin!
RTX 3090 Ti Vs RX 7900 XTX – Gaming Benchmarks
This part of the RTX 3090 Ti vs RX 7900 XTX comparison will focus on the performance of these graphics cards in modern titles at the 4K resolution. The tests you’ll see here were performed on a test bench designed to allow these cards to spread their wings.
Testing Rig
- CPU: Core i9-13900K
- Motherboard: ASUS ROG Strix Z790-E Gaming
- Memory: XPG Lancer RGB 32B 6000MHz DDR5 RAM
- SSD: XPG GAMMIX S70 BLADE 2TB NVMe
- Power Supply: be quiet! Dark Power Pro 13 1300W
- OS: Windows 11
Cyberpunk 2077
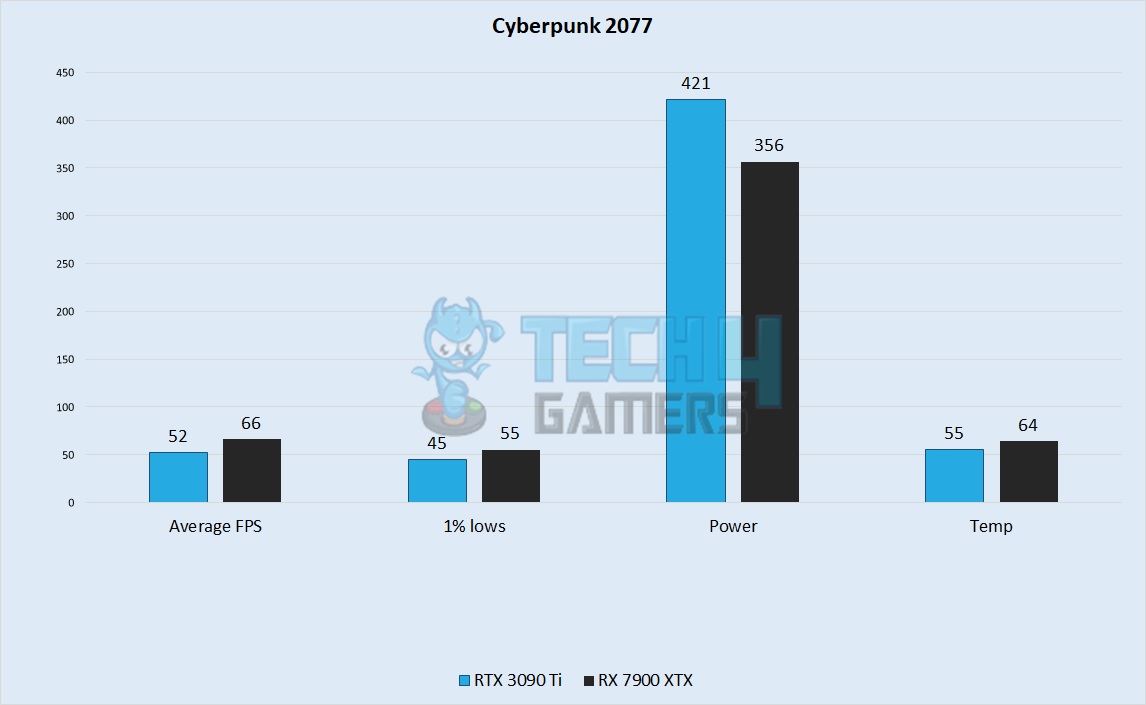
- In our first game, we noticed that the RX 7900 XTX outperformed the older card with an average of 66 FPS compared to the RTX 3090 Ti’s 52 FPS average – showcasing a 23.7% margin.
- The 1% lows were also noticeably smoother on the Radeon card, reaching a minimum of 55 FPS, compared to the slightly stuttery 45 FPS effort from the RTX.
The Last Of Us
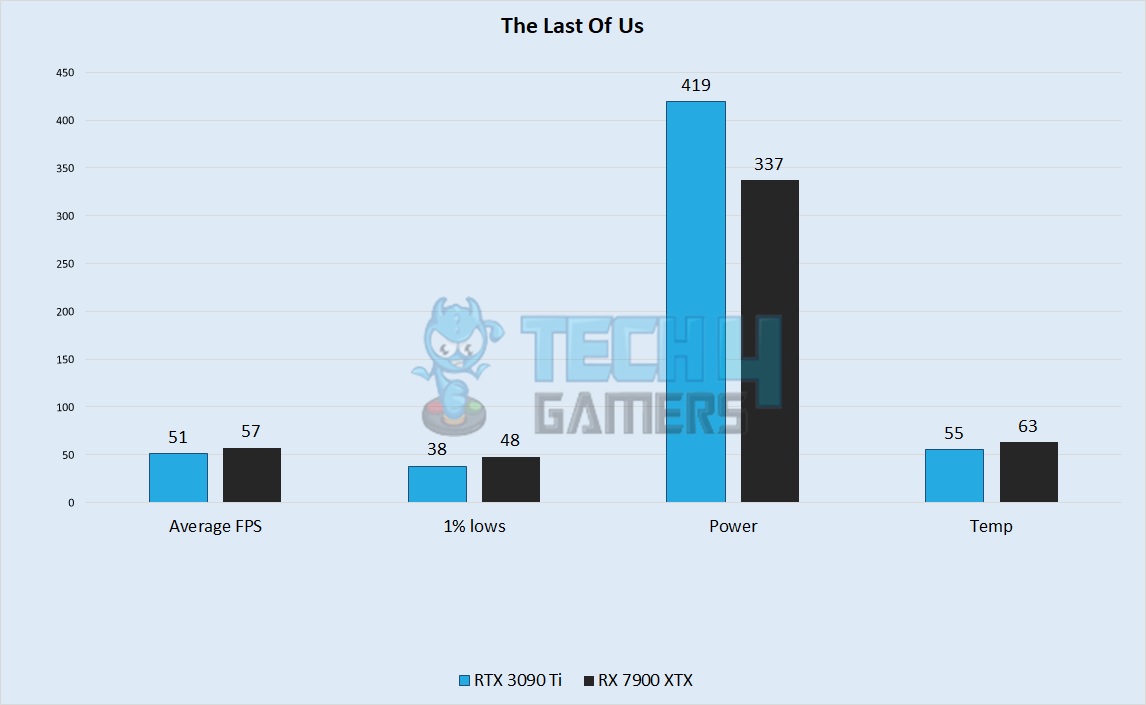
- Here, the RTX 3090 Ti got an average of 51 FPS while the RX 7900 XTX ran at a higher framerate of around 57 FPS, making it 11.1% better.
- The RTX 3090 Ti hit lower 1% lows than the RX 7900 XTX at 30 FPS vs the latter’s 48 FPS.
Hogwarts Legacy
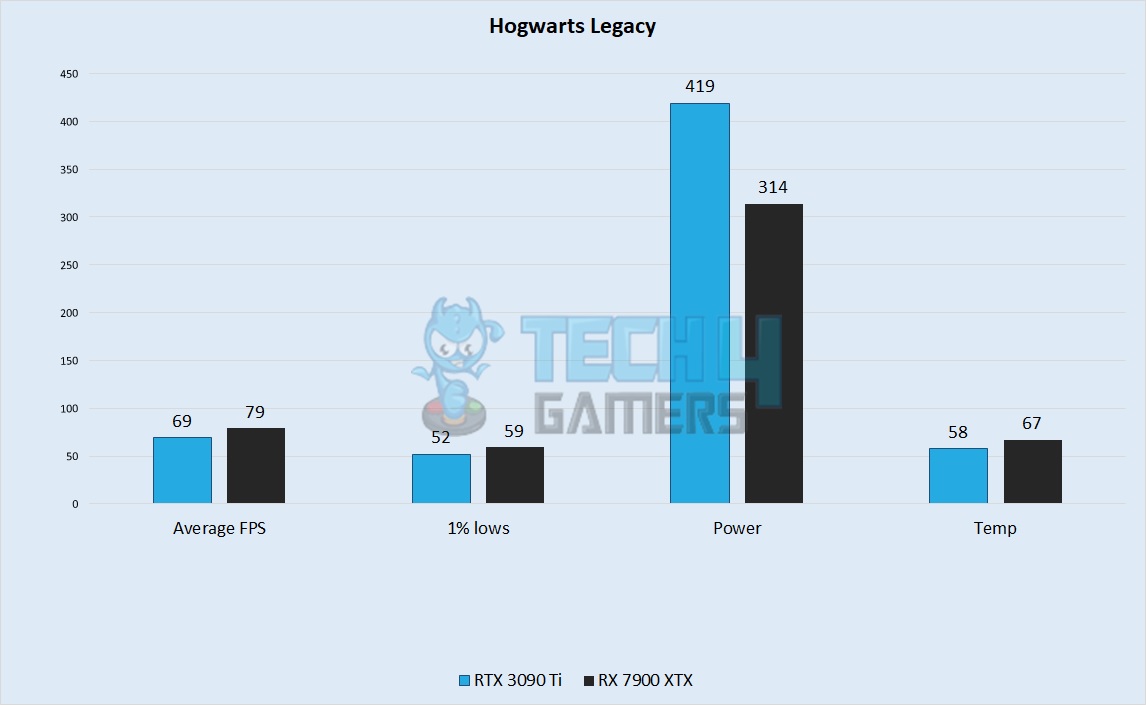
- In Hogwarts Legacy, we saw that the RTX 3090 Ti achieved an average framerate of 69 FPS, whereas the RX 7900 XTX got an average of around 79 FPS – resulting in a 13.5% gap.
- 1% lows were once again worse on the RTX 3090 Ti, touching about 52 FPS, whereas the RX 7900 XTX almost ran at the magic 60 FPS number at 1% lows of 59 FPS.
Hitman 3
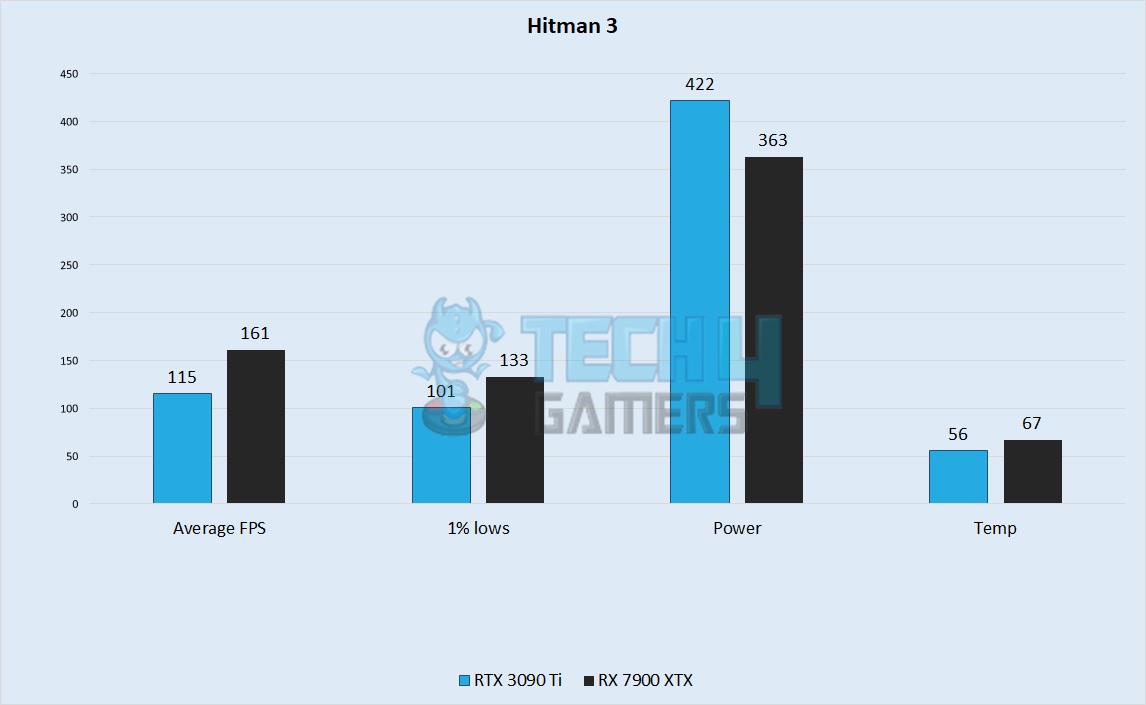
- This well-optimized benchmarking classic once again showed the RX 7900 XTX to be faster as it averaged 161 FPS, whereas the RTX 3090 Ti averaged 115 FPS – being 33.3% slower.
- The 1% lows also continued to show the RX to be faster, with a minimum framerate of 133 FPS, whereas the RTX 3090 Ti had worse 1% lows of 101 FPS.
Red Dead Redemption 2
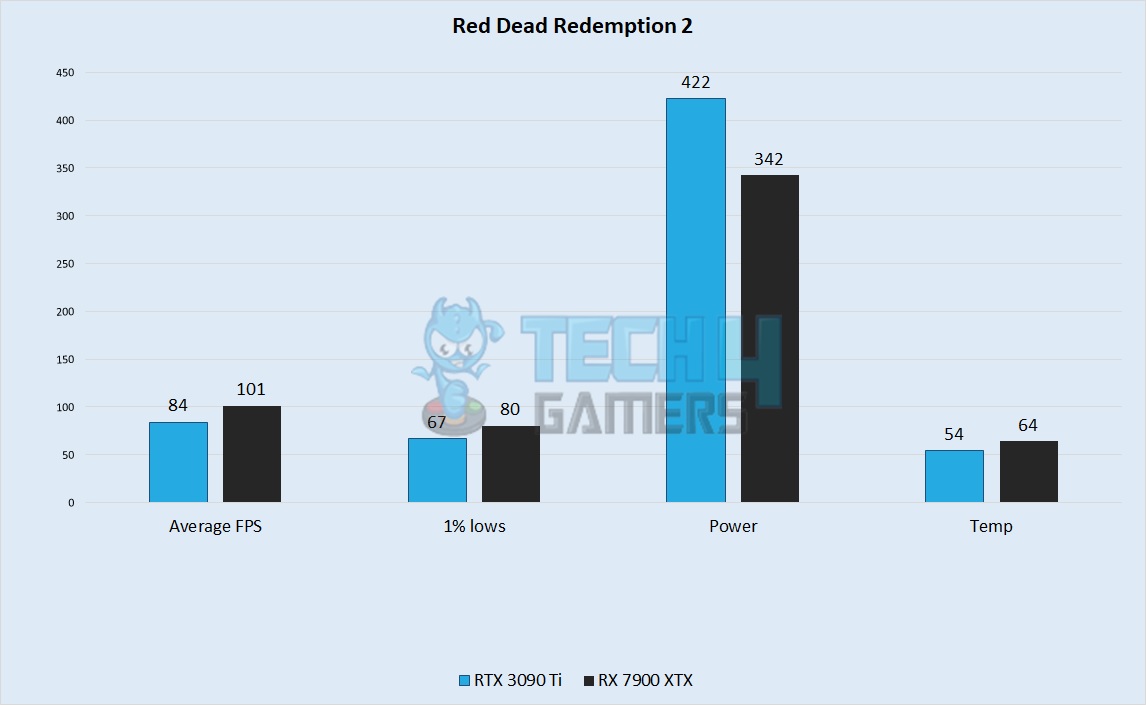
- Here, the RTX 3090 Ti had an average framerate of around 84 FPS, whereas the RX 7900 XTX reached an average of 101 FPS, being 18.3% faster than its rival.
- The RTX 3090 had a minimum 1% low of around 67 FPS, whereas the RX 7900 XTX had noticeably fewer stutters with a minimum framerate of 80 FPS.
Remnant 2
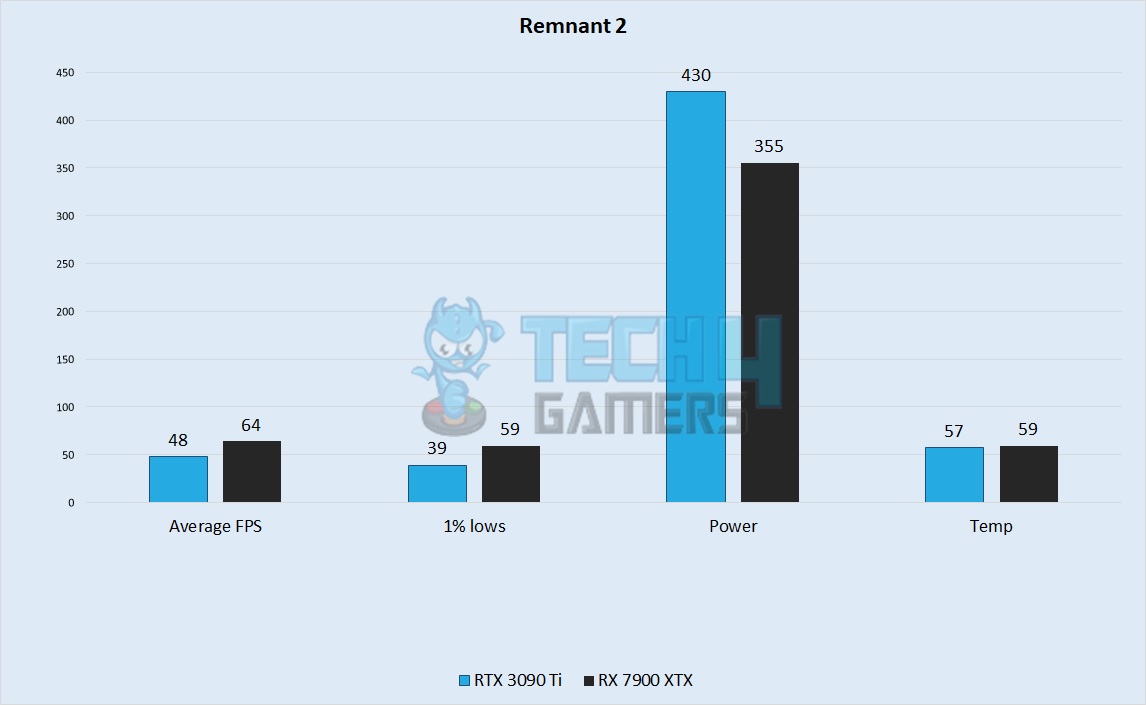
- The Remnant 2 game ran 28.5% better on the RX 7900 XTX with a 64 FPS, compared to the rather disappointing average of 48 FPS supplied by the Nvidia card in our benchmarks.
- 1% lows faired no better on the older card at around 39 FPS, whereas the RX 7900 XTX had 1% lows hovering around 59 FPS.
Forza Horizon 5
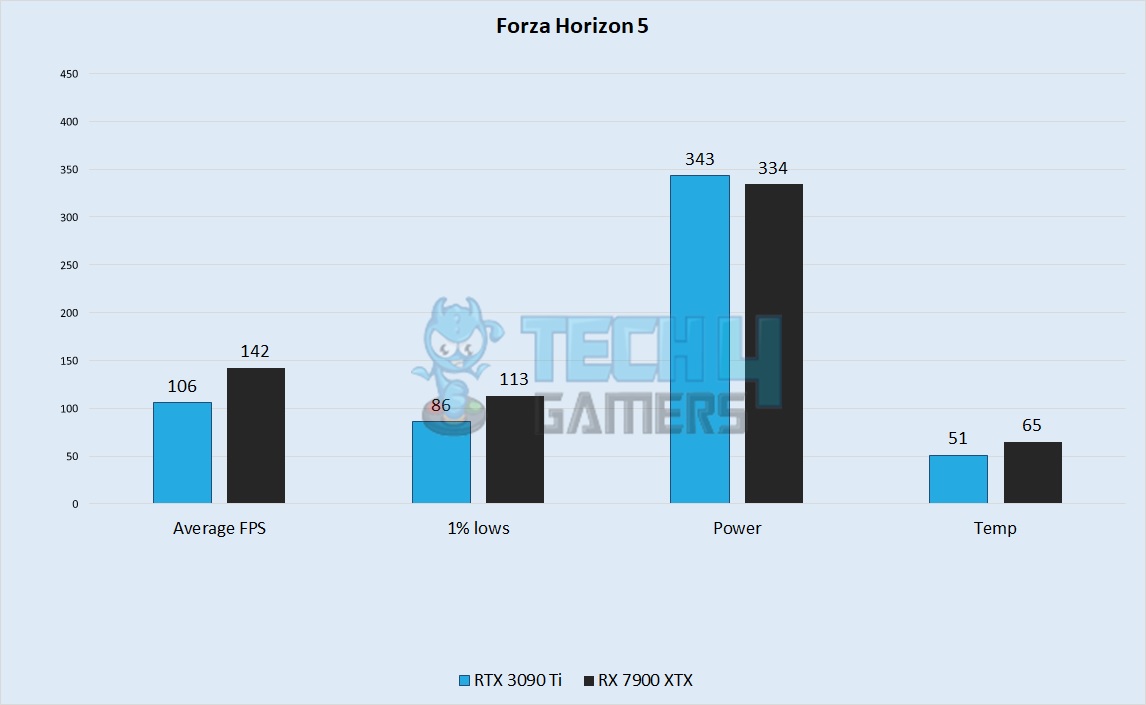
- The RTX 3090 Ti obtained an average of 106 FPS, whereas we also saw that the RX 7900 XTX had a much higher average of 142 FPS, where it led with a 29% performance margin.
- 1% lows were almost the most different in this well-optimized title, with the RTX 3090 Ti getting 86 FPS, whereas the RX 7900 XTX got lows of around 113 FPS.
Microsoft Flight Simulator
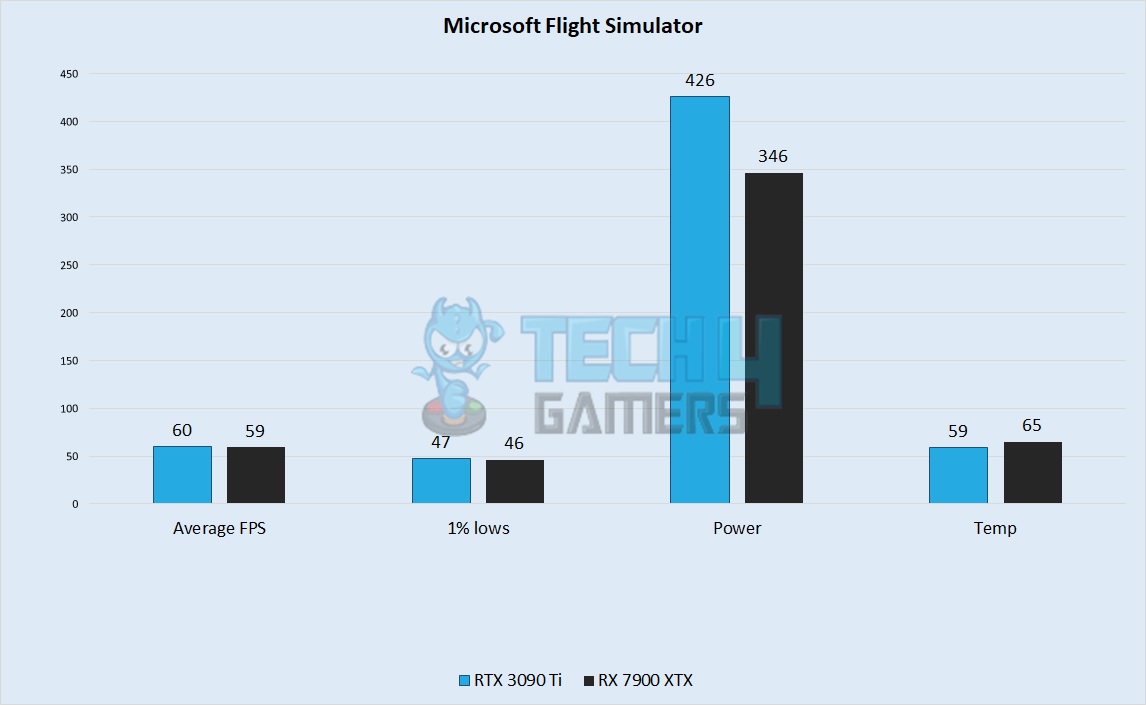
- The RTX 3090 Ti finally achieved its first victory in MS Flight Sim 2020 it averaged 60 FPS, whereas the RX 7900 XTX had an average of 59 FPS, being only 1.6% behind.
- 1% lows were also just a frame apart, only the tow, with the RTX 3090 Ti getting a framerate of 47 FPS, whereas the RX 7900 XTX had a framerate of 46 FPS.
Overall Gaming Performance
| Graphics Card | Average FPS | 1% Lows |
|---|---|---|
| RTX 3090 Ti | 📈 73 | 📉 59 |
| RX 7900 XTX | 📈 89 | 📉 74 |
| Winner: RX 7900 XTX | ||
Observing the overall gaming performances of the two GPUs, the RX 7900 XTX was about 22% faster than the RTX, incorporating a better and smoother performance than its competitor in our benchmarks. This tilts the scales in favor of the AMD Radeon RX 7900XTX, declaring it the dominant GPU.
Overall Power Consumption
| Games | RTX 3090 Ti (W) | RX 7900 XTX (W) |
|---|---|---|
| Average Power Consumption | 412 ⚡️ | 343 ⚡️ |
| Winner: RX 7900 XTX | ||
Moving onto the power draw, we witnessed the RX 7900 XTX being considerably more power efficient drawing around 20% lower than the RTX 3090 Ti at an average. The RTX 3090 Ti showed 0.17 frames/watt, whereas the RX 7900 XTX proved to be 47% more efficient with around 0.26 frames/watt.
Overall Thermal Efficiency
| Games | RTX 3090 Ti (°C) | RX 7900 XTX (°C) |
|---|---|---|
| Average Thermal Capacity | 55 🌡️ | 64 🌡️ |
| Winner: RTX 3090 Ti | ||
Speaking about the thermal levels, the RTX 3090 Ti ran comparatively cool. In contrast, the RX 7900 XTX was rather warm in our testing, getting an average peak temperature of around 64°C. Though the RX 7900 XTX ran hotter than the RTX 3090 Ti, temperatures were well within the safe range for both cards.
Price And Availability
| GPUs | MSRP | Current Price |
|---|---|---|
| RX 7900 XTX | 💲999 | 💲939 - 💲1049 |
| RTX 3090 Ti | 💲1999 | 💲2210 |
| Price Difference | 66.7% | 80.7% - 71.2% |
Our research showed that the RTX 3090 Ti’s price has been increased by 10% from its MSRP. Whereas, the RX 7900 XTX’s base variants saw a price drop of 6.1% whereas its higher-end variants are being sold at a 4.8% higher rate as compared to its original launch price. All in all, the RX 7900 XTX is around 71.2% to 80.7% cheaper than the RTX 3090 Ti.
Conclusion – Which One Would We Recommend?
RX 7900 XTX: If you are all for relentless gaming and incredible power-packed in a GPU, we recommend you go for the RX 7900 XTX. It is the more powerful card with a 22% edge and has the same merits as the RTX 3090 Ti while improving on performance. It also draws almost half the power and is also extremely cheaper than its rival.
RTX 3090 Ti: The RTX 3090 Ti, on the other, hand not only underperformed, but it also showed high power consumption. Yes, it operated with lower temperatures but its over-the-top price point doesn’t justify its performance that’s why we don’t recommend the RTX 3090 Ti.
The RX 7900 XTX is the most reasonable option to opt for in our opinion because of its high performance at a lower price based on our benchmark results. However, you are free to choose whichever GPU according to your budget and current requirements.
Frequently Asked Questions
The difference in performance between the two cards computes to about 12.4% when gaming at 4k.
The newer card is faster than the RTX 3090 Ti, but the decision of which card you should buy depends on how far you can stretch your budget.
Both graphics cards should be good to use for a while, but the RX 7900 XTX is better for future proofing because of its improved performance metrics.
More From RTX 3090 Ti
More From RX 7900 XTX
Thank you! Please share your positive feedback. 🔋
How could we improve this post? Please Help us. 😔
[Comparisons Expert]
Abdemanaf is a skilled creative writer who has been honing his craft since 2011. While initially working in different fields, he found a passion for technology and has been exploring the tech world since early 2015. Over the years, he has developed an in-depth knowledge of the latest tech trends and product offerings by various companies.
Abdemanaf’s writing reflects his analytical mindset and ability to think critically. He has a knack for breaking down complex technical information into easily digestible pieces, making his articles engaging and accessible to readers from all backgrounds. In February 2022, he joined Tech4Gamers as a blog and product comparison writer, where he has been able to hone his skills further.
As a writer, Abdemanaf is dedicated to staying up-to-date with the latest technological advancements and trends, enabling him to provide readers with the most relevant and accurate information. He is always eager to learn more and is constantly seeking new challenges to improve his skills.
Get In Touch: manaf@tech4gamers.com


