Nvidia GeForce RTX 5080 Rated: 9/10 Radeon RX 7900 XTX Rated: 7.1/10
Pros And Cons
| GPU | Pros | Cons |
|---|---|---|
| RTX 5080 | ✅ Equipped with PCIe 5.0 ✅ DLSS 4 with improved frame generation | ❌ Lower TMUs, ROPs & RT Cores |
| RX 7900 XTX | ✅ Higher VRAM & bus width ✅ Ideal for multiple 4K+ display setups | ❌ Lags behind in AI-based applications |
- Compared to the RX 7900 XTX, the average framerates on the RTX 5080 were 11.2% better in 4K gaming and 27.5% better in terms of productivity.
- The RTX 5080 consumed 22.3% less power and operated with 18.6% lower temperatures in the eight tested games when compared to the RX 7900 XTX.
- For now, the RTX 5080 is $118 cheaper than the RX 7900 XTX. However, this price difference could shift entirely if the RTX 5080’s price increases due to the common scalper issue.
- If the RTX 5080’s price increases more than the RX 7900 XTX’s, we suggest you get the latter. If it remains similar to or cheaper than the former, we recommend you get the former.
Comparison Table
| Features | RTX 5080 | RX 7900 XTX |
|---|---|---|
| Slot Width | Dual-slot | Dual-slot |
| Release Date | Jan 30th, 2025 | Nov 3rd, 2022 |
| Power Connectors | 1x 16-pin | 2x 8-pin |
| Shader Cores (CUDA) | 10752 | 6144 |
| TMUs | 336 | 384 |
| ROPs | 128 | 192 |
| Tensor Cores | 336 | N/A |
| RT Cores | 84 | 96 |
| Suggested PSU | 360W | 750W |
| Best Variants | - | Best RX 7900 XTX |
| Best CPU | - | Best CPUs For RX 7900 XTX |
| Best PSU | - | Best PSUs For RX 7900 XTX |
Architectural Difference
- Process Nodes: Although there is a two-year gap between these two GPUs, the RX 7900 XTX shares the same process node that the RTX 5080 comes with, which is 5nm in size.
- Clock Speeds: The RTX 5080 arrives with a higher base clock frequency and boost frequency of 2295 MHz and 2617 MHz. In comparison, the RX 7900 XTX has a base speed of 1929 MHz, which can be ramped up to 2498 MHz.
- VRAM: The RTX 5080 has a 16GB VRAM of GDDR7 and it has a bus width of 256-bit. Whereas the RX 7900 XTX has a higher VRAM of 24GB but uses GDDR6 instead with a 384-bit bus width.
- TDP: Both the RTX 5080 and the RX 7900 XTX share almost the same TDP. The RTX 5080 has a 360W TDP, while the RX 7900 XTX has a 355W TDP rating.
- Supported Technologies: Nvidia’s RTX 5080 uses DLSS 4, which comes with multi-frame generation. Whereas the RX 7900 XTX uses FSR 3 and its ray tracing performance is usually weaker than DLSS.
AMD’s RX 7900 XTX is often compared to Nvidia’s RTX 4080 Super. Now, the RTX 5080 has been recently released, and is is said to have a little improvement over the RTX 4080 Super. So, in this RTX 5080 vs RX 7900 XTX comparison, let’s see how true that is and whether the RX 7900 XTX has a new equivalent.
Gaming Benchmark – 4K
What better way to test the performance of two graphic cards than to perform a side-by-side gaming benchmark of each GPU? We went the extra mile and threw in some games where the RTX 5080 uses its DLSS 4 and the RX 7900 XTX utilizes its FSR 3. The settings were kept all the way up for each game.
Recommended Test Bench
- CPU – AMD Ryzen 7 9800X3D
- Mobo – MSI MPG X670E Carbon WiFi
- RAM – G.Skill Trident Z5 Neo RGB 32GB DDR5-6000 CL30
- Storage: Sabrent Rocket 4 Plus 1TB NVMe SSD
- CPU Cooler: Corsair iCUE H150i Elite Capellix XT
- Power Supply: Enermax Revolution D.F. X 1050W
- Operating System – Windows 11
Final Fantasy 16 (FSR/DLSS Quality)
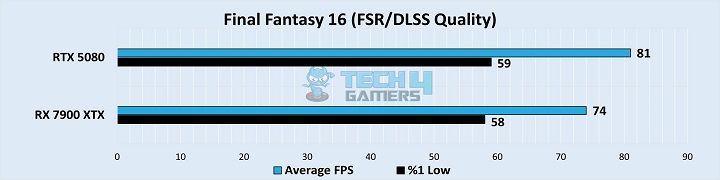
- Right from the very first game, we saw that the RTX 5080 performed better with DLSS and averaged 81 FPS. Whereas the FSR-operated RX 7900 XTX was only 9% behind with its average of 74 FPS.
- As for the 1% lows, the situation was very different because both the RTX 5080 and the RX 7900 XTX shared almost identical dips of 59 FPS and 58 FPS, respectively. This resulted in a negligible 1.7% difference.
COD Black Ops 6
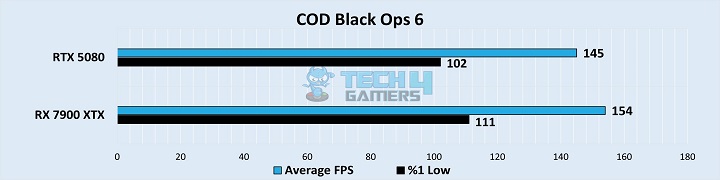
- On Call Of Duty Black Ops 6, the RX 7900 XTX turned the table because it acquired 154 FPS, on average. This was a 6% performance margin because the RTX 5080 averaged only 145 FPS without any upscaling on both sides.
- The 1% lows were also in favor of the RX 7900 XTX as it obtained an average of 111 FPS, whereas the RTX 5080 acquired an average of 102 FPS, equating to an 8.5% difference in performance.
Indiana Jones (Ray Tracing)
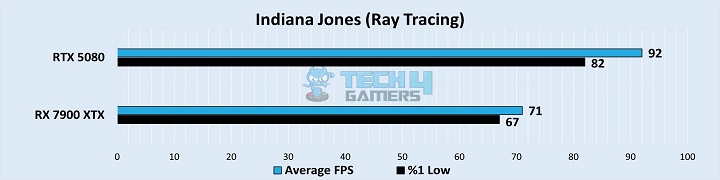
- With ray tracing enabled, the RTX 5080 showcased a phenomenal 25.8% increase in performance because it achieved 92 FPS, on average. On the other hand, the RX 7900 XTX performed with 71 FPS.
- Regarding the 1% lows, the RTX 5080 provided a 20.1% smoother experience since it averaged 82 FPS. In contrast, the RX 7900 XTX was smooth because it was up the 60 FPS mark with its 67 FPS.
Hellblade 2 (DLSS/FSR Quality)
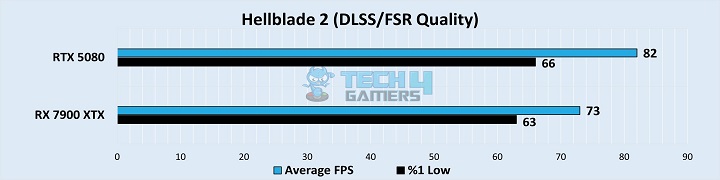
- With the DLSS enabled, the RTX 5080 was pushed with an average of 82 FPS. This was 11.6% better than the RX 7900 XTX, which had the FSR enabled, as it achieved 73 FPS, on average.
- The 1% lows were quite similar on both cards, and there was only a 4.7% difference achieved by the RTX 5080 as it averaged 66 FPS. In comparison, the RX 7900 XTX obtained 63 FPS, on average.
Silent Hill 2 (DLSS/FSR Quality)
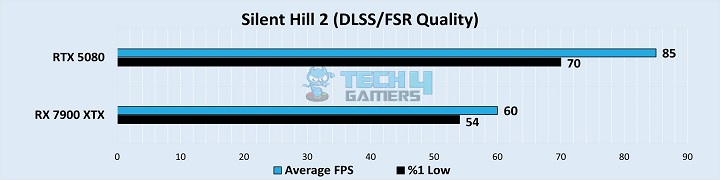
- Here, we observed that the use of DLSS and FSR was much needed as both GPUs went below 60 FPS, but with these enabled, the RTX 5080 gained a whopping 34.5% lead with its average of 85 FPS compared to the RX 7900 XTX’s 60 FPS.
- In terms of the 1% lows, the RTX 5080 performed better because its framerates dipped to 70 FPS at max, whereas the RX 7900 XTX’s FPS reached 54 FPS, on average. This results in a 25.8% performance margin.
Ghost Of Tsushima (DLSS/FSR Quality)
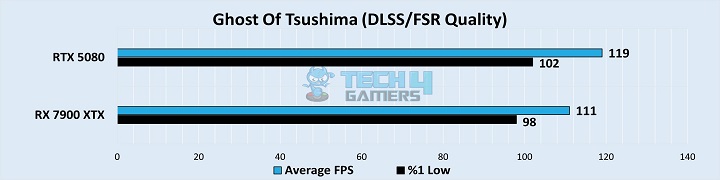
- Although both GPUs performed over 70 FPS without upscaling and the RX 7900 XTX was in the lead, the RTX 5080 displayed 7% better framerates with upscaling as it averaged 119 FPS compared to the RX 7900 XTX’s 111 FPS.
- For average 1% lows, the RTX 5080 gained 102 FPS, which was 4% better than the RX 7900 XTX’s 98 FPS. However, this difference is considered insignificant because of the lower gap between the two GPUs.
God Of War Ragnarok
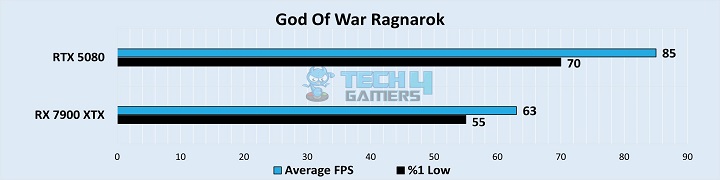
- Without upscaling, the RTX 5080 was the better performer in God Of War Ragnarok because it pushed with an average of 85 FPS. This was 29.7% better in performance when compared to the RX 7900 XTX’s 63 FPS.
- As for the 1% lows, the RTX 5080 had frames reaching 70 FPS at max. In contrast, the RX 7900 XTX wasn’t as smooth because the frames dropped below 60 FPS as it obtained an average of 55 FPS, a 24% margin.
Horizon Forbidden West
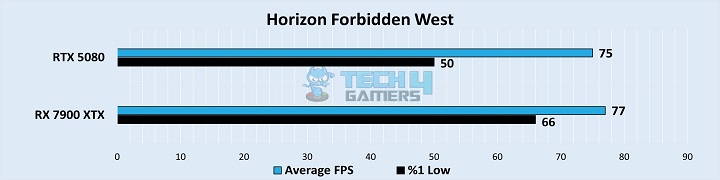
- In our last game, the RX 7900 XTX astonished us by having the edge with its average of 77 FPS, which was 2.6% higher than the RTX 5080’s average of 75 FPS.
- In terms of the 1% lows, the RTX 5080 had slightly choppy moments because its lows dipped to 50 FPS. On the other hand, the RX 7900 XTX was the smooth operator as it averaged 66 FPS, a 27.6% gain.
Productivity Benchmarks
Other than gaming, productivity benchmarks are another great way to test the performance of two cards. So, we’ve added video editing, rendering, and image generation using AI in this comparison to give you a clear picture of how efficient these two cards are in these areas.
Adobe Premiere Pro
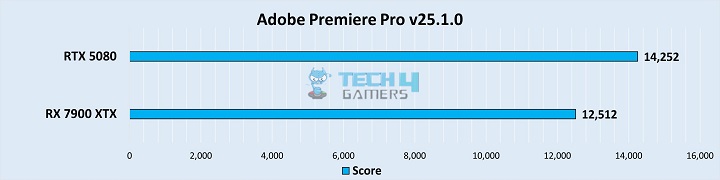
- For editing, the RTX 5080 showed better results as it achieved a score of 14,252 points. This was 13% better than the RX 7900 XTX because it performed with 12,512 points.
Blender (Barbershop)
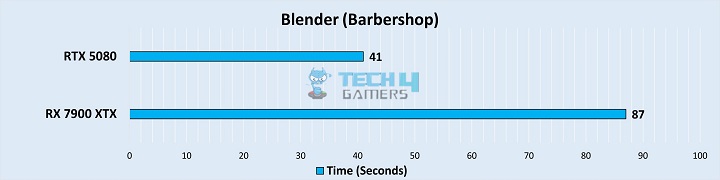
- On Blender, the RTX 5080 completed the entire render in only 41 seconds. However, the RX 7900 XTX took 1 minute and 27 seconds to finish the whole render. This makes the RTX 5080 astonishingly 71.9% faster in terms of rendering.
UL Procyon (AI Image Generation)
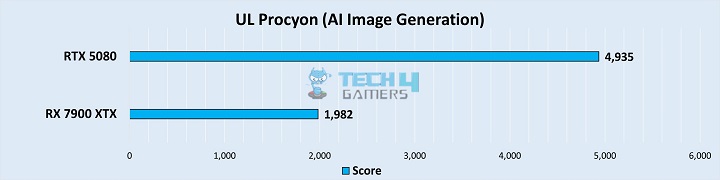
- For generating images using AI, the RTX 5080 was ahead with a staggering 85.4% lead because it achieved a score of 4,935. While the RX 7900 XTX performed relatively poorly with 1,982 points.
Overall Performance
| Graphic Cards | RTX 5080 | RX 7900 XTX |
|---|---|---|
| Average FPS | 📈95.5 | 📈85.4 |
| 1% Lows | 📉75.1 | 📉71.5 |
| Productivity (Rating) | ✏️7/10 | ✏️5.3/10 |
| Winner: Nvidia's GeForce RTX 5080 | ||
Average Framerate
Our calculations showed that the RTX 5080 was a clear winner. Specifically, the RTX 5080 was 11.2% better than the RX 7900 XTX because it performed above 70 FPS for each game with and without upscaling. However, the RX 7900 XTX was also quite good, as it performed better without upscaling in two games.
1% Lows:
In terms of the 1% lows, the RTX 5080 was 4.9% smoother than the RX 7900 XTX in eight of the tested games. Apart from two games, it stayed above the 60 FPS mark for all games, giving a smoother experience throughout. The RX 7900 XTX’s lows were closer to its average framerates comparatively.
Productivity:
In the area of productivity, the RTX 5080 showed a 27.5% better performance than the RX 7900 XTX, especially when it comes to AI image generation and rendering. In terms of video editing on Adobe Premiere Pro, the RX 7900 XTX gave the RTX 5080 quite tough competition.
Average Power Consumption
| Game | RTX 5080 | RX 7900 XTX |
|---|---|---|
| Final Fantasy 16 4K Ultra FSR/DLSS Q | 240 | 340 |
| CoD Black Ops 6 4K Basic | 257 | 347 |
| Indiana Jones 4K Supreme (Includes RT) | 305 | 347 |
| Hellblade 2 4K High DLSS/FSR Q | 258 | 345 |
| Silent Hill 2 4K Epic DLSS/FSR Q | 286 | 346 |
| Ghost of Tsushima 4K Very High DLSS/FSR Q | 287 | 346 |
| God of War Ragnarok 4K Ultra | 318 | 347 |
| Horizon Forbidden West 4K Very High | 259 | 347 |
| Average Power Draw | 276.3⚡ | 345.6⚡ |
| Winner: RTX 5080 |
The RTX 5080 also checked the box for being a more power-efficient option. Specifically, the RTX 5080 was 22.3% more power-efficient than the RX 7900 XTX, and it only exceeded 300W in two out of the eight tested games. On the other hand, the RX 7900 XTX consistently consumed around 347W for each game.
Average Thermal Statistics
| Game | RTX 5080 | RX 7900 XTX |
|---|---|---|
| Final Fantasy 16 4K Ultra FSR/DLSS Q | 56 | 73 |
| CoD Black Ops 6 4K Basic | 57 | 72 |
| Indiana Jones 4K Supreme (Includes RT) | 61 | 69 |
| Hellblade 2 4K High DLSS/FSR Q | 59 | 73 |
| Silent Hill 2 4K Epic DLSS/FSR Q | 62 | 70 |
| Ghost of Tsushima 4K Very High DLSS/FSR Q | 62 | 71 |
| God of War Ragnarok 4K Ultra | 62 | 70 |
| Horizon Forbidden West 4K Very High | 54 | 72 |
| Average Temperatures | 59.1🌡️ | 71.3🌡️ |
| Winner: RTX 5080 |
As for the thermals, the RTX 5080 proved to be once again a better option. From the eight tested games, the RTX 5080 was 18.6% more thermally efficient than the RX 7900 XTX because the temperatures were below 63°C for all games. At the same time, the RX 7900 XTX hovered around 70°C for the most part.
Pricing And Availability
| GPU | RTX 5080 | RX 7900 XTX | Price Difference |
|---|---|---|---|
| Launch MSRP | 💲999 | 💲999 | 0% |
| Current Price | 💲1354 | 💲1472 | 8.4% |
As for writing this article (early February 2025), the RTX 5080 ticks the box in terms of price as well as it is currently $118 cheaper than the RX 7900 XTX. We don’t know how long it will stay at this price point because the prices of new cards usually rise shortly after their release.
Final Verdict—What We Recommend?
RX 7900 XTX: The RX 7900 XTX performed quite well in 4K gaming, especially with FSR set to quality. In some games, the RX 7900 XTX showed better raw performance, giving a better price-to-dollar ratio comparatively. It also showed higher power consumption and temperatures and is currently slightly pricier.
RTX 5080: This card, on the other hand, surpassed each section with flying colors. It has both performances, and it has ticked all the boxes for efficiency as well. Not only that, but the RTX 5080 use of the newer DLSS 4 and AI makes it a better option for future-proofing, since both of these will become increasingly important.
Conclusively, if the RTX 5080’s price exceeds way the RX 7900 XTX’s price, we’d suggest you get the RX 7900 XTX since it will offer value for money. However, if the price remains similar and lower than that of the RX 7900 XTX, we recommend the RTX 5080 as it offers much more for its price when compared to its rival.
The RTX 5080 is better for future proofing because it offers more use for AI-based workloads, has better ray tracing, better DLSS, and better productivity performance. The RTX 5080 is better in this area because of its AV1 dual encoder, which improves video quality & efficiency. RX 7900 XTX’s FSR 3 with FMF works but isn’t as effective. The RTX 5080 implementation of tensor cores dedicated to AI workloads like machine learning and image generation makes it better than the RX 7900 XTX, which lacks tensor cores. Although RX 7900 XTX has higher RT Cores, the RTX 5080 is better at ray tracing because its RT cores are more efficient and perform better paired with DLSS 3.5 and SER. The RTX 5080 is better for 4K gaming because it offers higher framerates at 4K. The RX 7900 XTX works well for a few games at 4K but it is an overall great card for 1440p gaming.FAQs
More From RTX 5080 More From RX 7900 XTX
Thank you! Please share your positive feedback. 🔋
How could we improve this post? Please Help us. 😔
[Comparisons Specialist]
I’m a passionate computer hardware expert specializing in CPUs and GPUs. With a lifelong curiosity for hardware and extensive hands-on experience, I provide valuable insights, practical advice, and in-depth analysis on these components. Engaging with the hardware community, I exchange knowledge and stay at the forefront of technological advancements.
Get In Touch: uzair@tech4gamers.com