


Core i7 12700K
Rated: 8/10
Core i7 11700K
Rated: 8/10
Pros And Cons
| CPU | Pros | Cons |
|---|---|---|
| Core i7 12700K | ✅ Two extra cores ✅ Better power efficiency ✅Support for DDR5 | ❌Slighlty higher price |
| Core i7 11700K | ✅ Good performance ✅Slghtly cheaper | ❌Uses an older platform ❌No support for DDR5 |
- There was only a slight performance difference of around 5% in our testing of these two processors, with the 12700K being a hair faster at 1080p.
- The timid improvements of the 12700K in performance are also accompanied by a small decrease in power consumption over the 11700K.
- The price-to-performance ratio of these processors is nearly identical as of early March 2024, with the 11700K being slightly cheaper.
- With the relatively low and close price of both chips, we think that consumers should be happy with getting either processor in their setup.
Comparison Table
| Feature | Core i7 11700K | Core i7-12700K |
|---|---|---|
| Socket | FCLGA1200 | FCLGA1700 |
| Supported memory types | DDR4 | DDR4, DDR5 |
| Maximum memory size | 128 GB | 128 GB |
| Max memory channels | 2 | 2 |
| Maximum memory bandwidth | 50 GB/s | 76.8 GB/s |
| iGPU | Intel UHD Graphics 750 | Intel UHD Graphics 770 |
| Max resolution over HDMI 1.4 | 4096x2160@60Hz | 4096 x 2160 @ 60Hz |
| Max resolution over eDP | 5120 x 3200 @60Hz | 5120 x 3200 @ 120Hz |
| Max resolution over DisplayPort | 5120 x 3200 @60Hz | 7680 x 4320 @ 60Hz |
| Best Motherboards | - | Best Motherboards for i7-12700K |
| Best CPU Coolers | - | Best CPU Coolers for i7-12700K |
| Best RAM | - | Best RAM For i7-12700K |
Architectural Differences
- Manufacturing Process: The 12700K uses a more recent 10nm process size instead of the rather inefficient 14nm process nodes of the 11700K.
- TDP: Despite the improvements in power efficiency for the 12700K it has the same TDP of 125 watts as the 11700K.
- Core Count: The Core i7 12700K has 8 performance cores, the same as the 11700K, but it also has the benefit of 4 extra efficiency cores, which the 11700K has none of.
- Clock Speed: The performance cores on both processors have the base and boost clock speeds of 3.6GHz and 5GHz, respectively.
- L3 Cache: The 12700K has 25 megabytes of on-dye L3 memory, whereas the 11700K only has 16 megabytes.
Turning to older processors at a time of stale innovations from AMD and Intel is the go-to for consumers looking for a good price-to-performance ratio. In this 12700K vs 11700K CPU comparison, we’ll be comparing the specifications and gaming performance to find the better i7 amongst the two.
i7 12700K vs i7 11700K Gaming Benchmarks – 1080p
To test the gaming performance of these two chips, we set up a test bench that only leaves the CPUs as the possible bottleneck, ensuring accurate real-world gaming differences. You can take a look at the specs of the test bench below:
Test PC
- CPU: INTEL CORE I7 11700K / INTEL CORE I7 12700K
- GPU: MSI GeForce RTX 3090 Ti Gaming X Trio
- RAM: XPG Lancer RGB 32GB 7200MT/s DDR5, T-Force Night Hawk RGB DDR4
- SSD – XPG GAMMIX S70 BLADE 2TB NVMe
- PSU – ENERMAX REVOLUTION D.F. X 1050W
- CPU Cooler: Arctic Liquid Freezer II 360 – AIO Water Cooler
Far Cry 6
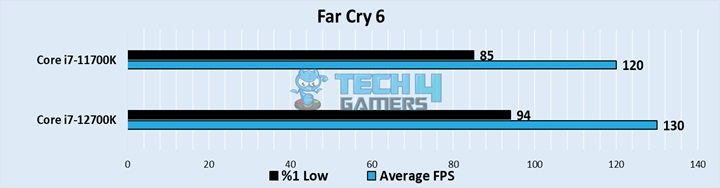
- In our test of Far Cry 6, the 12700K had an average framerate of 130 FPS, 8.3% higher than the 120 FPS of the 11700K.
- The lows were around 11% apart in our testing, with the 12700K getting a framerate of 94 FPS, while the 11700K had lows of 85 FPS.
Cyberpunk 2077
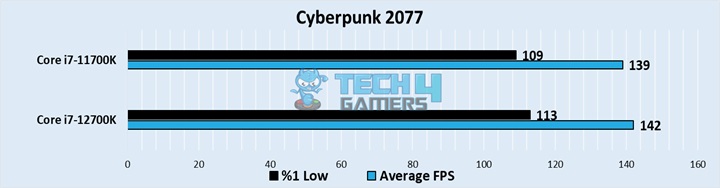
- The framerate difference was much more modest at around 2% in this game, with the 12700K getting an average framerate of 142 FPS, while the 11700K had a framerate of 139 FPS.
- The minimum framerates showed a discrepancy of around 4%, with the 12700K going down to 113 FPS, while the 11700K had lows of 109 FPS.
Microsoft Flight Simulator
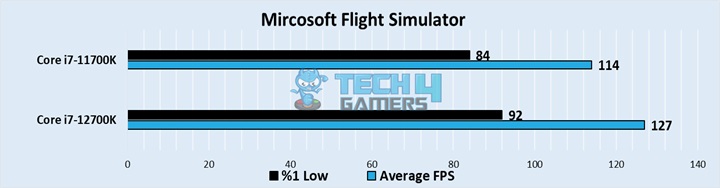
- The average framerates were around 11% higher on the newer chip, with the 12700K getting a framerate of 127 FPS, while the 11700K had an average of around 114 FPS.
- The minimum framerates were 9.5% higher on the newer chip at around 92 FPS, while the 11700K had lows of 84 FPS.
Watch Dogs Legion
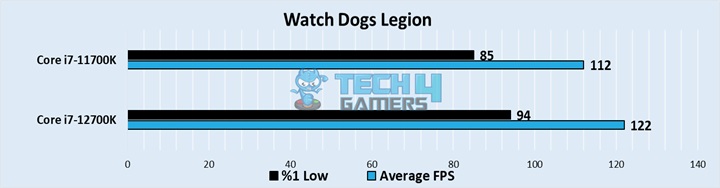
- The framerates showed a difference of 9% between the two chips in Watch Dogs Legion, with the 12700K hovering around 122 FPS, while the 11700K had an average framerate of 112 FPS.
- The minimum framerates showed an 11% difference with the 12700K being in the lead. It had an average framerate of 94 FPS, while the 11700K kept up with lows of 85 FPS.
Control
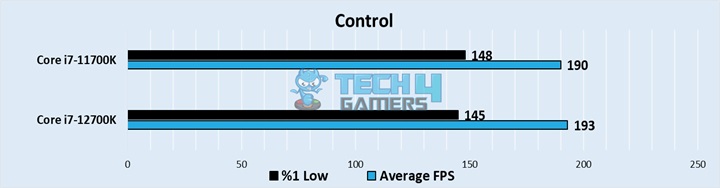
- Control showed a small difference of 2% between the two chips, with the 12700K getting an average framerate of 193 FPS, whereas the 11700K had an average of 190 FPS.
- The 2% difference returned for the lows of this game but with the 11700K in the lead. It had a minimum of 148 FPS, while the 12700K held closer to 145 FPS.
Assassin’s Creed Valhalla
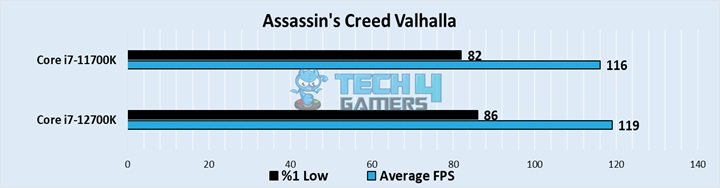
- AC: Valhalla also showed a negligible difference of around 2.5% in our testing, with the 12700K hovering around 119 FPS, while the 11700K had an average of 116 FPS.
- The difference was a bit larger in the 1% lows, with the 11700K hovering around 82 FPS, while the 12700K had lows of around 86 FPS.
F1
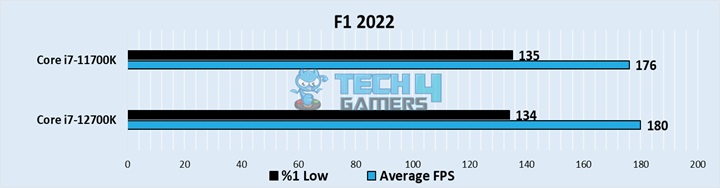
- F1 2022 showcased a difference of around 2% between the two processors, with the 12700K holding strong at 180 FPS, whereas the 11700K was slightly behind with lows of 176 FPS.
- We saw a negligible difference between the 1% lows in this game. The 12700K had lows of 134 FPS, while the 11700K had lows of around 135 FPS.
Overall Gaming Performance
| Featured | Core i7 11700K | Core i7 12700K |
|---|---|---|
| Average FPS | 138 📈 | 145 📈 |
| %1 lows | 104 📉 | 108 📉 |
| Winner: Intel's Core i7 12700K | ||
There was a modest 5% difference in the average framerates of these chips on the whole, whereas the difference in lows was closer to around 4%. Depending on the framerate these changes can be imperceivable, but this is not to discredit the generational improvement of the 12700K over its predecessor.
Power Consumption
| Graphics Card | Power Consumption |
|---|---|
| Core i7 12700K | ⚡291 |
| Core i7 11700K | ⚡301 |
| Difference | 3.4% |
Our CPU stress test showed a 3.4% lower power consumption for the 12700K, which is refreshing to see with the power consumption of recent processors only going up. Our rejoicing was short-lived, as this small difference would largely go unnoticed by most gamers.
Price and Value
| CPU | Launch MSRP | Current Price |
|---|---|---|
| Core i7 12700K | 💲409 | 💲254 |
| Core i7 11700K | 💲399 | 💲241 |
| Difference | 2.5% | 5% |
The 5% difference in performance is accompanied by an appropriate 5% difference in price, with the 12700K being a bit more expensive. The difference is small enough that mostly anyone can stretch their budget to get the 12700K over the 11700K.
Final Thoughts
Core i7 11700K: In our testing, this chip held up well against the 12700K. The differences were mostly unnoticeable, and if you play at a higher resolution, both chips would perform identically. We would say you should buy this chip if you find a good deal on it.
Core i7 12700K: The difference in performance was, as said before, mostly negligible going from the older processor to this one, but this fact also holds for the price difference. We would recommend this chip as the defacto option, especially because you can find it cheaper on the used market.
Wrapping it up, you would be happy going for either of the 12700K vs 11700K as the price and performance difference is small enough for most people to not care.
Frequently Asked Questions
The 12700K has 20 threads due to its addition of efficiency cores, whereas the 11700K is left with only 16 threads.
The 12700K uses an LGA 1700 platform, whereas the 11700K uses an LGA 1200 platform.
The 12700K was launched around 7 months after the 11700K.
More From Core i7 12700K
More From Core i7 11700K
Thank you! Please share your positive feedback. 🔋
How could we improve this post? Please Help us. 😔
[Comparisons Expert]
Abdemanaf is a skilled creative writer who has been honing his craft since 2011. While initially working in different fields, he found a passion for technology and has been exploring the tech world since early 2015. Over the years, he has developed an in-depth knowledge of the latest tech trends and product offerings by various companies.
Abdemanaf’s writing reflects his analytical mindset and ability to think critically. He has a knack for breaking down complex technical information into easily digestible pieces, making his articles engaging and accessible to readers from all backgrounds. In February 2022, he joined Tech4Gamers as a blog and product comparison writer, where he has been able to hone his skills further.
As a writer, Abdemanaf is dedicated to staying up-to-date with the latest technological advancements and trends, enabling him to provide readers with the most relevant and accurate information. He is always eager to learn more and is constantly seeking new challenges to improve his skills.
Get In Touch: manaf@tech4gamers.com


