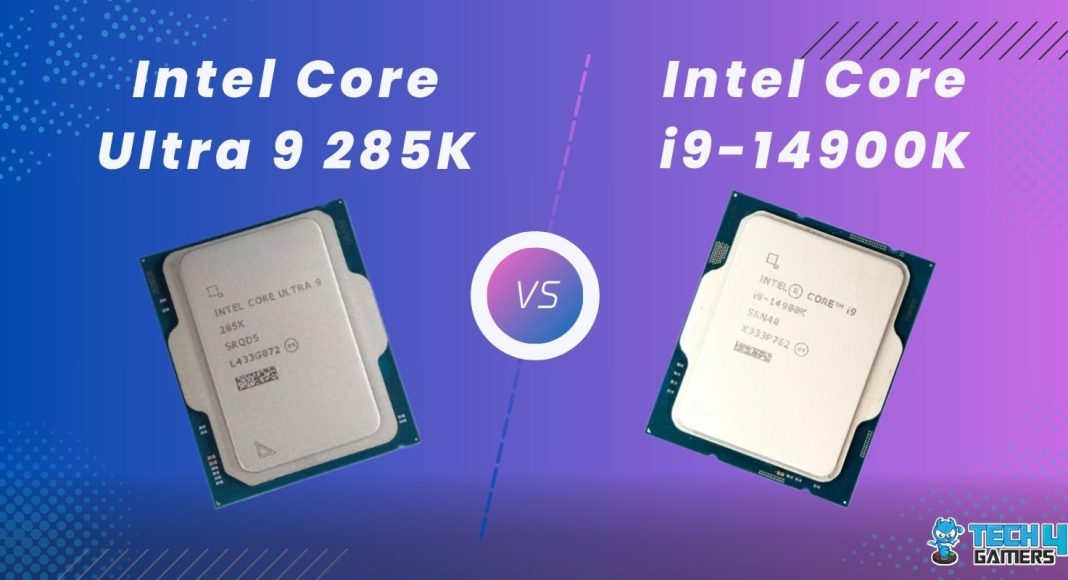
Intel Core Ultra 9 285K Rated: 9.0/10 Intel Core i9-14900K Rated: 9.2/10
Pros And Cons
| CPU | Pros | Cons |
|---|---|---|
| Intel Core Ultra 9 285K | ✅ Improved CPU efficiency ✅ Built-in NPU | ❌ Decline of gaming performance ❌ Costly processor |
| Intel Core i9-14900K | ✅ Great 6.0 GHz boost clock ✅ Better Gaming Performance | ❌ High power draw ❌ Heats up under stress |
Comparison Table
| Feature | Intel Core Ultra 9 285K | Intel Core i9-14900K |
|---|---|---|
| Codename | Arrow Lake | Raptor Lake |
| CPU Cores | P-Cores: 8 E-Cores: 16 Total Cores: 24 | P-Cores: 8 E-Cores: 16 Total Cores: 24 |
| Threads | 24 | 32 |
| CPU Max Turbo Clock | Up to 5.7 GHz | Up to 6.0 GHz |
| Cache | 36MB Intel Smart Cache | 36MB Intel Smart Cache |
| Memory Speed | Up to DDR5 6400 MT/s | Up to DDR5 5600 MT/s Up to DDR4 3200 MT/s |
| TDP | 125-250 watts | 125-253 watts |
| Max. Operating Temperature | 105°C | 100°C |
| Best Motherboards | Best Motherboards For Core Ultra 9 285K | Best Motherboards For Core i9-14900K |
| Best CPU Coolers | Best CPU Coolers for Core Ultra 9 285K | Best CPU Coolers For Core i9-14900K |
| Best RAM | - | Best RAM For Core i9-14900K |
| Best GPU | - | Best GPU For Core i9-14900K |
| Processor Review | Intel Core Ultra 9 285K Review | - |
Architectural Difference
- Architecture: Intel’s latest top-notch Ultra 9 285K CPU uses the avant Arrow Lake architecture with a smaller die, while the Core i9-14900K features Raptor Lake Refresh with a 14 mm² larger die.
- CPU Socket: The Core i9-14900K uses Intel’s FCLGA1700 socket, also found in older Intel processors. The Ultra 9 285K integrates the FCLGA1851 socket, which has 1851 pins for motherboard connections.
- CPU Memory: According to CPU specifications, both processors have a maximum of 192 GB memory with two channels. The Core i9-14900K supports DDR4, while the Ultra 9 285K does not.
- Process Node: Intel’s Ultra 9 285K is fabricated on an advanced 3nm node at TSMC, a remarkable leap forward compared to the dated 10nm process of the Core i9-14900K.
- Clock Speed: The Ultra 9 285K has a 0.5 GHz higher P-Core and 0.8 GHz higher E-Core base clock. It offers a 0.2 GHz higher E-Core turbo cock, while the Core i9-14900K has a 0.1 GHz higher P-Core turbo clock.
- Integrated Graphics: In this latest ultra series, Intel offers Arc Xe-LPG Graphics with the Ultra 9 285K, which performs better than the UHD Graphics 770 provided with the Core i9-14900K.
In late 2024, rather than unveiling its 15th-generation Intel Core i-x processors, Intel introduced an innovative Ultra series, marking a new chapter in the processor world. In this analysis, we will examine the capabilities of the latest premium Core Ultra 9 285K vs Core i9-14900K.
Gaming Benchmarks
The specs do not indicate whether the Ultra 9 285K can outperform the Core i9-14900K, which has a 5.3% higher max turbo clock. To determine the actual performance results, we played eight taxing games at 1080p resolution.
Test Bench
The detailed test system specifications we utilized in our analysis are listed below.
- OS: Windows 11
- GPU: Gigabyte RTX 4090 Gaming OC 24G
- Motherboards: MSI Meg Z790 Ace Max, MSI MPG Z890 Edge Ti WiFi
- RAM: XPG Lancer RGB 32GB 7200MHz DDR5
- SSD: XPG GAMMIX S70 BLADE 2TB NVMe SSD
- PSU: be quiet! Dark Power Pro 13 1300W
- CPU Cooler: Corsair iCUE Link Titan 360 RX RGB
Cyberpunk 2077

- Starting our benchmarks with Cyberpunk 2077, we get 8.73% better average performance using the Core i9-14900K 137 FPS than the Ultra 9 285K 126 FPS.
- The Core i9-14900k managed 97 FPS in the lowest 1% performance, while Ultra 9 285K led with 82 FPS, a 2.07% advantage.
Forza Horizon 5

- The Core I9-14900k average performance in the Forza Horizon 5 session was about 6.01% more promising than the Ultra 9 285K.
- Regarding the low 1% performance, the Core i9-14900k produced only 205 FPS, while the Ultra 9 285K rendered 192 FPS, leading by around 6.7%.
Ghost of Tsushima

- We observed a 4.4% average performance boost using the Intel Ultra 9 285K 180 FPS compared to the Intel Core i9-14900K 188 FPS.
- At the 1% low mark in Ghost of Tsushima, the Intel Core i9-14900K achieved the highest FPS of 152, while the Intel Ultra 9 285K had 137 FPS, a 1.09% lead.
Hogwarts Legacy

- Our Hogwarts Legacy tests show the Core i9-14900K outperforms the Ultra 9 285K by an average of 3.8%, producing an 81 FPS average compared to 78 FPS.
- The Ultra 9 285K hit 66 FPS at the low 1% during this gameplay, while the Core i9-14900k reached 67 FPS, a 1.5% gain.
Red Dead Redemption 2

- For Red Dead Redemption 2, we get a 3.4% better average performance using the Core i9-14900K 183 FPS, while the Ultra 9 285K rendered 177 FPS.
- At the 1% low, both give almost the same FPS average from Core i9-14900K 139 FPS and Ultra 9 285K 135 FPS.
Silent Hill 2

- For Silent Hill 2, the Core i9-14900K gives around 1.91% better performance. The Core I9-14900K provides an average of 160 FPS, while the Ultra 9 285K renders 157 FPS on average.
- At the low 1%, the Core i9-14900K 84 FPS had better performance than the Ultra 9 14900k 79 FPS, a 6.3% advantage.
Starfield

- While playing Starfield, the Ultra 9 285K mustered an average of 149 FPS, 4.19% better than the Core i9-14900K 143 FPS.
- The Core i9-14900k achieves around 72 FPS in the 1% lowest frame rates, while the Ultra 9 285K slightly surpasses it with 78 FPS, an 8.3% edge.
The Witcher 3: Wild Hunt

- During The Witcher 3: Wild Hunt session, we noticed that the Core i9-14900k offers a performance benefit of 7.8% by averaging 111 FPS, while Ultra 9 285K provides 103 FPS.
- In the Low % performance times, the Core i9-14900k mustered around 81 FPS, while the Ultra 9 285K managed around 67 FPS in this game.
Productivity Benchmarks
In our gaming benchmarks, the Core i9-14900K demonstrated unrivaled dominance. Now, let’s examine performance trends in productivity tasks for the Ultra 9 285K Vs Core i9-14900K.
Cinebench R24

- Based on our Cinebench R24 test, the Core i9-14900K had a lower single-core performance, achieving 138 scores, around 7.24% behind the Ultra 9 285K’s 148 scores.
- For the multi-core performance, the Ultra 9 285K scored 2511 points, surpassing the Core i9-14900K’s 2003 points by 25.3%.
Geekbench 6

- The Core i9-14900K achieved a single-core score of 3216 points in the Geekbench 6 test, roughly 2.3% lower than the 3291 points the Ultra 9 285K scored.
- The Core i9-14900K achieved an impressive 21585 points in multi-core performance. However, it trailed the Ultra 9 285K’s 22886 points, marking a striking 6.02% lead.
7-Zip Stress Test

- In our 7-Zip compression test, the Ultra 9 285K and the Core i9-14900K had almost equivalent performance, with an advantage of only 0.5% for the Core Ultra 9 285K.
- The Core i9-14900K demonstrated superior decompression performance, achieving a score of 226 points, around 6.6% higher than the 212 points recorded by the Ultra 9 285K.
Overall Performance
| Stats | Intel Core Ultra 9 285K | Intel Core i9-14900K |
|---|---|---|
| Average FPS | 📈 142.0 | 📈 160.2 |
| Low 1% FPS | 📉 104.5 | 📉 112.1 |
| Productivity | ✏️ 9.3 | ✏️ 8.9 |
| Winner: Intel Core i9-14900K | ||
Average Frame Rate
Our gaming benchmarks, contrasting the Ultra 9 285K vs Core i9-14900K at 1080p, revealed the Core i9-14900K’s exceptional performance, consistently outperforming the Ultra 9 285K and securing a remarkable 12.8% lead on average. The Core Ultra 9 285K proved to be better in only Starfield.
Low 1% Frame Rate
Considering the worst 1% performance data for the above-tested games, we conclude that the Core i9-14900K delivers around 7.3% higher performance than the Ultra 9 285K at the low 1%.
Productivity Performance
Based on our productivity tests, the Core Ultra 9 285K is approximately 4.5% more efficient than the Core i9-14900K, demonstrating its ability to handle demanding workloads.
Power Efficiency
| Game | Intel Core Ultra 9 285K (W) | Intel Core i9-14900K (W) |
|---|---|---|
| Cyberpunk 2077 | 116 | 155 |
| Forza Horizon 5 | 87 | 116 |
| Ghost of Tsushima | 65 | 85 |
| Hogwarts Legacy | 72 | 100 |
| Red Dead Redemption 2 | 96 | 133 |
| Silent Hill 2 | 68 | 105 |
| Starfield | 132 | 174 |
| The Witcher 3: Wild Hunt | 91 | 124 |
| Average Gaming Power Draw | 90.9 ⚡ | 124.0 ⚡ |
| Winner: Intel Core Ultra 9 285K | ||
Thanks to its more efficient architecture, the Intel Core Ultra 9 285K demonstrated relatively better power efficiency than the Intel Core i9-14900K. With a 36.4% reduction in power consumption in our benchmarks, the Ultra 9 285K stands out as the more power-efficient option.
Thermal Efficiency
| Game | Intel Core Ultra 9 285K (°C) | Intel Core i9-14900K (°C) |
|---|---|---|
| Cyberpunk 2077 | 56 | 64 |
| Forza Horizon 5 | 51 | 58 |
| Ghost of Tsushima | 48 | 52 |
| Hogwarts Legacy | 53 | 53 |
| Red Dead Redemption 2 | 48 | 60 |
| Silent Hill 2 | 47 | 53 |
| Starfield | 59 | 67 |
| The Witcher 3: Wild Hunt | 54 | 59 |
| Average Gaming Temperature | 52.0 🌡️ | 58.2 🌡️ |
| Winner: Intel Core Ultra 9 285K | ||
During our testing, the power-hungry Core i9-14900K consistently ran, on average, 11.9% hotter than the Ultra 9 285K. Nevertheless, both processors managed to maintain optimal operating temperatures, ensuring safe performance throughout the testing period.
Price And Value
| Prices | Intel Core Ultra 9 285K | Intel Core i9-14900K | Price Difference |
|---|---|---|---|
| Launch MSRP | 💲589 | 💲589 | 0.0% |
| Current Price | 💲589 | 💲433 | 36.0% |
Since its launch, the Core i9-14900K has experienced a significant price drop, while the Ultra 9 285K, a new CPU, has held its launch price. These processors are readily available in the market. However, assessing the performance relative to its cost, the Core i9-14900K offers more value today.
What We Recommend?
Core Ultra 9 285K: The Core Ultra 9 285K distinguishes itself in productivity tasks, smoothly dominating in demanding workloads. This processor has higher operating efficiency, and its memory performance further elevates its prowess. It exclusively supports the advanced DDR5.
Core i9-14900K: The Core i9-14900K is the pinnacle of gaming performance, outshining most contemporary gaming processors. Due to its age, this processor is now available at a reduced price while offering excellent performance.
Our comprehensive analysis of the Ultra 9 285K vs Core i9-14900K recommends the Core i9-14900K for gamers seeking unparalleled gaming performance. The Core Ultra 9 285K is the better choice for users who demand more productivity.
No. The latest Ultra series of Intel processors does not support DDR4 memory. However, you can use the DDR4 memory with the Core i9-14900K. No. The Ultra 9 285K features a more powerful Arc Xe-LPG iGPU. In contrast, the Core i9-14900K includes the older UHD Graphics 770. The Core Ultra 9 285K has a modern FCLGA1851 socket. You need a Z890 motherboard for the Core Ultra 9 285K. Yes, both of these processors are equipped with hyperthreading capabilities. The Core i9-14900K features a specialized Intel Hyper-Threading Technology. Yes, the Intel Core Ultra 9 285K can be overclocked due to its unlocked multiplier.Frequently Asked Questions
More From Intel Core Ultra 9 285K:
- Core Ultra 9 285K Vs Ryzen 9 9900X
- Core Ultra 9 285K Vs Ryzen 9 7950X3D
- Core Ultra 9 285K Vs Core Ultra 7 265K
More From Intel Core i9-14900K:
Thank you! Please share your positive feedback. 🔋
How could we improve this post? Please Help us. 😔
[Comparisons Expert]
Abdemanaf is a skilled creative writer who has been honing his craft since 2011. While initially working in different fields, he found a passion for technology and has been exploring the tech world since early 2015. Over the years, he has developed an in-depth knowledge of the latest tech trends and product offerings by various companies.
Abdemanaf’s writing reflects his analytical mindset and ability to think critically. He has a knack for breaking down complex technical information into easily digestible pieces, making his articles engaging and accessible to readers from all backgrounds. In February 2022, he joined Tech4Gamers as a blog and product comparison writer, where he has been able to hone his skills further.
As a writer, Abdemanaf is dedicated to staying up-to-date with the latest technological advancements and trends, enabling him to provide readers with the most relevant and accurate information. He is always eager to learn more and is constantly seeking new challenges to improve his skills.
Get In Touch: manaf@tech4gamers.com


![Core i7 11700K Vs Core i5 12600K [7 Games Tested]](https://tech4gamers.com/wp-content/uploads/2023/01/Intel-Core-i7-11700K-Vs-Intel-Core-i5-12600K.jpg)
