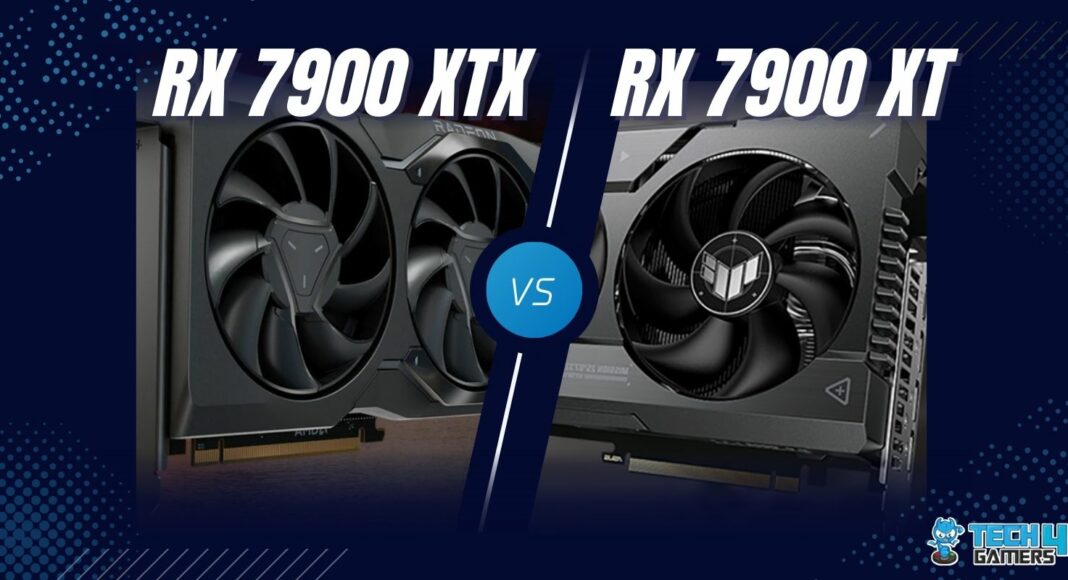
AMD Radeon RX 7900 XTX
Rated: 8.7/10
AMD Radeon RX 7900 XT
Rated: 8.6/10
Pros And Cons
| GPU | Pros | Cons |
|---|---|---|
| RX 7900 XTX | ✅Superior gaming performance ✅24GB VRAM | ❌High power consumption |
| RX 7900 XT | ✅Affordable option ✅Power efficient | ❌Lower performance |
- The RX 7900 XTX outperforms the RX 7900 XT by 15% in gaming benchmarks, especially at 4K resolution.
- The RX 7900 XT is more power-efficient, consuming 12% less power than the RX 7900 XTX, and also more thermally efficient.
- The RX 7900 XTX is priced at $930, while the RX 7900 XT is $899, making it 3.4% cheaper.
- For superior performance and content creation, RX 7900 XTX is ideal, while RX 7900 XT offers great value for 4K gaming on a budget.
Comparison Table
| Specs | Radeon RX 7900 XTX | Radeon RX 7900 XT |
|---|---|---|
| Architecture | RDNA 3 | RDNA 3 |
| GPU Name | Navi 31 XTX | Navi 31 XT |
| Bus Interface | PCIe 4.0 x16 | PCIe 4.0 x16 |
| RT Cores | 96 | 84 |
| TMUs | 384 | 336 |
| Best Variants | Best RX 7900 XTX Cards | Best RX 7900 XT Cards |
Architectural Differences
- Architecture: Both the Radeon RX 7900 XTX and RX 7900 XT utilize AMD’s RDNA 3 architecture.
- Clock Speed: RX 7900 XTX boasts higher clock speeds, with a base of 1855 MHz and a boost of 2499 MHz, compared to RX 7900 XT’s 1500 MHz base and 2394 MHz boost.
- VRAM: RX 7900 XTX offers 24 GB of GDDR6 memory, more than RX 7900 XT’s 20 GB.
- Process Size: Both GPUs are manufactured using TSMC’s 5 nm processing node, ensuring efficient performance.
- TDP: Despite its impressive performance, the RX 7900 XTX exhibits a higher thermal design power of 355 watts compared to the RX 7900 XT’s TDP of 300 watts.
AMD’s Radeon RX 7900 XTX vs RX 7900 XT, both have great features and ratings, so deciding between them is tricky. This article looks closely at these GPUs, checking out things like how they’re built, how well they run games, how much power they use, how cool they stay, and how much they cost.
Gaming Performance Benchmarks
Now, we will let these GPUs lock horns against each other in some of the latest recent games in two different resolutions. This will give us a better understanding of how these GPUs perform against each other in the task we buy them for.
Testing Rig
- CPU: Intel Core i7 13700k
- Motherboard: MSI MEG Z790 ACE MAX Motherboard
- CPU Cooler: Deepcool Assassin II CPU Cooler
- RAM: Patriot Viper LED DDR4-3600 16GB RAM
- SSD: XPG GAMMIX S70 BLADE 2TB NVMe SSD
- PSU: ENERMAX REVOLUTION D.F. X 1050W
Cyberpunk 2077

- In Cyberpunk gaming sessions, the performance difference is 16%. The 7900 achieved 70 FPS, while the 7900 XT managed around 59 FPS.
- The 7900 XTX outperformed by around 20%, maintaining 1% lows at about 54 FPS, whereas the 7900 XT maintained 44 FPS.
Watch Dogs Legion

- In this session, the 7900 XTX maintains a solid 120 FPS experience, whereas the 7900 XT averages around 100 FPS, which is a performance difference of 18% almost.
- Notably, the gameplay feels smoother on the 7900 XTX, boasting a 25% lead in terms of 1% lows, with an average of 96 FPS. While the 7900 XT manages only 74 FPS.
Call Of Duty Warzone 2

- In Call of Duty Warzone 2, the 7900 XTX averaged 155 FPS, a significant leap from the 129 FPS of the 7900 XT, lagging 18% behind.
- Moreover, the 7900 XTX showcased superior smoothness with a 30% lead in 1% lows, averaging at 124 FPS compared to the 92 FPS of the 7900 XT.
Hitman 3

- In the Hitman 3 benchmark, the 7900 XTX surged ahead comfortably with 162 FPS, surpassing the 7900 XT by 16%, which managed only 138 FPS.
- Furthermore, the 7900 XTX maintained its dominance with a 26% lead in 1% lows, averaging around 135 FPS, while the 7900 XT struggled at 104 FPS.
Red Dead Redemption 2

Assassin’s Creed Valhalla

- In the Assassin’s Creed Valhalla, the 7900 XTX maintained its lead with an average of 115 FPS, outperforming the 7900 XT by 18%, which managed 96 FPS.
- In terms of 1% lows, the margin was narrower at 12%, with the 7900 XTX still ahead. It achieved 83 FPS compared to the 7900 XT’s 73 FPS, a difference of 10 frames.
Dying Light 2

- In Dying Light 2, the 7900 XT averaged 82 FPS, while the 7900 XTX maintained a stable 65 FPS, holding a 23% lead.
- Furthermore, the gap widened at 1% lows, with the 7900 XTX leading by 31.1%, delivering smoother gameplay at 66 FPS compared to the 48 FPS of the 7900 XT.
Far Cry 6

- In the Far Cry 6 benchmark, the 7900 XTX delivered 151 FPS, while the 7900 XT trailed behind at 129 FPS, resulting in a 15% advantage for the XTX.
- Additionally, 1% lows were notably better on the 7900 XTX, reaching 123 FPS compared to the 92 FPS on the 7900 XT, showcasing a 28% lead for the XTX.
Overall Gaming Performance
| Featured | RX 7900 XTX | RX 7900 XT |
|---|---|---|
| Average FPS | 124📈 | 103📈 |
| %1 lows | 98📉 | 76.8📉 |
| Winner: AMD's RX 7900 XTX | ||
The performance difference is wide, with the 7900 XTX surpassing the 7900 XT by approximately 18.502%. Across a range of 8 tested titles, the 7900 XTX averaged 124 FPS, while the 7900 XT managed an average of 103 FPS. Notably, in 1% lows, the 7900 XTX exhibited a 24.25% lead over the 7900 XT, with respective averages of 98 FPS and 76.8 FPS.
Power Consumption
| Featured | RX 7900 XTX (W) | RX 7900 XT (W) |
|---|---|---|
| Average Power Consumption | 597⚡️ | 529⚡️ |
| Winner: AMD's RX 7900 XT | ||
The overall power consumption of our system with the RX 7900 XTX was approximately 597 watts, whereas with the RX 7900 XT, it averaged around 529 watts. Despite a 6% difference in suggested PSU limits between the CPUs, the 7900 XT system consumed 12% less power.
Thermal Efficiency
| Featured | RX 7900 XTX (°C) | RX 7900 XT (°C) |
|---|---|---|
| Average Temperature | 69🌡️ | 67.8🌡️ |
| Winner: AMD's RX 7900 XT | ||
The thermal efficiency of the 7900 XTX was slightly better than the 7900 XT, with the XTX running at an average temperature of 69°C during gaming benchmarks compared to the XT’s average of 67.8°C. This translates to a little lead of 1.75% in thermal efficiency for the 7900 XTX.
Pricing And Availability
| GPU | MSRP | Current Price |
|---|---|---|
| RX 7900 XTX | 💲999 | 💲930 |
| RX 7900 XT | 💲899 | 💲899 |
| Difference | 10.5% | 3.4% |
As of now, the 7900 XTX is priced at $930, whereas the RX 7900 XT sits at $899, resulting in a 3.4% disparity in pricing between the two graphics cards.
Final Verdict – What We Recommend?
AMD Radeon RX 7900 XTX: Radeon RX 7900 XTX emerges as a winner, boasting impressive gaming performance and outperforming its counterpart, the RX 7900 XT, by a significant 15% in gaming benchmarks. The RX 7900 XTX proves to be the ideal choice for those seeking superior performance.
AMD Radeon RX 7900 XT: Radeon RX 7900 XT still offers commendable value, especially for budget-conscious gamers aiming for 4K gaming experiences. Despite falling short in raw gaming power compared to the XTX variant, the RX 7900 XT shines in terms of power efficiency, consuming 12% less power and maintaining better thermal efficiency.
Overall, for users prioritizing uncompromising performance and content creation capabilities, the AMD Radeon RX 7900 XTX stands out as the top choice. However, for gamers on a budget looking to experience 4K gaming, the AMD Radeon RX 7900 XT offers excellent value.
More From RX 7900 XTX
More from RX 7900 XT:
Thank you! Please share your positive feedback. 🔋
How could we improve this post? Please Help us. 😔
[Comparisons Specialist]
I’m a passionate computer hardware expert specializing in CPUs and GPUs. With a lifelong curiosity for hardware and extensive hands-on experience, I provide valuable insights, practical advice, and in-depth analysis on these components. Engaging with the hardware community, I exchange knowledge and stay at the forefront of technological advancements.
Get In Touch: uzair@tech4gamers.com


![RTX 4070 Vs RX 7900 XTX: Which Is Better [Tested]](https://tech4gamers.com/wp-content/uploads/2023/04/Comparison-7-218x150.jpg)
![Core i9-13900KF Vs Ryzen 9 7900X3D [We Tested Both]](https://tech4gamers.com/wp-content/uploads/2023/03/Core-i9-13900KF-vs-Ryzen-9-7900X3D-218x150.jpg)

