GuidesComparisonsRX 7900 GRE Vs RX 6800 XT: 6 Games Tested

RX 7900 GRE Vs RX 6800 XT: 6 Games Tested

My comparison will pin the RX 6800 XT against the RX 7900 GRE to see the differences in architecture, gaming performance, and power consumption between these two very similar cards.

Today, I’ll compare one of AMD’s latest offerings, the RX 7900 GRE with a much older card, namely the RX 6800 XT to see how both the RX 7900 GRE vs RX 6800 XT will perform. Did the old card lose its edge in 2024? You’ll find out in this extensive comparison.

Key Takeaways

  • I’ve observed that the RX 7900 GRE performed 8% better than the RX 6800 XT, especially excelling in ray tracing.
  • In my observation, the RX 6800 XT drew about 70 watts more power than the RX 7900 GRE despite the lower performance.
  • I recommend the RX 6800 XT because of its relatively close performance and for its wider availability.
Why Trust Tech4Gamers
  • Abde Manaf is our comparison expert who has been benchmarking graphics cards, and processors.
  • 100+ components tested and reviewed by our team of hardware experts (Tech4Gamers Team).
  • 100+ hours spent testing different components for our comparisons.
  • Objective testing criteria (See how we compare PC hardware).

At Tech4Gamers, ensuring you get reliable information is our priority. That’s why every hardware round-up undergoes a meticulous review process by our team of experts and editors. Each review is carefully examined against our strict editorial guidelines, guaranteeing you trustworthy insights you can depend on.

Comparison Table

Technical SpecsRX 6800 XTRX 7900 GRE
ArchitectureRDNA 2RDNA 3.0
CUDA Cores46085120
RT Cores7280
Launch DateNov 18th, 2020Jul 27th, 2023
MSRP$500$650
Best VariantsBest RX 6800 XT

Architectural Differences

  • Clock Speed: The RX 6800 XT boasts a higher base clock at 1825 MHz compared to the RX 7900 GRE’s 1500 MHz. Additionally, the RX 6800 XT has a slightly higher boost clock at 2250 MHz, while the GRE features a slightly lower boost clock at 2245 MHz.
  • Process Node: The RX 6800 XT employs a 7nm process, while the RX 7900 GRE has a combination of 5nm and 6nm transistors.
  • TDPThe RX 7900 GRE has a rated TDP of 260W, a smidge higher than the RX 6800 XT’s 250W. We suggest a 600W and 650W PSU for both cards respectively.
  • VRAM: To further cement that both cards are more alike than different, the RX 7900 GRE and the RX 6800 XT have the same VRAM buffer of 16GB.
  • Bus Width & Memory Bandwidth: Both cards have the same bus width of 256-bit. The RX 6800 XT and the RX 7900 GRE consist of 512GB/s and 576GB/s memory bandwidth.
  • Other Features: The RX 7900 GRE’s advanced RT cores minimize ray tracing performance loss, outperforming the first-gen RT cores on the RX 6800 XT. Both cards support AMD’s FSR for improved gaming experiences.

RX 6800 XT Vs RX 7900 GRE: Gaming Benchmarks

Now, that the specifications are out of the way, let’s look at the gaming benchmarks on these cards at 4K.

Test Rig

The Last Of Us Part 1

The Last Of Us Performance
The Last Of Us @4k (Image By Tech4Gamers)
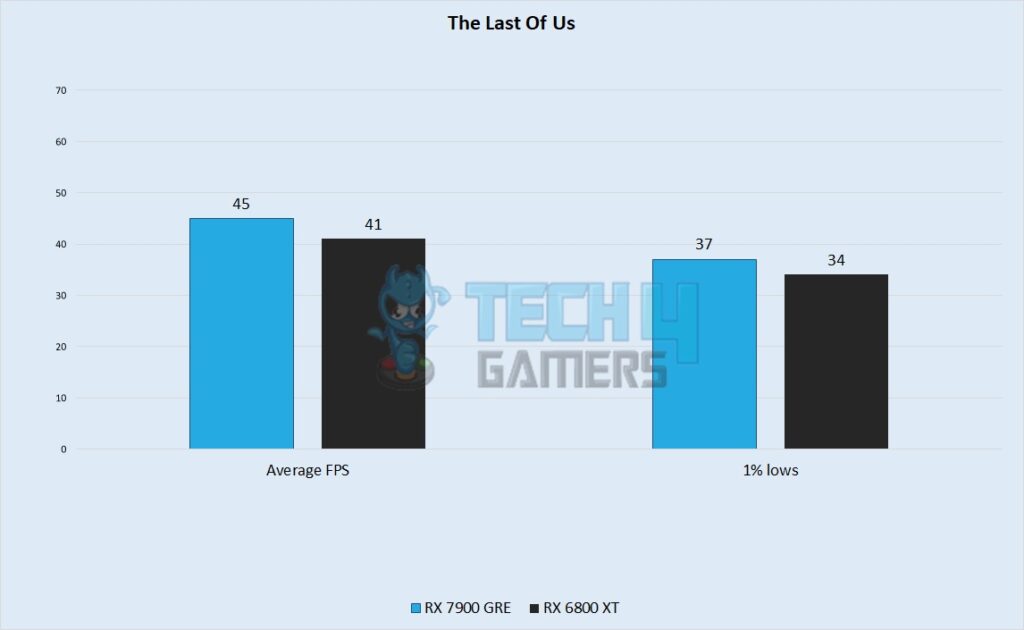
  • In The Last Of Us Part 1, the 7900 GRE is around 45 FPS, just a little bit better than last year’s card at 41 FPS.
  • In my observation, the 1% lows were somehow better on the 6800 XT as it reached around 37 FPS, whereas the 7900 GRE maintained a framerate of 34 FPS.

Resident Evil 4
Resident Evil 4 Performance
Resident Evil 4 @4k (Image By Tech4Gamers)
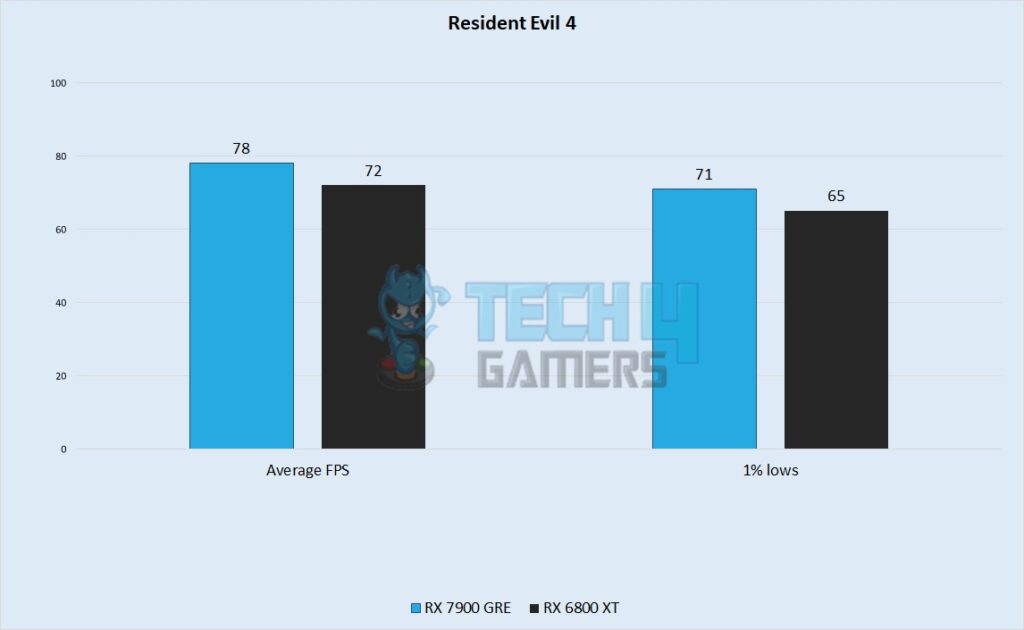
  • In Resident Evil 4, the RX 7900 GRE obtained an average framerate of 78 FPS. In contrast, the RX 6800 XT was just a few frames behind with a performance of 72 FPS.
  • 1% lows were well above 60 FPS across both cards, with the RX 6800 XT obtaining a 65 FPS average, over RX 7900 GRE’s relatively higher 71 FPS.

Forza Horizon 5
Forza Horizon 5 Performance
Forza Horizon 5 @4k (Image By Tech4Gamers)
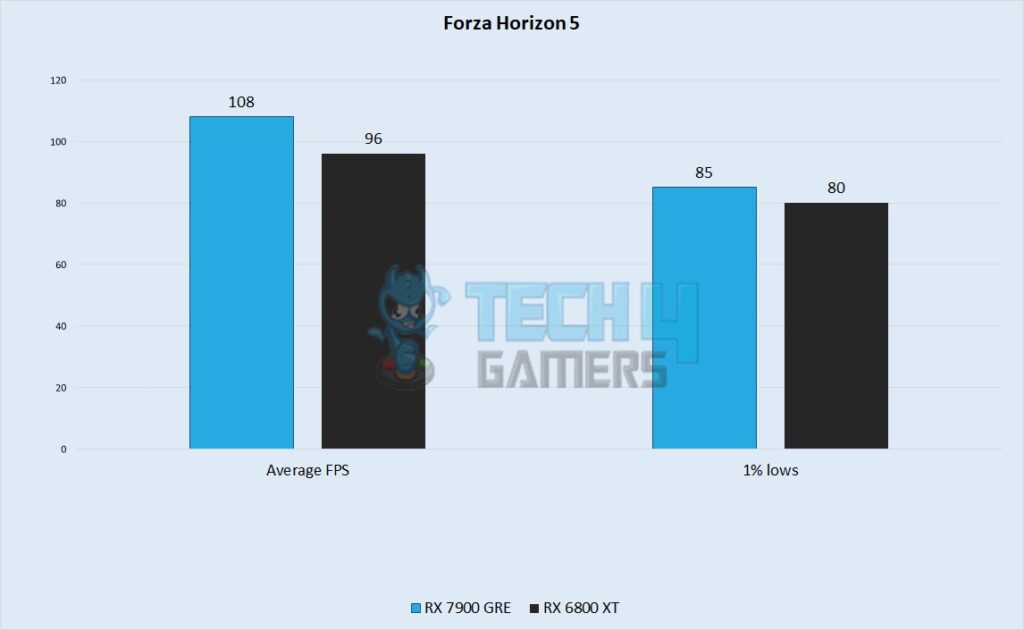
  • Here, the RX 7900 GRE achieved an average framerate of 108 FPS, whereas the RX 6800 XT had an average framerate of around 96 FPS
  • With the RX 6800 XT obtaining 1% lows of 80 FPS, the RX 7900 GRE was a small amount ahead with a performance of 85 FPS as its minimum.

Hogwarts Legacy
Hogwarts Legacy Performance
Hogwarts Legacy @4k (Image By Tech4Gamers)
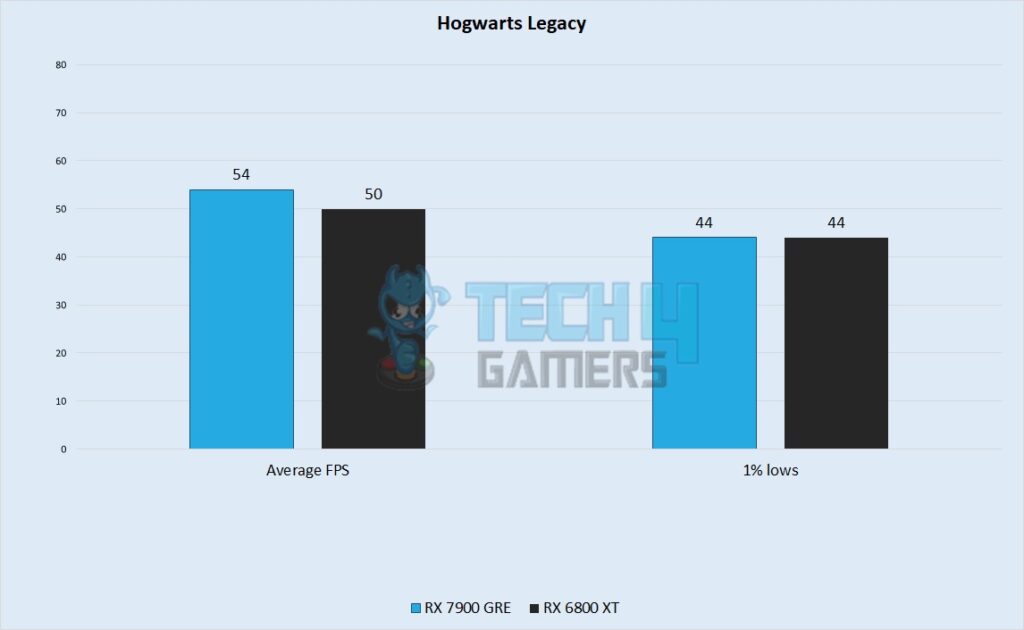
  • The RX 7900 GRE had a higher average of 54 FPS, whereas the RX 6800 XT got an even 50 FPS as its average framerate.
  • 1% lows were identical between the RX 6800 XT and RX 7900 GRE at 44 FPS.

Fortnite
Fortnite Performance
Fortnite @4k (Image By Tech4Gamers)
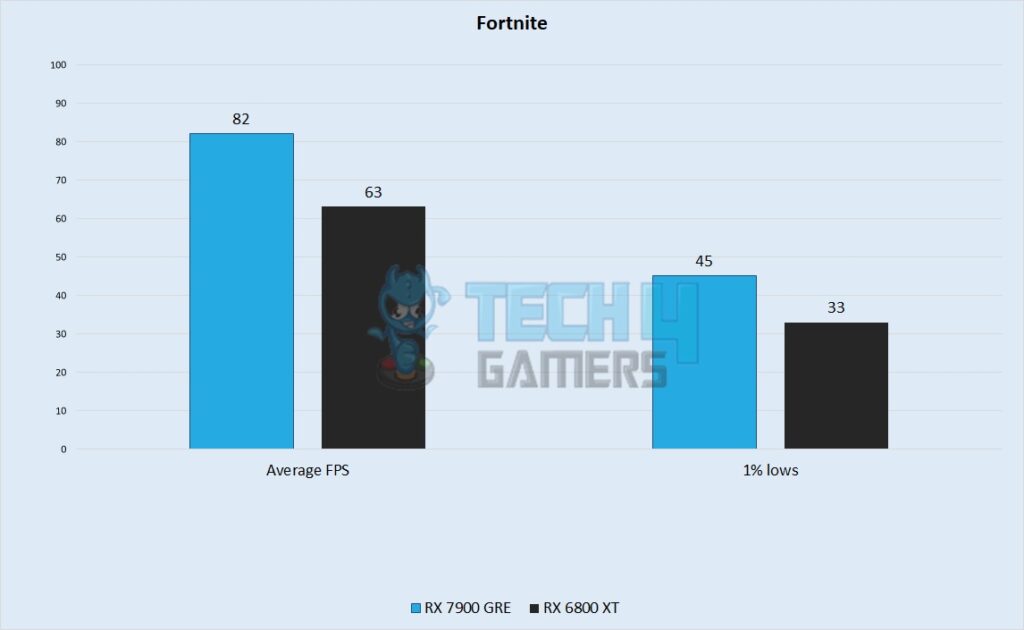
  • The GRE had an average framerate of 82 FPS, whereas the 6800 XT went all the way down to 63 FPS.
  • 1% lows also showed me a substantial advantage that the RX 7900 GRE possesses, as it pumped out 45 FPS as its minimum, whereas the RX 6800 XT had a framerate of around 33 FPS as its minimum.

A Plague Tale Requiem
A Plague Tale Requiem Performance
A Plague Tale Requiem @4k (Image By Tech4Gamers)
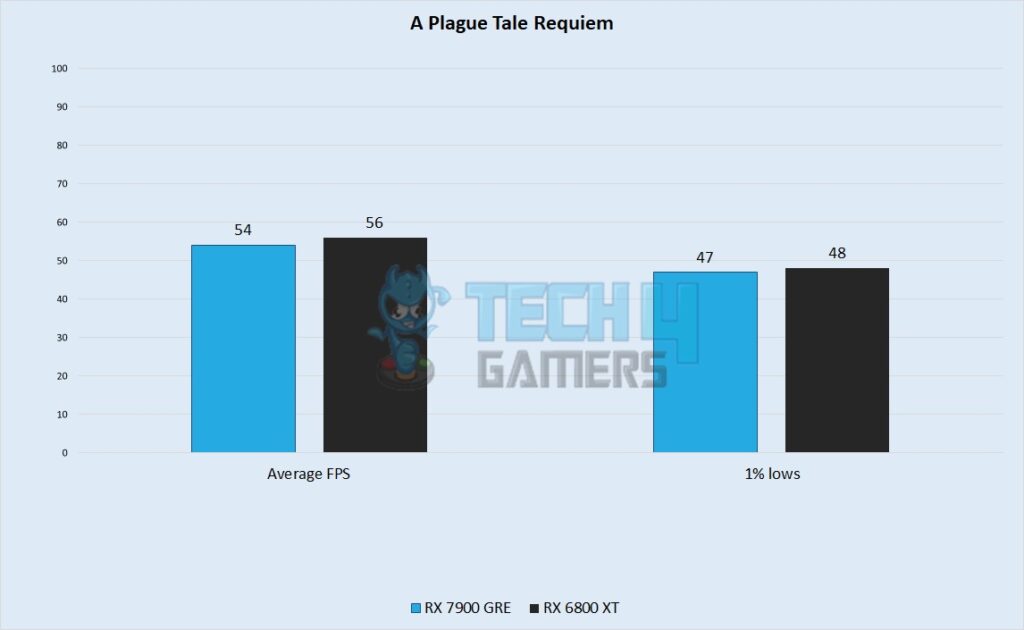
  • For the last game, the RX 6800 XT provided me with a conclusion when it outperformed its newer, higher-end counterpart, by gaining 56 FPS over GRE’s 54 FPS respectively.
  • I observed the RX 6800 XT came out a frame ahead with an average of 48 FPS on 1% lows, whereas the RX 7900 GRE had an average of around 47 FPS.

Overall Gaming Performance
Average FPS Performance
Average FPS @4k (Image By Tech4Gamers)

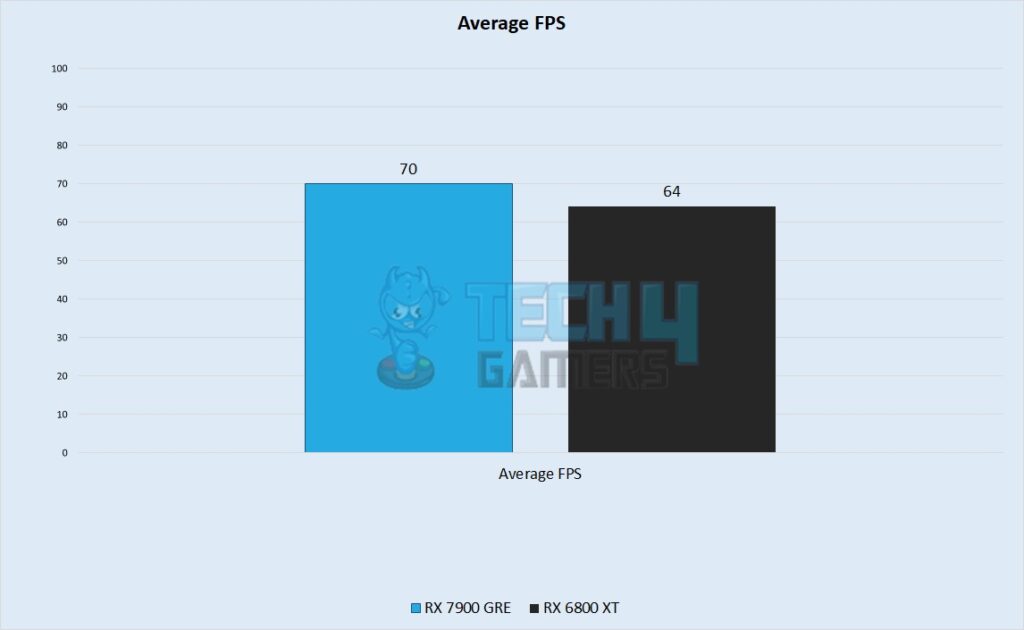
According to my performance tests at 4K with settings turned to the maximum, the RX 7900 GRE had an average framerate of 70 FPS over the 6 games, whereas the RX 6800 XT was recorded close to 64 FPS, which was 8% slower than the RX 7900 XT.

Power Consumption
Power Consumption
Power Consumption @4K (Image By Tech4Gamers)

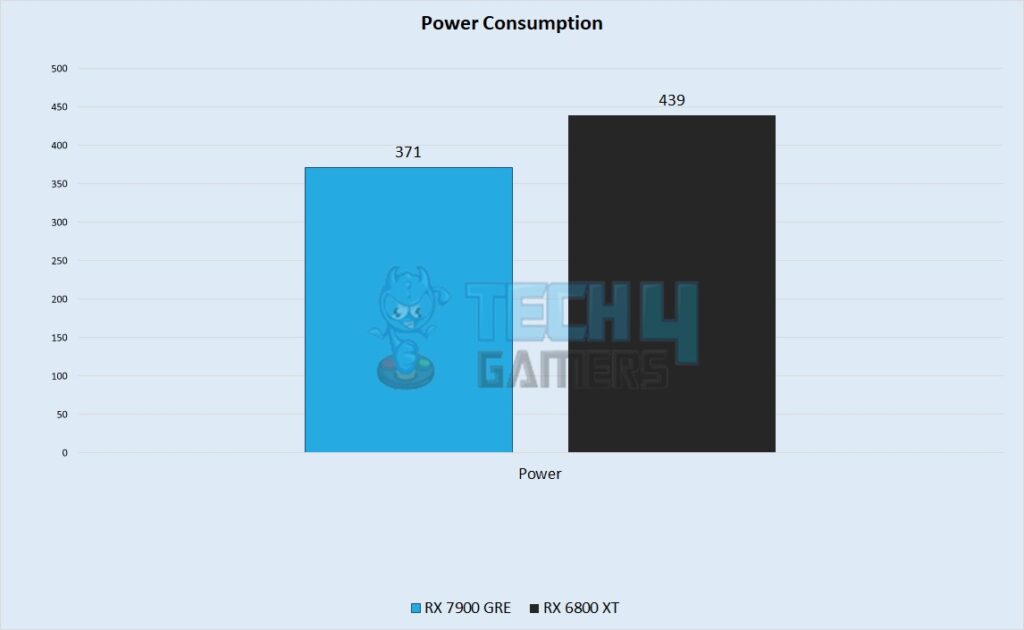
The newer card excelled in its power efficiency as the RX 7900 GRE drew 371 watts of power on average, whereas the RX 6800 XT drew around 439 watts on average. This showed me that the RX 7900 GRE drew approximately 70 watts less than the RX 6800 XT.

Price And Availability

The RX 6800 XT goes for around $430 to $600 while the RX 7900 GRE is now being sold at a price point of $663, but it has only broken the market in China as of yet, whereas the only way to get it elsewhere is to get it inside a computer from a prebuilt PC retailer.

RX 6800 XT Vs RX 7900 GRE: My Recommendations

I recommend you RX 6800 XT as it is widely available, unlike its rival whose availability is still a common issue. Furthermore, its performance is very close to its rival and the slight performance gap on the RX 6800 XT can be eliminated by using FSR which will grant you extra frame rates.

Pros And Cons

CPUProsCons
RX 7900 GREBetter performance
Better ray tracing performance
More expensive
RX 6800 XTBetter price-to-performance ratioLower performance

Frequently Asked Questions

What power supply should I use with the RX 6800 XT?

A 700-watt power supply can comfortably support the RX 6800 XT along with any  CPU you throw at it.

What does the FP32 performance of the RX 6800 XT look like?

The RX 6800 XT can do 20.74 TFLOPS of FP32 compute.

How many RT cores that the RX 7900 GRE have?

The RX 7900 GRE has 80 2nd gen RT cores.


More From RX 7900 GRE

More From RX 6800 XT

Was our article helpful? 👨‍💻

Thank you! Please share your positive feedback. 🔋

How could we improve this post? Please Help us. 😔

Gear Up For Latest News

Get exclusive gaming & tech news before it drops. Sign up today!

Today, I’ll compare one of AMD’s latest offerings, the RX 7900 GRE with a much older card, namely the RX 6800 XT to see how both the RX 7900 GRE vs RX 6800 XT will perform. Did the old card lose its edge in 2024? You’ll find out in this extensive comparison.

Key Takeaways

  • I’ve observed that the RX 7900 GRE performed 8% better than the RX 6800 XT, especially excelling in ray tracing.
  • In my observation, the RX 6800 XT drew about 70 watts more power than the RX 7900 GRE despite the lower performance.
  • I recommend the RX 6800 XT because of its relatively close performance and for its wider availability.
Why Trust Tech4Gamers
  • Abde Manaf is our comparison expert who has been benchmarking graphics cards, and processors.
  • 100+ components tested and reviewed by our team of hardware experts (Tech4Gamers Team).
  • 100+ hours spent testing different components for our comparisons.
  • Objective testing criteria (See how we compare PC hardware).

At Tech4Gamers, ensuring you get reliable information is our priority. That’s why every hardware round-up undergoes a meticulous review process by our team of experts and editors. Each review is carefully examined against our strict editorial guidelines, guaranteeing you trustworthy insights you can depend on.

Comparison Table

Technical SpecsRX 6800 XTRX 7900 GRE
ArchitectureRDNA 2RDNA 3.0
CUDA Cores46085120
RT Cores7280
Launch DateNov 18th, 2020Jul 27th, 2023
MSRP$500$650
Best VariantsBest RX 6800 XT

Architectural Differences

  • Clock Speed: The RX 6800 XT boasts a higher base clock at 1825 MHz compared to the RX 7900 GRE’s 1500 MHz. Additionally, the RX 6800 XT has a slightly higher boost clock at 2250 MHz, while the GRE features a slightly lower boost clock at 2245 MHz.
  • Process Node: The RX 6800 XT employs a 7nm process, while the RX 7900 GRE has a combination of 5nm and 6nm transistors.
  • TDPThe RX 7900 GRE has a rated TDP of 260W, a smidge higher than the RX 6800 XT’s 250W. We suggest a 600W and 650W PSU for both cards respectively.
  • VRAM: To further cement that both cards are more alike than different, the RX 7900 GRE and the RX 6800 XT have the same VRAM buffer of 16GB.
  • Bus Width & Memory Bandwidth: Both cards have the same bus width of 256-bit. The RX 6800 XT and the RX 7900 GRE consist of 512GB/s and 576GB/s memory bandwidth.
  • Other Features: The RX 7900 GRE’s advanced RT cores minimize ray tracing performance loss, outperforming the first-gen RT cores on the RX 6800 XT. Both cards support AMD’s FSR for improved gaming experiences.

RX 6800 XT Vs RX 7900 GRE: Gaming Benchmarks

Now, that the specifications are out of the way, let’s look at the gaming benchmarks on these cards at 4K.

Test Rig

The Last Of Us Part 1

The Last Of Us Performance
The Last Of Us @4k (Image By Tech4Gamers)
  • In The Last Of Us Part 1, the 7900 GRE is around 45 FPS, just a little bit better than last year’s card at 41 FPS.
  • In my observation, the 1% lows were somehow better on the 6800 XT as it reached around 37 FPS, whereas the 7900 GRE maintained a framerate of 34 FPS.

Resident Evil 4

Resident Evil 4 Performance
Resident Evil 4 @4k (Image By Tech4Gamers)
  • In Resident Evil 4, the RX 7900 GRE obtained an average framerate of 78 FPS. In contrast, the RX 6800 XT was just a few frames behind with a performance of 72 FPS.
  • 1% lows were well above 60 FPS across both cards, with the RX 6800 XT obtaining a 65 FPS average, over RX 7900 GRE’s relatively higher 71 FPS.

Forza Horizon 5

Forza Horizon 5 Performance
Forza Horizon 5 @4k (Image By Tech4Gamers)
  • Here, the RX 7900 GRE achieved an average framerate of 108 FPS, whereas the RX 6800 XT had an average framerate of around 96 FPS
  • With the RX 6800 XT obtaining 1% lows of 80 FPS, the RX 7900 GRE was a small amount ahead with a performance of 85 FPS as its minimum.

Hogwarts Legacy

Hogwarts Legacy Performance
Hogwarts Legacy @4k (Image By Tech4Gamers)
  • The RX 7900 GRE had a higher average of 54 FPS, whereas the RX 6800 XT got an even 50 FPS as its average framerate.
  • 1% lows were identical between the RX 6800 XT and RX 7900 GRE at 44 FPS.

Fortnite

Fortnite Performance
Fortnite @4k (Image By Tech4Gamers)
  • The GRE had an average framerate of 82 FPS, whereas the 6800 XT went all the way down to 63 FPS.
  • 1% lows also showed me a substantial advantage that the RX 7900 GRE possesses, as it pumped out 45 FPS as its minimum, whereas the RX 6800 XT had a framerate of around 33 FPS as its minimum.

A Plague Tale Requiem

A Plague Tale Requiem Performance
A Plague Tale Requiem @4k (Image By Tech4Gamers)
  • For the last game, the RX 6800 XT provided me with a conclusion when it outperformed its newer, higher-end counterpart, by gaining 56 FPS over GRE’s 54 FPS respectively.
  • I observed the RX 6800 XT came out a frame ahead with an average of 48 FPS on 1% lows, whereas the RX 7900 GRE had an average of around 47 FPS.

Overall Gaming Performance

Average FPS Performance
Average FPS @4k (Image By Tech4Gamers)

According to my performance tests at 4K with settings turned to the maximum, the RX 7900 GRE had an average framerate of 70 FPS over the 6 games, whereas the RX 6800 XT was recorded close to 64 FPS, which was 8% slower than the RX 7900 XT.

Power Consumption

Power Consumption
Power Consumption @4K (Image By Tech4Gamers)

The newer card excelled in its power efficiency as the RX 7900 GRE drew 371 watts of power on average, whereas the RX 6800 XT drew around 439 watts on average. This showed me that the RX 7900 GRE drew approximately 70 watts less than the RX 6800 XT.

Price And Availability

The RX 6800 XT goes for around $430 to $600 while the RX 7900 GRE is now being sold at a price point of $663, but it has only broken the market in China as of yet, whereas the only way to get it elsewhere is to get it inside a computer from a prebuilt PC retailer.

RX 6800 XT Vs RX 7900 GRE: My Recommendations

I recommend you RX 6800 XT as it is widely available, unlike its rival whose availability is still a common issue. Furthermore, its performance is very close to its rival and the slight performance gap on the RX 6800 XT can be eliminated by using FSR which will grant you extra frame rates.

Pros And Cons

CPUProsCons
RX 7900 GREBetter performance
Better ray tracing performance
More expensive
RX 6800 XTBetter price-to-performance ratioLower performance

Frequently Asked Questions

What power supply should I use with the RX 6800 XT?

A 700-watt power supply can comfortably support the RX 6800 XT along with any  CPU you throw at it.

What does the FP32 performance of the RX 6800 XT look like?

The RX 6800 XT can do 20.74 TFLOPS of FP32 compute.

How many RT cores that the RX 7900 GRE have?

The RX 7900 GRE has 80 2nd gen RT cores.


More From RX 7900 GRE

More From RX 6800 XT

Was our article helpful? 👨‍💻

Thank you! Please share your positive feedback. 🔋

How could we improve this post? Please Help us. 😔

Related articles

Arc B580 Vs RTX 4060: Here’s What We Found

In this comparison, we’ll explore how the Intel Arc A580 and NVIDIA RTX 4060 measure up in gaming benchmarks, efficiency, and value to see which one edges out in this close competition.

Core i3 12100F vs Ryzen 5 5600X [Full Comparison 2025]

We compared Intel's budget king with AMD's best mid-tier CPU in this: Intel Core i3 12100F vs AMD Ryzen 5 5600x to find which is the best.

RTX 4090 Vs RTX 3080 Ti: Should You Upgrade In 2025?

Our RTX 4090 vs. RTX 3080 Ti guide will tell you all the differences between the two graphics cards by comparing them in all categories.

NVIDIA’s Claim On The RTX 50 Series Performance Simply Doesn’t Hold Up

NVIDIA's claim on the RTX 50 series performance simply doesn't hold up because they used DLSS 4 in the official benchmarks in the announcement

Core Ultra 9 285K vs Ryzen 9 9900X: Our Thoughts

In the Core Ultra 9 285K vs Ryzen 9 9900X comparison, we will look at the performance, power consumption, and price of both these processors.

Similar Guides