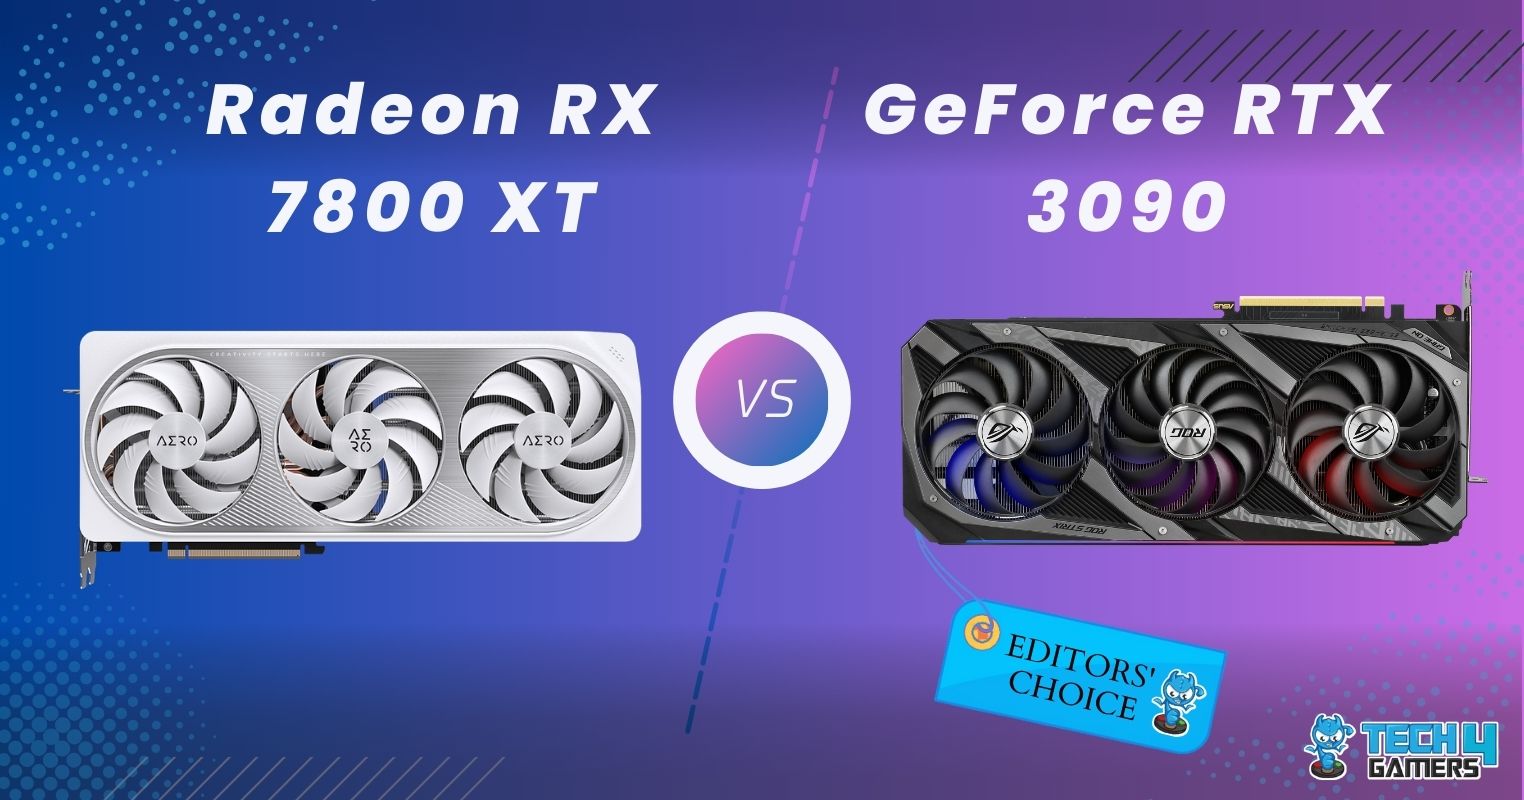
Radeon RX 7800 XT
Rated: 8/10
GeForce RTX 3090
Rated: 9/10
Pros & Cons
| GPU | Pros | Cons |
|---|---|---|
| RTX 3090 | ✅ Great Ray Tracing Skills ✅ Excellent 4K gaming performance | ❌ High Power Consumption ❌ High Price |
| RX 7800 XT | ✅ Fantastic performance in budget ✅ Effective cooling system | ❌ Lags in ray tracing and upscaling ❌ A bit high power draw |
Key Takeaways
- In my hands-on testing of the RTX 3090 and the RX 7800 XT, I found that the RTX 3090 leads performance by about 8.5% during 4K games.
- The RX 7800 XT is about 25% more power efficient. Meanwhile, the RX 7800 XT proved a 20.0% advantage in thermal efficiency.
- As of December 2023, the RX 7800 XT is currently being retailed for a price of $530, while the RTX 3090 comes at a slightly higher price tag of $1229.
- The RTX 3090 excels for users seeking absolute gaming power, while the RX 7800 XT is a budget-friendly option, delivering strong performance.
Specifications Sheet
| Feature | AMD RX 7800 XT | Nvidia GeForce RTX 3090 |
|---|---|---|
| Shading Units | 3840 (Stream Processors) | 10496 (CUDA Capability: 8.6) |
| Ray Tracing Cores | 60 | 82 |
| Base Clock | 1295 MHz | 1395 MHz |
| Boost Clock | Up to 2430 MHz | Up to 1695 MHz |
| Standard Memory Config | 16GB GDDR6 | 24GB GDDR6X |
| Memory Interface Width | 256-bit | 384-bit |
| Bandwidth | Up to 624 GB/s | Up to 936.2 GB/s |
| Memory Clock / Speed | 2525 MHz 19.4 Gbps effective | 1219 MHz 19.5 Gbps effective |
| GPU TDP | 263W | 350W |
| Launch Date | Sep 06th, 2023 | Sep 24th, 2020 |
| MSRP | $499 | $1499 |
| Best Variants | BEST RX 7800 XT Graphics Cards | BEST RTX 3090 Graphics Cards |
Architectural Difference
- Architecture: The RTX 3090 features Nvidia Ampere architecture, while the RX 7800 XT boosts AMD’s latest RDNA 3.0 architecture with the latest upgrades.
- GPU Chip: We get AMD’s leading Navi 32 chip with the RTX 7800 XT, manufactured using a 5nm node at TSMC. In contrast, the RTX 3090 incorporates the GA102 chip fabricated at an 8nm Samsung node.
- Clock Speed: The RTX 3090 boosts a 100 MHz faster base clock than the RX 7800 XT. However, the RX 7800 XT has a 43.3% higher boost clock because of its advanced architecture.
- VRAM: Regarding the GPU memory, the RTX 3090 provides an 8GB extra VRAM with a larger 384-bit data bus. Additionally, the RTX 3090 has a 50% greater memory bandwidth than the RX 7800 XT.
- Advanced Technologies: Nvidia offered DLSS 2.0 with the RTX 3090. In contrast, the RX 7800 XT presents an advanced version of AMD FidelityFX Super Resolution, the FSR 3. For more details, read Nvidia DLSS Vs AMD FSR.
When I compared the capabilities of the RX 7800 XT with the RTX 4070, the RX 7800 XT was the champ at the end. This article will replace the RTX 4070 with a top-tier 3rd generation Nvidia GPU, the RTX 3090. So, let’s weigh up the RX 7800 XT vs RTX 3090 to determine which GPUs possess superior capabilities.
Gaming Benchmarks – 4K
After thoroughly examining the technical details and architectural differences between the RX 7800 XT vs RTX 3090, let’s focus on how well they perform in challenging games. I played ten taxing games at 4K resolution to check out the performance of these graphics cards. My test system had the following specifications.
Gaming Rig
- OS: Windows 11
- CPU: Intel Core i9-13900K
- Motherboard: ASUS ROG Strix Z790-E Gaming WiFi 6E
- GPU 1: SAPPHIRE NITRO+ Radeon RX 7800 XT 16GB
- GPU 2: ASUS TUF Gaming GeForce RTX 3090 TUF 24GB
- RAM: XPG Lancer RGB 32GB 7200MT/s DDR5
- SSD: XPG GAMMIX S70 BLADE 2TB NVMe
- CPU Cooler: Arctic Liquid Freezer II 420 – AIO Water Cooler
- PSU: ENERMAX REVOLUTION D.F. X 1050W
Cyberpunk 2077

- The first game I played to check the performance of the two GPUs was Cyberpunk 2077, where the RTX 3090 produced 35 FPS on average and defeated the RX 7800 XT’s 31 FPS by 12.9%.
- Regarding the low 1% frame rates, the RTX 3090 mustered up 28 FPS, while the RX 7800 XT yielded 25 FPS.
Forza Horizon 5

- While playing Forza Horizon 5, the RX 7800 XT led the performance by producing 97 FPS. In contrast, the RTX 3090 only produced 93 FPS, 4.3% behind the RX 7800 XT.
- Both GPUs follow the same trend at low 1%. The RX 7800 XT produced 85 FPS at low 1%, while the RTX 3090 delivered 79 FPS.
Hogwarts Legacy

- When I played Hogwarts Legacy at 4K, the RTX 3090 again led with its average frame rate of 57 FPS and surpassed the RX 7800 XT’s 51 FPS by 11.8%.
- Coming to the low 1% performance, the RX 7800 XT only produced 42 FPS in this game, whereas the RTX 3090 made 48 FPS.
Horizon Zero Dawn

- In the next title, Horizon Zero Dawn, the RX 7800 XT lagged behind the RTX 3090 by 19.2%. On average, the RTX 3090 delivered an excellent 87 FPS, while the RX 7800 XT generated 73 FPS.
- The RTX 3090 mustered a beautiful 76 FPS at the low 1%, higher than the RX 7800 XT’s average frame rate. In contrast, the RX 7800 XT provided 66 FPS at its low 1% performance.
Red Dead Redemption 2

- During RDR2 gameplay, the RTX 3090 outperformed the RX 7800 XT, with an average 62 FPS compared to the RX 7800 XT’s 59 FPS, a 5.1% performance difference.
- Regarding the low 1% performance, I observed that the RX 7800 XT achieved 52 FPS at low 1%, whereas the RTX 3090 delivered a one FPS higher 53 FPS.
Remnant 2

- When testing Remnant 2, the RTX 3090 surpassed the RX 7800 XT, averaging 41 FPS compared to the RX 7800 XT’s 39 FPS, indicating a 5.1% performance gap.
- In my assessment, the RTX 3090 achieved 32 FPS at the worst 1% performance, outperforming the RX 7800 XT’s 29 FPS by 10.3%.
Resident Evil 4

- During gameplay of Resident Evil 4, the RTX 3090 outperformed the RX 7800 XT, averaging 75 FPS against the RX 7800 XT’s 65 frames per second, implying a 10.3% performance difference.
- In the low 1% performance analysis, the RTX 3090 achieved 64 FPS, outperforming the RX 7800 XT, which recorded only 44 FPS.
Starfield

- While I was playing Starfield at 4K, the RX 7800 XT outperformed the RTX 3090 by 10.0% with an average frame rate of 44 FPS against the RTX 3090’s 40 FPS average.
- In my low 1% performance analysis of this gaming session, the RTX 3090 achieved 33 FPS, whereas the RX 7800 XT managed 39 FPS.
The Last of Us Part I

- In testing of The Last of Us Part I, I noticed the RTX 3090 outperforming the RX 7800 XT, achieving a superior 61 FPS average at 4K, surpassing the latter’s 49 FPS by 24.5%.
- When comparing the low 1% performance, I noted that the RTX 3090 made 51 FPS in this game, while the RX 7800 XT only managed 44 FPS.
The Witcher 3: Wild Hunt

- While playing The Witcher 3: Wild Hunt, the RTX 3090 surpassed the RX 7800 XT’s 34 FPS average frame rate by 11.8% with its superb 38 FPS average at 4K.
- Per my analysis of the low 1% performance, the RTX 3090 produced 25 FPS during this gameplay, whereas the RX 7800 XT only made 22 FPS.
Deciding between the RX 7800 XT and RTX 3090? If unlimited gaming power is your goal, the GeForce RTX 3090 is unmatched with top-tier specs. But, for strong performance on a budget, the Radeon RX 7800 XT shines, offering impressive power and 25% greater efficiency, making it a cost-effective choice with cutting-edge features. You can also check more about the performance of the RX 7800 XT in another detailed review of ours.
– Shehryar Khan
Overall Gaming Performance

Average FPS
After carefully reviewing my benchmark data, it became evident that the RTX 3090 is triumphant in gaming performance, showcasing an impressive average of 58.9 FPS. This beat its rival, the RX 7800 XT, which, although impressive, only managed an average of 54.3 FPS.
In head-to-head performance, the RX 7800 XT showcases its prowess by surpassing the RTX 3090 in Forza Horizon 5 and Starfield. However, concerning the overall performance measured in average frame rate, the RTX 3090 outperforms the RX 7800 XT by 8.5%.
Low 1% FPS
Analyzing the worst 1% performance metrics, the RTX 3090 demonstrated an impressive average of 48.9 FPS, surpassing the RX 7800 XT’s 44.8 FPS. In this context of minimal performance, the RTX 3090 outpaces the RX 7800 XT by a margin of 9.2%.
Winner: NVIDIA's GeForce RTX 3090
Take a glimpse into the gameplay of the titles we have tested to conduct these benchmarks!
Gaming Power Consumption
In light of the critical role that graphics card power consumption plays in overall system performance, it is necessary to compare the power usage of the RX 7800 XT vs RTX 3090 in 4K gaming.
| Game | AMD Radeon RX 7800 XT (W) | Nvidia GeForce RTX 3090 (W) |
|---|---|---|
| Cyberpunk 2077 | 261 | 348.2 |
| Forza Horizon 5 | 259 | 317.7 |
| Hogwarts Legacy | 267 | 344.9 |
| Horizon Zero Dawn | 278 | 345.8 |
| Red Dead Redemption 2 | 275 | 339.2 |
| Remnant 2 | 279 | 348.2 |
| Resident Evil 4 | 279 | 351.8 |
| Starfield | 277 | 313.3 |
| The Last of Us Part I | 256 | 341.4 |
| The Witcher 3: Wild Hunt | 279 | 341.1 |
| Average Power Draw | 271.0 | 339.1 |
| Winner: AMD's Radeon RX 7800 XT | ||
Regarding power use during 4K gaming, our table showcases the RX 7800 XT is a winner, needing 25% less power than the RTX 3090. When we look at performance for each power unit, the RX 7800 XT gives 15% better results than the RTX 3090. So, the RX 7800 XT stands out for being efficient and powerful in gaming.
Gaming Temperatures
During intense gaming sessions, graphics cards may experience overheating issues. Therefore, discussing their optimal temperature management is crucial to ensure peak performance and longevity.
| Game | AMD Radeon RX 7800 XT (°C) | Nvidia GeForce RTX 3090 (°C) |
|---|---|---|
| Cyberpunk 2077 | 54 | 63 |
| Forza Horizon 5 | 52 | 61 |
| Hogwarts Legacy | 53 | 64 |
| Horizon Zero Dawn | 52 | 64 |
| Red Dead Redemption 2 | 53 | 63 |
| Remnant 2 | 53 | 65 |
| Resident Evil 4 | 54 | 64 |
| Starfield | 52 | 63 |
| The Last of Us Part I | 53 | 64 |
| The Witcher 3: Wild Hunt | 52 | 62 |
| Average Gaming Temperature | 52.8 | 63.3 |
| Winner: AMD's Radeon RX 7800 XT | ||
Regarding keeping cool during gaming, our results throne the RX 7800 XT as the winner because it excels in maintaining a cooler average temperature compared to the RTX 3090. Overall, the RX 7800 XT has a 20.0% advantage in thermal efficiency.
Price And Value
| Graphics Card | MSRP | Current Price |
|---|---|---|
| Radeon RX 7800 XT | 💲499 | 💲530 |
| GeForce RTX 3090 | 💲1499 | 💲1229 |
| Price Difference | %100.1 | %79.4 |
The table indicates a slight increase for the RX 7800 XT and a notable decrease for the RTX 3090, making it a potentially more cost-effective choice for consumers. Regarding availability, both graphics cards are readily available through reputable online merchants, including Newegg and Amazon.
Which One Would I Recommend?
RTX 3090: If you desire a GPU with unparalleled gaming performance without budget constraints, I highly recommend the RTX 3090 – a powerhouse that promises the ultimate gaming experience.
RX 7800 XT: For those seeking enhanced GPU performance on a budget without compromising operational efficiency, I highly recommend the RX 7800 XT. It delivers exceptional power within a constrained budget and ensures lower ongoing operating costs.
So, considering the RX 7800 XT vs RTX 3090 decision, it should align with your individual requirements and preferences as the determining factor.
More From RX 7800 XT:
More From RX RTX 3090:
Thank you! Please share your positive feedback. 🔋
How could we improve this post? Please Help us. 😔
[Comparisons Expert]
Shehryar Khan, a seasoned PC hardware expert, brings over three years of extensive experience and a deep passion for the world of technology. With a love for building PCs and a genuine enthusiasm for exploring the latest advancements in components, his expertise shines through his work and dedication towards this field. Currently, Shehryar is rocking a custom loop setup for his built.
Get In Touch: shehryar@tech4gamers.com


 Threads