


AMD Radeon RX 7600
Rated: 8.7/10
AMD Radeon RX 6600 XT
Rated: 8.5/10
Pros And Cons
| GPU | Pros | Cons |
|---|---|---|
| Radeon RX 6600 XT | ✅Provides better speeds ✅RDNA 2 architecture | ❌8GB VRAM with a 128-bit memory bus width |
| Radeon RX 7600 | ✅Good Gaming Performance on 1080p resolution ✅To achieve peak performance, only an 8-pin power connector is required | ❌There is room for enhancement of the performance of ray tracing |
- The RX 7600 demonstrates superior gaming performance over the RX 6600 XT, with an average FPS advantage of 8.4% across various titles.
- The RX 7600 shines in thermal efficiency, showcasing a 9.2% advantage. On average, the RX 6600 XT consumes 32.8% lower power than the RX 7600.
- The current price difference between the Radeon RX 7600 and the RX 6600 XT is 14% difference, with the RX 6600 XT being the expensive one.
- The RX 7600 is the choice for gamers prioritizing top-tier performance and exceptional thermal management. Conversely, the RX 6600 XT remains a budget-friendly option, excelling in power efficiency.
Comparison Table
| Technical Specs | Radeon RX 7600 | Radeon RX 6600 XT |
|---|---|---|
| GPU Name | Navi 33 | Navi 23 |
| Architecture | RDNA 3.0 | RDNA 2.0 |
| CUDA Cores | 2048 | 2048 |
| Tensor Cores | NA | NA |
| RT Cores | 32 | 32 |
| ROPs | 64 | 128 |
| Memory Bus Width | 128 bit | 128 bit |
| Memory Bandwidth | 288.0 GB/s | 256.0 GB/s |
| Best Variants | Best RX 7600 GPUs | - |
Architectural Difference
- Process Node: The RX 7600 is based on a 6nm process. Meanwhile, the RX 6600 XT is manufactured using a 7nm process.
- Clock Speed: Moreover, the RX 7600 takes the lead with a base clock of 1720 MHz and boost clock of 2655 MHz, surpassing the RX 6600 XT’s base clock of 1968 MHz and boost clock of 2589 MHz.
- VRAM: Moreover, both the RX 7600 and RX 6600 XT offer 8GB of GDDR6 VRAM, providing ample memory capacity for high-performance gaming.
- TDP: Moreover, the RX 7600 boasts a higher TDP of 165W compared to the RX 6600 XT’s TDP of 160W.
- Supported Technologies: Finally, both the RX 7600 and RX 6600 XT harness the power of FSR technology to elevate graphics and performance.
Referencing our earlier review of the RX 7600, which highlighted its compelling specifications, we now get into the fascinating clash between the RX 7600 vs RX 6600 XT, both formidable yet affordable contenders from AMD.
Gaming Performance Benchmarks
We conducted a series of comprehensive gaming benchmarks to assess the gaming prowess of the RX 7600 and RX 6600 XT.
Testing Rig
- CPU: Intel Core i5-13600K
- Motherboard: ASUS ROG X570 Crosshair VIII Hero
- RAM: Kingston Fury Renegade RGB DDR5 32GB 7200MHz
- Power Supply: ENERMAX REVOLUTION D.F. X 1050W
- CPU Cooler: be quiet! 250W TDP Dark Rock Pro 4
- Storage Drive: XPG GAMMIX S70 BLADE 2TB NVMe SSD
- Operating System: Windows 11
Forza Horizon 5
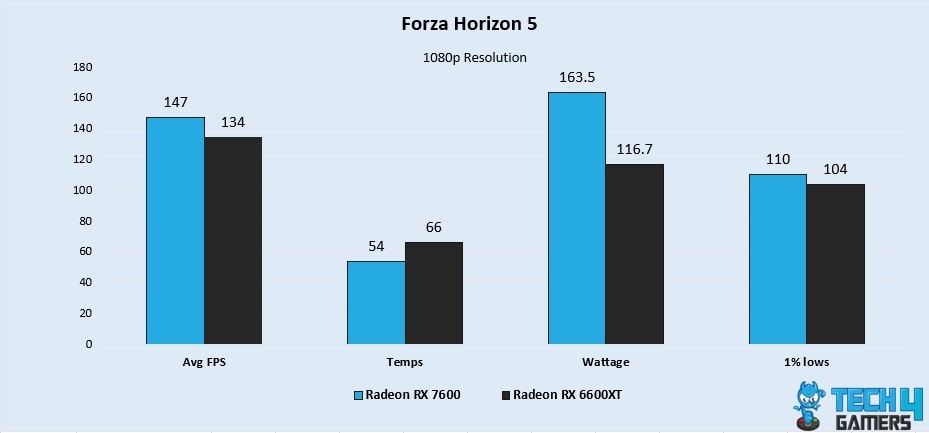
- Firstly, when I played Forza Horizon 5, the RX 7600 exhibited an impressive 9.2% advantage over the RX 6600 XT, achieving 147 FPS compared to the latter’s 134 FPS.
- Furthermore, the RX 7600 demonstrates a 5.6% higher 1% low performance compared to the RX 6600 XT, with figures of 110 FPS and 104 FPS, respectively.
Hogwarts Legacy
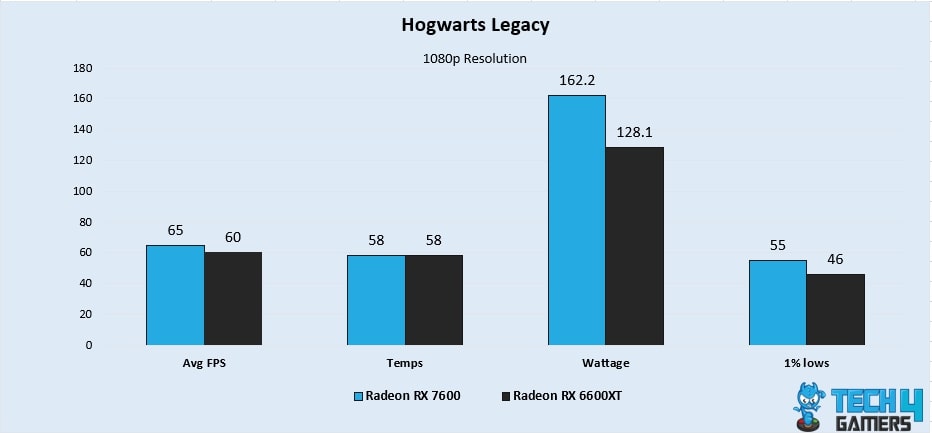
- In our first Hogwarts Legacy gameplay, the RX 7600 outperforms the RX 6600 XT with an 8% higher average FPS, reaching 65 FPS compared to the latter’s 60 FPS.
- Furthermore, the RX 7600 exhibits a significant 17.8% advantage in 1% low performance over the RX 6600 XT, achieving 55 FPS and 46 FPS, respectively.
Cyberpunk 2077
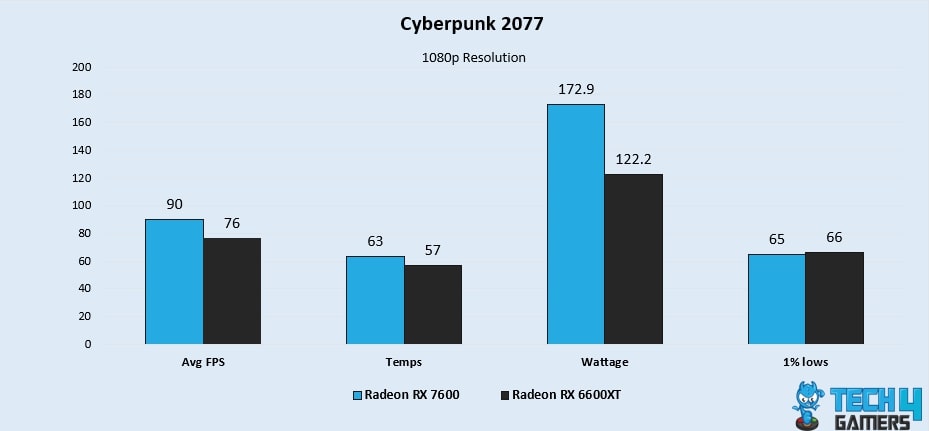
- While playing Cyberpunk 2077, the RX 7600 showcases a significant 16.8% lead in average FPS performance, achieving 90 FPS, while the RX 6600 XT lags behind 76 FPS.
- Interestingly, the RX 7600 showcases a slight 1.5% difference in 1% low performance compared to the RX 6600 XT, with figures of 65 FPS and 66 FPS, respectively.
Red Dead Redemption 2
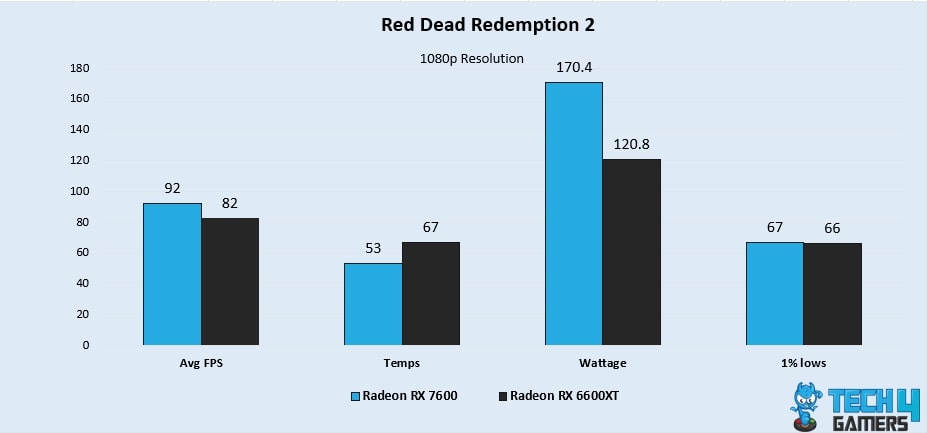
- Remarkably, the RX 7600 demonstrates an 11.4% advantage in average FPS performance over the RX 6600 XT, delivering 92 FPS compared to the latter’s 82 FPS.
- Furthermore, the RX 7600 and RX 6600 XT demonstrate almost identical 1% low performance, where the former achieved 67 FPS while the latter gets 66 FPS. A difference of 1.5%.
Assassin’s Creed Valhalla
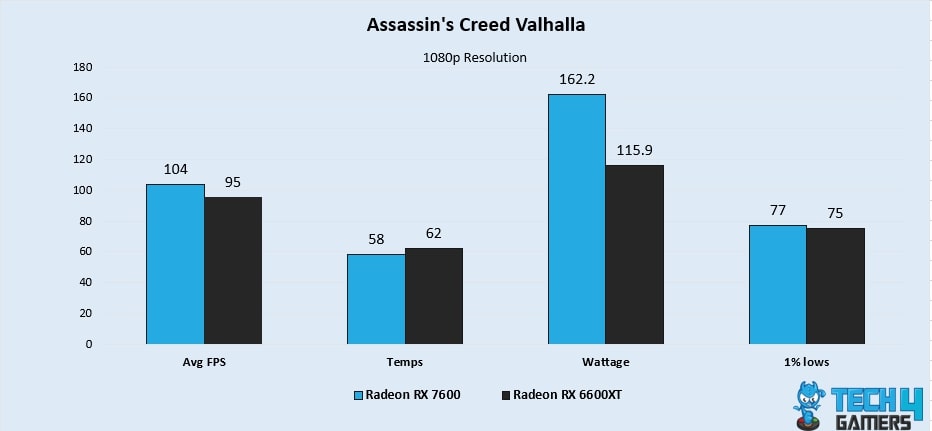
- During my session of Assassin’s Creed Valhalla, the RX 7600 achieves a notable 9% higher average FPS performance, reaching 104 FPS, while the RX 6600 XT trails behind with 95 FPS.
- In addition, the RX 7600 exhibits a 2.6% advantage over the RX 6600 XT in 1% low performance, achieving 77 FPS and 75 FPS, respectively.
Dying Light 2
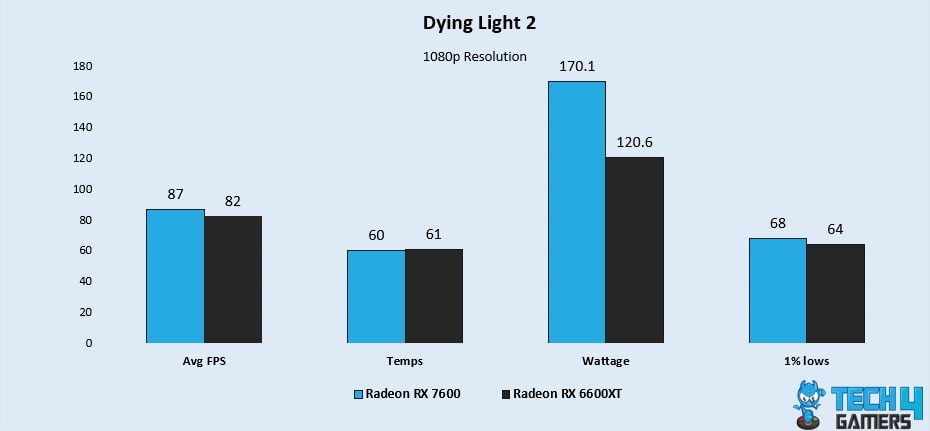
- While playing Dying Light 2, the RX 7600 exhibits a 5.9% advantage in average FPS performance over the RX 6600 XT, delivering 87 FPS compared to the latter’s 82 FPS.
- Moreover, the RX 7600 showcases a 6% higher 1% low performance compared to the RX 6600 XT, with figures of 68 FPS and 64 FPS, respectively.
Far Cry 6
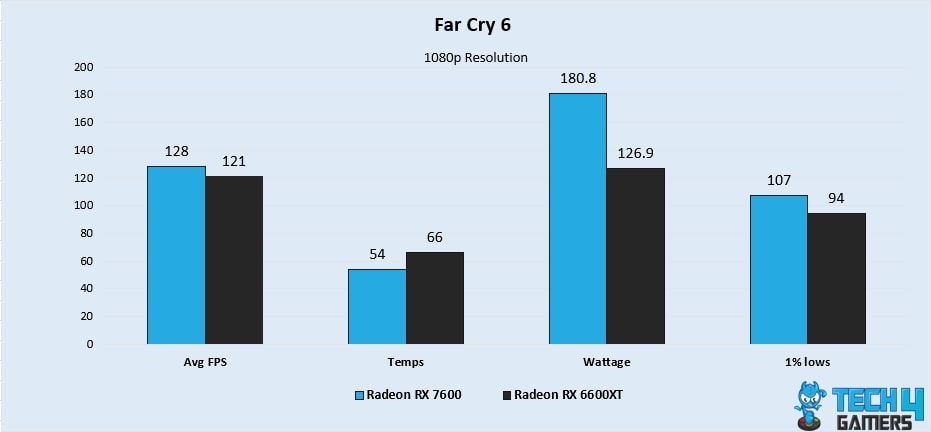
- When playing Far Cry 6, the RX 7600 showcases a slight 5.6% lead in average FPS performance, achieving 128 FPS, while the RX 6600 XT achieves 121 FPS.
- Furthermore, the RX 7600 demonstrates a substantial 12.9% advantage in 1% low performance over the RX 6600 XT, achieving 107 FPS and 94 FPS, respectively.
Horizon Zero Dawn
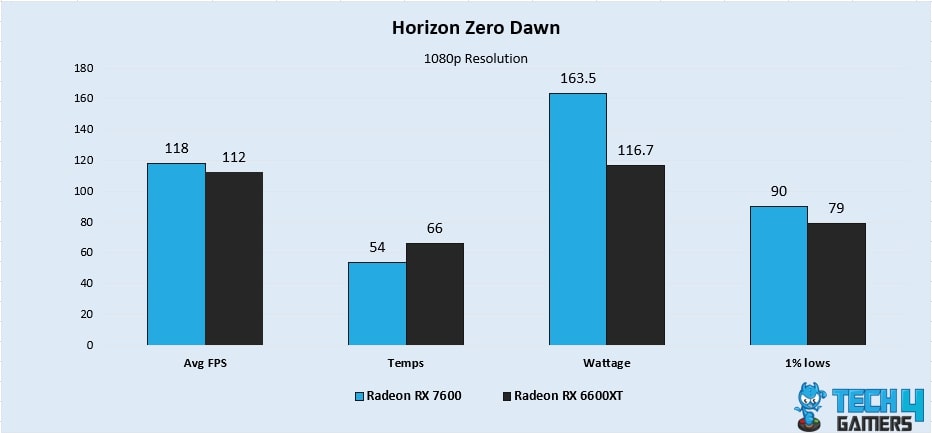
- The RX 7600 outperforms the RX 6600 XT with a 5.2% higher average FPS, reaching 118 FPS compared to the latter’s 112 FPS.
- Moreover, the RX 7600 exhibits a 13% higher 1% low performance compared to the RX 6600 XT, with figures of 90 FPS and 79 FPS, respectively.
Watch Dogs Legion

- Remarkably, the RX 7600 demonstrates a 6.8% advantage in average FPS performance over the RX 6600 XT, achieving 120 FPS compared to the latter’s 112 FPS.
- Moreover, the RX 7600 showcases a significant 16.3% advantage over the RX 6600 XT in 1% low performance, achieving 86 FPS and 73 FPS, respectively.
Overall Gaming Performance
| Featured | RX 7600 | RX 6600 XT |
|---|---|---|
| Average FPS | 105.6📈 | 97.1📈 |
| %1 lows | 72📉 | 69 📉 |
| Winner: AMD's RX 7600 | ||
Regarding gaming performance, the RX 7600 edges slightly ahead of the RX 6600 XT, boasting an average of 105.6 FPS compared to the latter’s 97.1 FPS. In conclusion, the RX 7600 showcases an impressive 8.4% advantage over the RX 6600 XT in terms of FPS performance, establishing itself as the superior option in the gaming arena.
Average Power Consumption
| Featured | RX 7600 (W) | RX 6600 XT (W) |
|---|---|---|
| Average Power Consumption | 168.4⚡️ | 120.9⚡️ |
| Winner: AMD's RX 6600 XT | ||
During our benchmark tests, it was evident that the RX 6600 XT showcased a significantly lower average power consumption of 120.9W compared to the RX 7600’s higher average power consumption of 168.4W. The RX 6600 XT demonstrates remarkable power efficiency, consuming approximately 32.8% less power on average than the RX 7600.
Average Thermal Statistics
| Featured | RX 7600 (°C) | RX 6600 XT (°C) |
|---|---|---|
| Average Temperature | 57.1🌡️ | 62.6🌡️ |
| Winner: AMD's RX 7600 | ||
Regarding thermal efficiency, the RX 7600 shines brightly, maintaining an impressively cool average temperature of 57.1°C. In contrast, the RX 6600 XT lags with a slightly higher average temperature of 62.6°C. Conclusively, the benchmark results overwhelmingly favor the RX 7600 in terms of thermal efficiency, showcasing a remarkable 9.2% compared to the RX 6600 XT.
Pricing And Availability
| GPU | MSRP | Current Price |
|---|---|---|
| Radeon RX 6600 XT | 💲379 | 💲235 |
| Radeon RX 7600 | 💲259 | 💲270 |
| Difference | 37.6% | 14% |
The Radeon RX 6600 XT is experiencing a notable price drop while the Radeon RX 7600 sees a marginal increase. These price movements can be influenced by various factors such as supply and demand dynamics and market trends.
Final Verdict – What We Recommend?
AMD Radeon RX 7600: The AMD Radeon RX 7600 impresses with its superior gaming performance, outclassing the RX 6600 XT with an average FPS advantage of 8.4% across various titles. Additionally, it showcases exceptional thermal efficiency, boasting a 9.2% advantage over its counterpart. While it comes at a slightly higher price point, the RX 7600 is the go-to choice for gamers seeking top-tier performance and efficient thermal management.
AMD Radeon RX 6600 XT: The AMD Radeon RX 6600 XT offers a budget-friendly option with commendable power efficiency. Despite falling slightly behind in gaming performance when compared to the RX 7600, the RX 6600 XT remains a solid choice for users prioritizing affordability and power efficiency. With a lower price tag and significant power savings, the RX 6600 XT presents an appealing option for budget-conscious gamers.
Overall, the RX 7600 emerges as the superior choice for gamers seeking uncompromising performance and thermal management, while the RX 6600 XT caters to those looking for a cost-effective solution with commendable power efficiency.
More from the RX 6600 XT
More from the RX 7600
Thank you! Please share your positive feedback. 🔋
How could we improve this post? Please Help us. 😔
[Comparisons Expert]
Shehryar Khan, a seasoned PC hardware expert, brings over five years of extensive experience and a deep passion for the world of technology. With a love for building PCs and a genuine enthusiasm for exploring the latest advancements in components, his expertise shines through his work and dedication towards this field. Currently, Shehryar is rocking a custom loop setup for his built.
Get In Touch: shehryar@tech4gamers.com


Feedback By: