Nvidia GeForce RTX 5080 Rated: 9/10 AMD Radeon RX 7900 XT Rated: 7.2/10
Pros And Cons
| GPU | Pros | Cons |
|---|---|---|
| RTX 5080 | ✅ Equipped with PCIe 5.0 ✅ DLSS 4 with improved frame generation | ❌ Lower ROPs, L1 & L2 Cache |
| RX 7900 XT | ✅ Higher VRAM & wider bus width ✅ Has USB Type-C support for output | ❌ Lags behind in AI-based applications |
- Compared to the RX 7900 XT, the RTX 5080 showed us 24.1% better performance in 1440p gaming and it was 31.3% more effective in productivity software.
- Since both these cards share somewhat similar TDP ratings, the RX 7900 XT was only 1.6% more power-efficient than the RTX 5080; this difference is too small to be of any value.
- As of mid-February 2025, the RX 7900 XT is $386 cheaper than the RTX 5080. This price difference will increase gradually as the price of the RTX 5080 increases over time.
- We recommend you get the RX 7900 XT if you’re on a budget and want decent 1440p gaming performance. If you want higher performance in gaming and productivity and have a higher budget, go for the RTX 5080.
Comparison Table
| Features | RTX 5080 | RX 7900 XT |
|---|---|---|
| Slot Width | Dual-slot | Dual-slot |
| Release Date | Jan 30th, 2025 | Nov 3rd, 2022 |
| Power Connectors | 1x 16-pin | 2x 8-pin |
| Shader Cores (CUDA) | 10752 | 5376 |
| TMUs | 336 | 336 |
| ROPs | 128 | 192 |
| Tensor Cores | 336 | N/A |
| RT Cores | 84 | 84 |
| Suggested PSU | 750W | 700W |
| Best Variants | - | Best RX 7900 XT |
| Best CPU | - | Best CPUs For RX 7900 XT |
Architectural Difference
- Process Nodes: Even though the RX 7900 XT is two years older than the RTX 5080, it still comes with the same process node that the RTX 5080 uses, which is TSMC’s 5nm.
- Clock Speeds: The RTX 5080 has a base frequency of 2295 MHz, which can be sped up to 2617 MHz. On the other hand, the RX 7900 XT comes with a base clock and boost clock speeds of 1387 MHz and 2394 MHz, respectively.
- VRAM: The RTX 5080 comes with a 16GB VRAM with the newer GDDR7, and it is paired with a bus width of 256-bit. In comparison, the RX 7900 XT counters it with its 20GB VRAM with GDDR6, with a wider bus width of 384-bit.
- TDP: There is a slight difference in the TDP, where the RTX 5080 comes with a slightly higher TDP rating of 360W, while the RX 7900 XT comes with a 300W TDP rating.
- Supported Technologies: The RTX 5080’s use of DLSS 4 has an advantage over the RX 7900 XT’s FSR 3 because of its multi-frame generation technology. The RTX 5080 also has better ray tracing, thanks to its AI-driven approach.
We’ve already thoroughly covered the differences between the RTX 5080 and the RX 7900 XTX, where the results weren’t significantly high. So, in this RTX 5080 vs RX 7900 XT, we’ll be comparing these two cards to see whether the RTX 5080 exceeds drastically in performance when compared to the RX 7900 XT.
Gaming Benchmark – 1440p
We’ve taken you through the on-paper specifications. But to see the real essence of these two graphic cards, it is important to perform a benchmark test using the same testing rig, games, and settings of these games. So, here you go. Note that the settings are kept all the way to the maximum and the games are played at 1440p.
Recommended Test Bench
- CPU – AMD Ryzen 7 9800X3D
- Mobo – MSI MPG X870E Carbon WiFi
- RAM – G. Skill Trident Z5 Neo RGB DDR5-6400 CL30
- CPU Cooler – Xigmatek Aurora 360mm Cooler
- Storage – XPG GAMMIX S70 BLADE 2TB NVMe SSD
- Power Supply – MSI MAG A1000GL ATX 3.1 80+ Gold
- Operating System – Windows 11
S.T.A.L.K.E.R. 2: Heart of Chornobyl
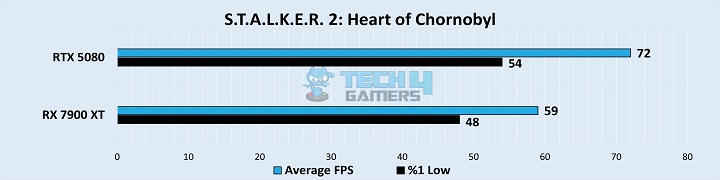
- In our first game, the RTX 5080 showed a clear performance difference of 19.8% because it obtained an average of 72 FPS. The frames barely hit the 60 FPS mark on the RX 7900 XT as they averaged 59 FPS.
- The 1% lows only dropped to 54 FPS on the RTX 5080, making it 11.8% more effective in this game. For the RX 7900 XT, we saw that it displayed an average of 48 FPS, which wasn’t bad, given its average FPS.
God Of War Ragnarok
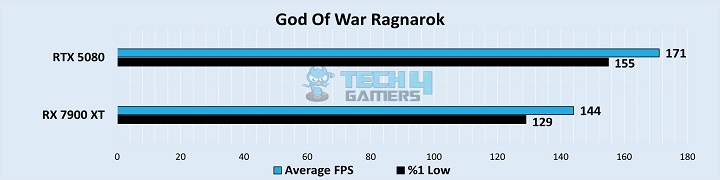
- On God Of War Ragnarok, the RTX 5080 was 17.1% ahead of its rival with its average of 171 FPS. Simultaneously, the RX 7900 XT followed behind with its average of 144 FPS, which was also decent.
- In terms of the 1% lows, the RTX 5080 did a better job, as its frames only dropped to 155 FPS on average. On the other hand, the RX 7900 XT obtained an average of 129 FPS, resulting in an 18.3% margin.
Warhammer 40K: Space Marine 2
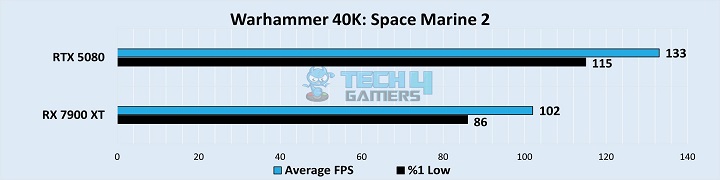
- Here, we saw the RTX 5080 pushed with its average of 133 FPS, which has a 26.4% edge over the RX 7900 XT, which acquired an average of 102 FPS. Both cards performed above the 100 FPS mark in this game.
- As for the 1% lows, the RTX 5080 had a whopping 28.9% lead because its frames dipped to 115 FPS, on average. This wasn’t the case with the RX 7900 XT, as it averaged 86 FPS.
A Plague Tale Requiem
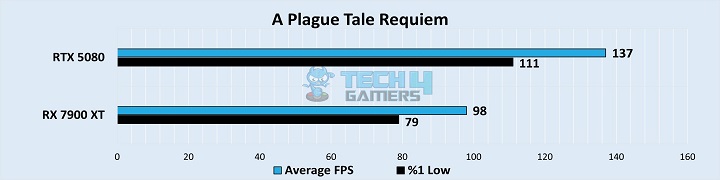
- We observed the highest difference on A Plague Tale Requiem, where the RTX 5080 excelled with its 137 FPS, which was astonishingly 33.2% better than the RX 7900 XT, which obtained an average of 98 FPS.
- The 1% lows were also quite high on the RTX 5080, as they averaged 111 FPS. In contrast, the RX 7900 XT had frames that dropped to 79 FPS, which resulted in a 33.7% margin where the RTX 5080 was leading.
Star Wars Outlaws
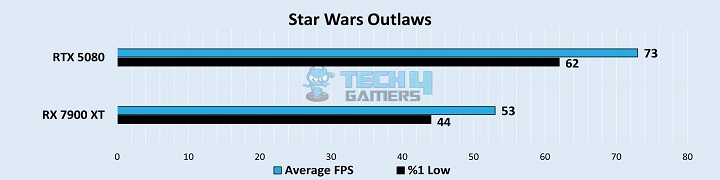
- Yet again, we saw a very high margin, this time of 31.7%, secured by the RTX 5080 as it averaged 73 FPS. Whereas the gameplay on the RX 7900 XT wasn’t as smooth because it averaged 53 FPS.
- Similarly, the 1% lows were better on the RTX 5080 than on the RX 7900 XT, as they both achieved an average of 62 FPS and 44 FPS, respectively. This makes the RTX 5080 achieve the largest 1% low margin of 34% comparatively.
Starfield
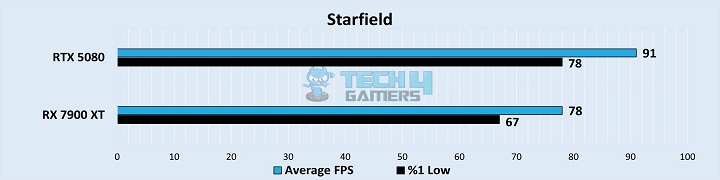
- In Starfield, we saw the difference was the least because the RTX 5080 obtained an average of 91 FPS. However, the RX 7900 XT performed with an average of 78 FPS, making for only a 15.4% gap.
- For the 1% lows, the results were similar, as the RTX 5080 managed to reach 78 FPS on average. The RX 7900 XT was just 15.2% behind with its average of 67 FPS in this game.
Cyberpunk 2077
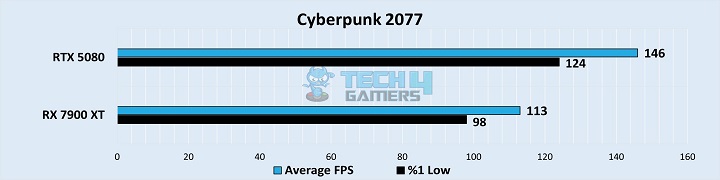
- Here, the margin grew when compared to the previous game and rose to 25.5% where the RTX 5080 performed better with its average of 146 FPS. At the same time, the RX 7900 XT performed with an average of 113 FPS.
- In terms of the 1% lows, the RTX 5080 displayed a 23.4% higher performance than the RX 7900 XT as it obtained an average of 124 FPS, whereas the RX 7900 XT was behind with its 98 FPS.
Dragon Age: The Veilguard
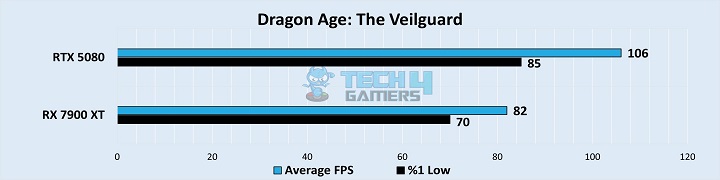
- In this game as well, we saw the RTX 5080 showed the exact same difference of 25.5%, just like the previous game, but this time, it averaged 106 FPS, which was higher than the RX 7900 XT’s average of 82 FPS.
- The 1% lows were also in favor of the RTX 5080, as it reached 85 FPS at minimum. On the contrary, the RX 7900 XT’s frames dropped to 70 FPS, which equates to a difference of 19.4%.
Productivity Benchmarks
After going through the gaming benchmarks, it is time that we show you the productivity benchmarks of both of these GPUs since it is crucial to know the best of both worlds. We’ll show you their performance in editing, rendering, and AI image generation, so by the end of it, you’ll know which GPU is better and faster.
Adobe Premiere Pro
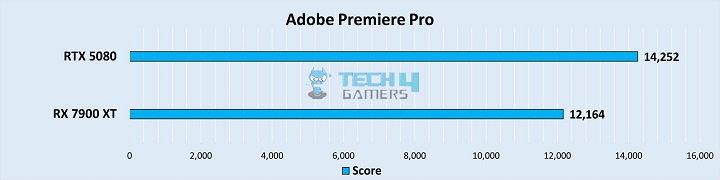
- Editing on Adobe Premiere Pro, the RTX 5080 scored 14,252 points, which was 15.8% higher than the RX 7900 XT’s 12,164 points. This shows the slight edge the RTX 5080 has over the RX 7900 XT when it comes to editing.
Blender (Barbershop)
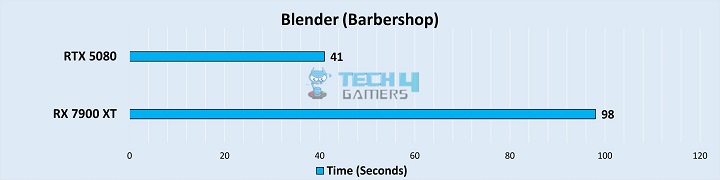
- While rendering on Blender, the RTX 5080 took only 41 seconds to complete the render. In contrast, the RX 7900 XT finished the task in 1 minute 38 seconds. This shows that the RTX 5080 was 41.8% faster in rendering on Blender.
UL Procyon (AI Image Generation)
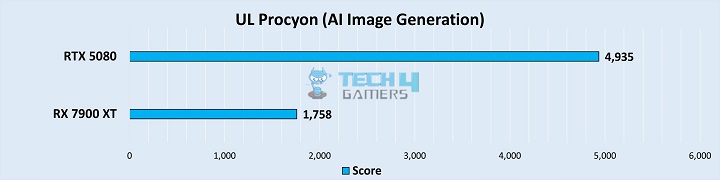
- In terms of generating images using AI, the RTX 5080 scored a staggering 4,935 points, which was way higher than the RX 7900 XT’s score of 1,758 points. This makes the RTX 5080 94.9% better in terms of AI image generation.
Overall Performance
| Graphic Cards | RTX 5080 | RX 7900 XT |
|---|---|---|
| Average FPS | 📈116.1 | 📈91.1 |
| 1% Lows | 📉98 | 📉77.6 |
| Productivity (Rating) | ✏️7/10 | ✏️5.1/10 |
| Winner: GeForce RTX 5080 | ||
Average Framerate
After calculating the average framerates from the eight tested games, we saw that the winner was the RTX 5080. This is because the RTX 5080 performed better than the RX 7900 XT by 24.1%, on average. It also excelled in every single game without fail, regardless of how demanding the game was.
1% Lows:
Similar to the average FPS, we saw that the RTX 5080 came out on top in terms of 1% lows as well. Specifically, the RTX 5080 performed 23.2% better than the RX 7900 XT and had 1% lows, staying above the 60 FPS mark in seven out of the eight tested games. This shows how much of a smoother experience it provided.
Productivity:
For productivity, the RTX 5080 was also the winner because it was 31.3% more effective than the RX 7900 XT, especially in rendering and AI-based tasks. However, we have to give credit where credit is due; we did see that the RX 7900 XT performed with quite impressive scores when editing on Adobe Premiere Pro.
Average Power Consumption
| Power Consumption | RTX 5080 | RX 7900 XT |
|---|---|---|
| Idle | 20⚡ | 11⚡ |
| Gaming | 325⚡ | 320⚡ |
| Ray Tracing | 332⚡ | 321⚡ |
| Maximum | 375⚡ | 320⚡ |
| Winner: Radeon RX 7900 XT | ||
Both of these GPUs share a TDP that is only slightly distinct from one another, so they have similar power consumption. We calculated that the difference is only 1.6%, with the RX 7900 XT being slightly more power-efficient than the RTX 5080. However, this difference is so slight that we consider it negligible.
Pricing And Availability
| GPU | RTX 5080 | RX 7900 XT | Price Difference |
|---|---|---|---|
| Launch MSRP | 💲999 | 💲899 | 10.5% |
| Current Price | 💲1420 | 💲1034 | 31.5% |
As of mid-February 2025, the RTX 5080’s price has been drastically increased from its MSRP. Therefore, the RX 7900 XT is currently $386 cheaper than the RTX 5080. From now on, the price of the RTX 5080 will only increase even further. As for availability, the RX 7900 XT is more widely available than the RTX 5080.
Final Verdict—What We Recommend?
RX 7900 XT: This is a solid 1440p card that is also excellent for editing. For its price, it does offer great performance and relatively higher specifications, which makes it an ideal budget card. It has a higher VRAM than most cards and paired with FSR 3; it pushes frames higher than 60 FPS in most games at 1440p.
RTX 5080: This is a decent release from Nvidia, but we still believe its performance is not groundbreaking. Yes, it features AI-based upscaling and uses the DLSS 4, but its price is a concern for us. For what it’s worth right now, the performance is justified, but the more its price hikes, the more it becomes an unreasonable option.
All-in-all, we recommend you get the RX 7900 XT if you want a great 1440p card that also handles editing well and when you’re on a budget. However, if you can exceed your budget to get more performance in both gaming and productivity and want a more future-proof option, then go for the RTX 5080 by all means.
Although the RX 7900 XT’s 20GB GDDR6 VRAM may help in newer games, the RTX 5080’s use of the newer DLSS 4, AI-focused approach, and PCIe 5 makes it better for future games. Even though both the RTX 5080 and RX 7900 XT have 84 RT cores, still the RTX 5080 is better in ray tracing, thanks to its newer RT cores, higher cores & AI-driven upscaling. Surely, the RTX 5080 is better in AI and deep learning than the RX 7900 XT because of its 4th-gen tensor cores, which are also optimized for AI-based tasks such as generative fill. The RX 7900 XT has better Linux support because it has better open-source drivers like Mesa and ROCm, which Nvidia’s RTX 5080 lacks. The RTX 5080 is better in streaming and video editing because of its NVENC, which has AI-based AV1 encoding. It also offers better hardware acceleration for video editing software.FAQs
More From RTX 5080 More From RX 7900 XT
Thank you! Please share your positive feedback. 🔋
How could we improve this post? Please Help us. 😔
[Comparisons Specialist]
I’m a passionate computer hardware expert specializing in CPUs and GPUs. With a lifelong curiosity for hardware and extensive hands-on experience, I provide valuable insights, practical advice, and in-depth analysis on these components. Engaging with the hardware community, I exchange knowledge and stay at the forefront of technological advancements.
Get In Touch: uzair@tech4gamers.com