


GeForce GTX 1080
Rated: 8/10
GeForce RTX 2080
Rated: 9/10
Pros And Cons
| CPU | Pros | Cons |
|---|---|---|
| GeForce GTX 1080 | ✅ Big improvements compared to GTX 980 ✅ Comes with 4K & VR capability | ❌ Fans active even in idle state |
| GeForce RTX 2080 | ✅ Amazing 1080p & 1440p performance ✅ Deep Learning & Ray Tracing Capability | ❌ 650 W PSU Requirement can be costly |
- The GeForce GTX 1080 is based on the Pascal architecture, while the GeForce RTX 2080 utilizes the more advanced Turing architecture.
- In benchmark tests, the RTX 2080 exhibits a significantly 40.2% higher average FPS production compared to the GTX 1080, showcasing its superior performance.
- Moreover, the RTX 2080 shows a power consumption of roughly 18.4% higher than the GeForce GTX 1080, highlighting a difference in their energy efficiency.
- Conversely, the benchmark analysis reveals a thermal efficiency disadvantage of approximately 10.3% for the GTX 1080 compared to the RTX 2080, indicating a difference in their cooling capabilities.
Comparison Table
| Technical Specs | GeForce GTX 1080 | GeForce RTX 2080 |
|---|---|---|
| GPU Name | GP104 | TU104 |
| Release Date | May 27th, 2016 | Sep 20th, 2018 |
| MSRP | 500 USD | 1000 USD |
| Transistors | 7,200 million | 13,600 million |
| Base Clock | 1607 MHz | 1515 MHz |
| Boost Clock | 1733 MHz | 1710 MHz |
| CUDA Cores | 2560 | 2560 |
| Tensor Cores | NA | 368 |
| RT Cores | NA | 46 |
| TMUs | 160 | 184 |
| ROPs | 64 | 64 |
| L1 Cache | 48 KB (per SM) | 64 KB (per SM) |
| L2 Cache | 2 MB | 4 MB |
| Memory Bus Width | 256-bit | 256-bit |
| TDP | 180 W | 215 W |
| Suggested PSU | 500 W | 550 W |
Architectural Differences
- Processing Node: Firstly speaking of the GPUs’ processing nodes, the GeForce GTX 1080 features an advantageous 8nm processing node technology. Meanwhile, the RTX 2080 incorporates an older processing node of 12nm size technology.
- Clock Speeds: The GTX 1080 features a base clock of 1607 MHz and a boost clock of 1733 MHz, whereas the RTX 2080 has a base clock of 1515 MHz and a boost clock of 1710 MHz.
- Memory Type and Bandwidth: While the GTX 1080 utilizes 8GB GDDR5X memory with a bandwidth of 320.3 GB/s, the RTX 2080 employs 8GB GDDR6 memory boasting a higher bandwidth of 448.0 GB/s.
- Performance and Reputation: Despite being from different series, both GPUs have earned recognition for their formidable performance in their respective eras, with the GTX 1080 hailed as a high-end option in the Pascal lineup and the RTX 2080 acclaimed as a mid-range contender in the Turing series.
Our previous assessment discovered that the AMD RX 7900 XTX outperformed NVIDIA’s 4070 Ti. However, in this analysis, we shift our focus to NVIDIA’s previous generations, specifically comparing the performance of the GeForce GTX 1080 vs RTX 2080. We aim to determine the extent of the performance gap between these two graphics cards in 2024.
GeForce GTX 1080 Vs RTX 2080: Gaming Benchmarks
To evaluate the practical performance of the GeForce GTX 1080 and the GeForce RTX 2080, we will thoroughly analyze each card across a range of games. By scrutinizing their real-world performance, we can better understand how these graphics cards compare in terms of gaming performance.
Testing Rig
Here are the specs of the testing rig:
- OS: Windows 10 pro
- CPU: AMD Ryzen 9 7950X3D
- Motherboard: GIGABYTE X670E Aorus Master
- GPU: GIGABYTE RTX 4090 Gaming OC 24G
- RAM: Corsair Dominator Platinum RGB 32GB DDR5 6000MHz RAM
- SSD: XPG GAMMIX S70 BLADE 2TB NVMe
- PSU: be quiet! Dark Power Pro 13 1300W
- Cooler: Cosair ICUE H150I Elite
Note: Please keep in mind that benchmark tests can be influenced by a range of external factors, including room temperature, airflow, and background software. Therefore, these elements have the potential to impact the final results.
Let’s dive straight into the gaming benchmarks without further delay, comparing the performance of the GeForce GTX 1080 vs RTX 2080.
The Last of Us Part I
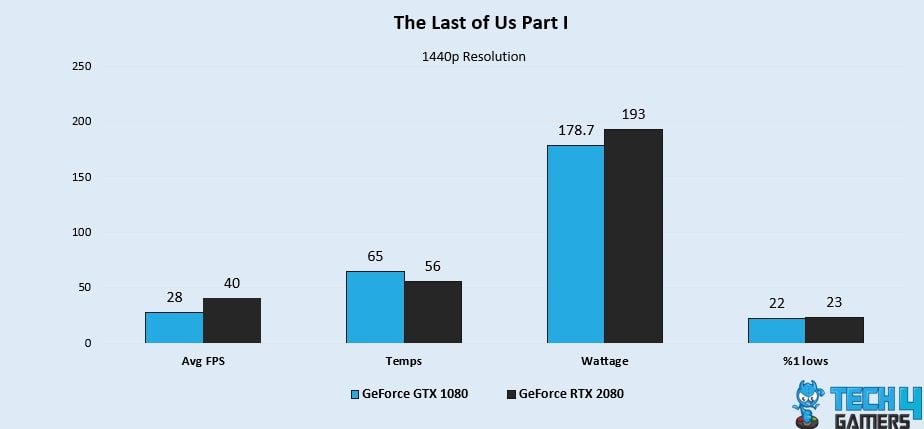
- Notably outperforming the GTX 1080’s average FPS of 28, the RTX 2080 shines with 40 FPS, showcasing a remarkable 35.2% increase in performance during our TLOU benchmarks.
- Additionally, the GTX 1080 falls short in terms of 1% low performance when compared to the RTX 2080, displaying a 4.4% lower result of 22 FPS compared to the RTX 2080’s 23 FPS.
God of War
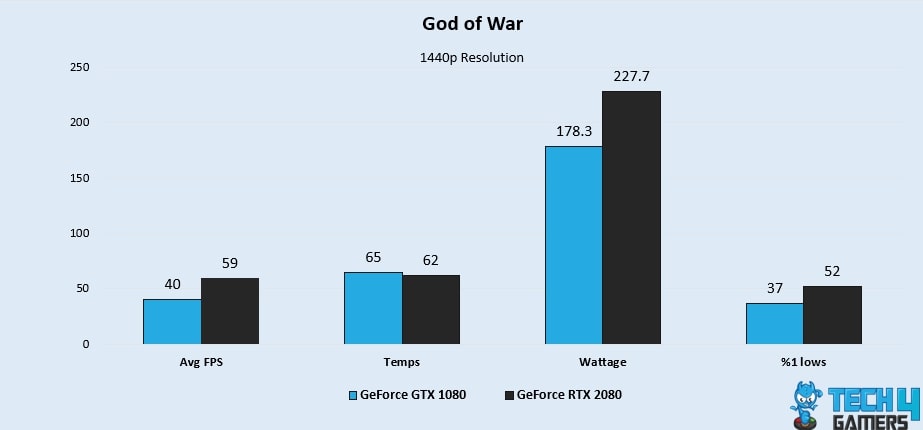
- Demonstrating its superiority, the RTX 2080 achieves an impressive average FPS of 59 in God of War benchmark tests, surpassing the GTX 1080’s 40 FPS by a significant 38.3%.
- Moreover, the RTX 2080 outperforms the GTX 1080 in terms of 1% low performance, with an impressive 33.7% improvement, achieving 52 FPS compared to the GTX 1080’s 37 FPS.
Atomic Heart
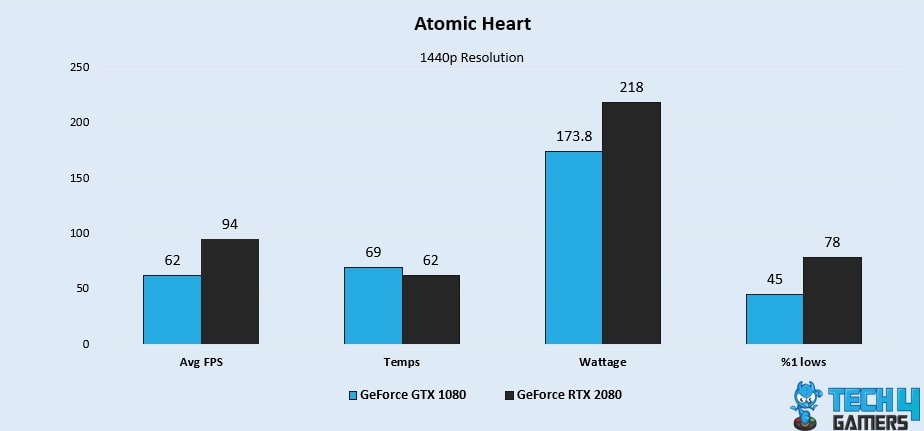
- The RTX 2080 establishes itself as a formidable contender, delivering exceptional performance with an average FPS of 94 vs 62 in benchmark tests, surpassing the GTX 1080 by a notable 41%.
- In addition, the GTX 1080 lags behind the RTX 2080 in terms of 1% low performance, exhibiting a 53.6% lower result with 45 FPS compared to the RTX 2080’s 78 FPS.
CYBERPUNK 2077
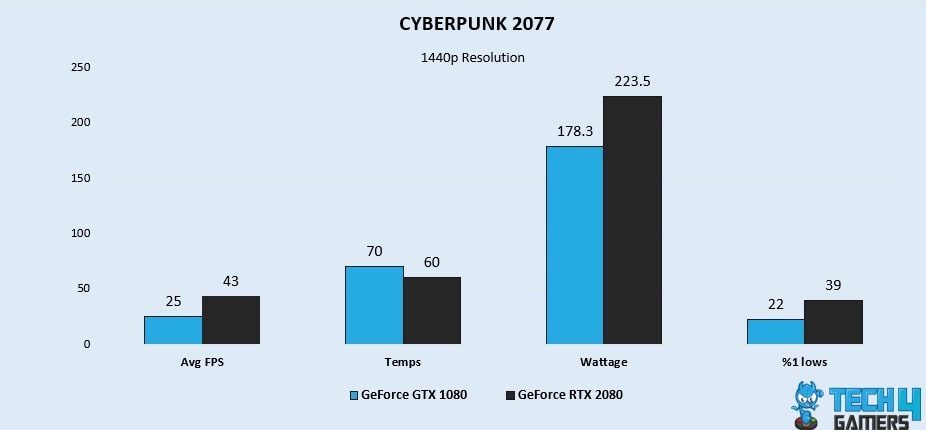
- Outshining the GTX 1080, we witness the RTX 2080 showcase its prowess with a remarkable 52.9% increase in average FPS, achieving 43 FPS compared to 25 FPS in Cyberpunk benchmark tests.
- Additionally, the RTX 2080 delivers superior 1% low performance, showcasing a remarkable 55.7% improvement with 39 FPS compared to the GTX 1080’s 22 FPS.
Resident Evil 4
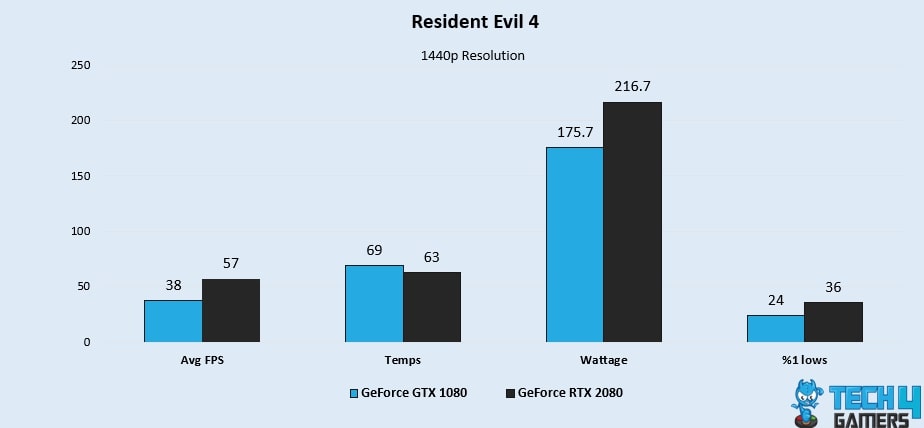
- With a substantial 40% increase in average FPS, the RTX 2080 outperforms the GTX 1080 in the Resident Evil 4 test, delivering an impressive 57 FPS compared to 38 FPS in the benchmark.
- Furthermore, the GTX 1080 demonstrates a weaker 1% low performance compared to the RTX 2080, showing a 40% lower result with 24 FPS in contrast to the RTX 2080’s 36 FPS.
Hogwarts Legacy
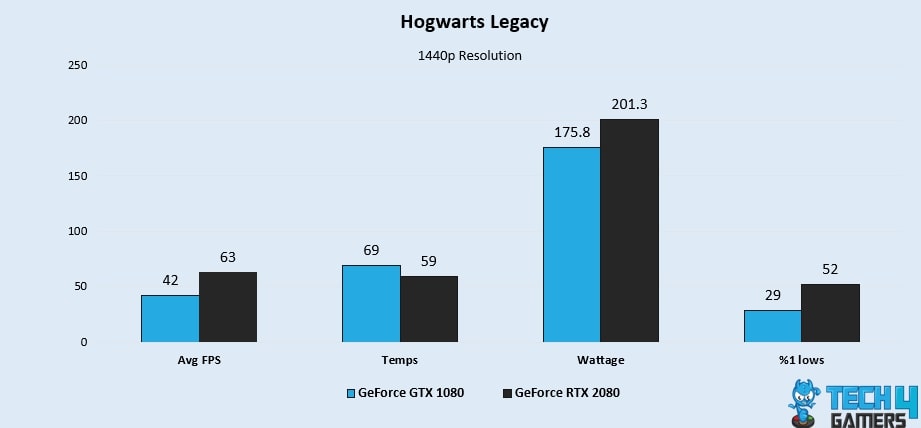
- Surpassing the GTX 1080’s performance, the RTX 2080 excels with an impressive average FPS of 63 vs 42 in benchmark tests, showcasing a substantial 40% increase.
- Additionally, the GTX 1080 falls behind the RTX 2080 in terms of 1% low performance, displaying a 56.7% lower result of 29 FPS compared to the RTX 2080’s 52 FPS.
A Plague Tale Requiem
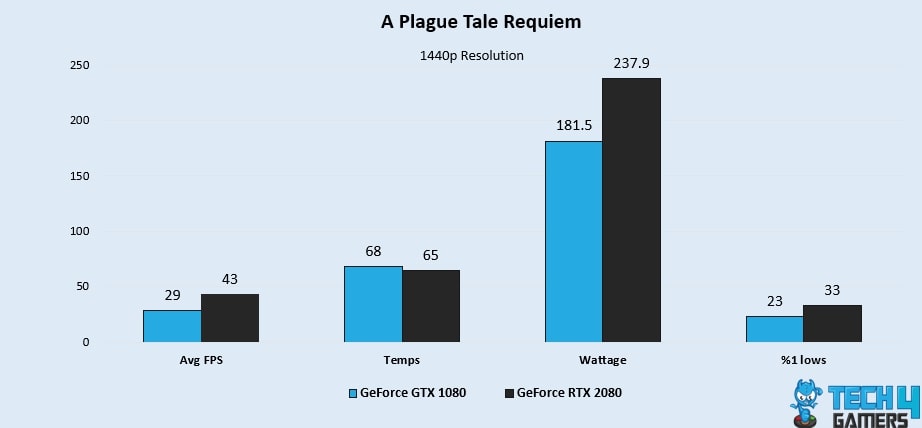
- The RTX 2080 stands out with its performance in A Plague Tale: Requiem, recording an average FPS of 43 compared to 29 in benchmark tests, surpassing the GTX 1080 by a significant 38.8%.
- Furthermore, the RTX 2080 boasts a stronger 1% low performance, exhibiting an impressive 35.7% improvement with 33 FPS compared to the GTX 1080’s 23 FPS.
Red Dead Redemption 2
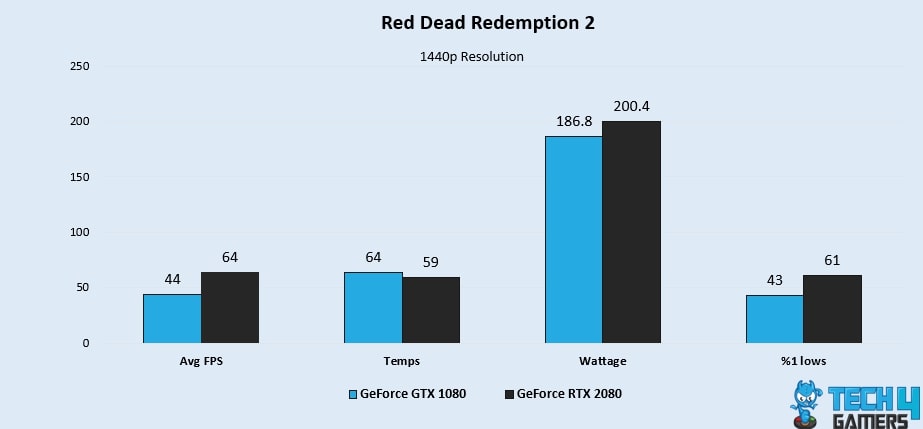
- With its remarkable performance in our RDR 2 benchmarks, the RTX 2080 sets itself apart, achieving an impressive average FPS of 64 vs 44 in benchmark tests, outshining the GTX 1080 by a notable 37%.
- Moreover, the RTX 2080 delivers superior 1% low performance, showcasing a significant 34.6% improvement with 61 FPS compared to the GTX 1080’s 43 FPS.
Overall Gaming Performance
| Processor | Average FPS | 1% Lows |
|---|---|---|
| GeForce GTX 1080 | 📈 38.5 | 📉 31.7 |
| GeForce RTX 2080 | 📈 57.8 | 📉 42.4 |
| Winner: GeForce RTX 2080 | ||
Based on our comprehensive benchmark analysis, it becomes clear that the RTX 2080 surpasses the GTX 1080 in both FPS and 1% lows as it delivers a remarkable 40.2% higher FPS performance compared to the GTX 1080, solidifying its position as the preferred graphics card for gaming purposes.
Average Power Consumption
| Processor | GeForce GTX 1080 | GeForce RTX 2080 |
|---|---|---|
| Average Power Consumption | 178.6 ⚡️ | 214.8 ⚡️ |
| Winner: GeForce GTX 1080 | ||
Regarding the power consumption charts obtained from our benchmarks, the RTX 2080 exhibits a higher TDP rating, which is 17.7% inferior to the TDP of the GTX 1080. To emphasize, the average power consumption of the RTX 2080 during benchmark testing is 18.4% higher than the GTX 1080.
Average Thermal Statistics
| Processor | GeForce GTX 1080 | GeForce RTX 2080 |
|---|---|---|
| Average Thermal Efficiency | 67.3 🌡️ | 60.7 🌡️ |
| Winner: GeForce RTX 2080 | ||
During our benchmark testing, we found that the GTX 1080 had higher temperatures compared to the RTX 2080. On average, the RTX 2080 ran at a thermal efficiency that was 10.3% higher than the RTX 2080. This further increases the points in RTX 2080’s pool for recommendation.
Pricing And Availability
| Processor | Launch MSRP | Current Price |
|---|---|---|
| GeForce GTX 1080 | 💲599 | 💲300 |
| GeForce RTX 2080 | 💲699 | 💲750 |
| Price Difference | 16.7% | 150% |
It is important to highlight that the GeForce GTX 1080 comes at a significantly lower cost, with a price that is roughly 150% lower than that of the RTX 2080. However, it is essential to recognize that these price estimates are not fixed and can change as the dynamics of the market evolve.
GeForce GTX 1080 Vs RTX 2080: What’s The Performance Difference?
GeForce RTX 2080: Firstly, the RTX 2080 presents a compelling, cost-effective option, with a notable 52.7% price difference and a 40.2% improvement in average FPS performance over the GTX 1080. Moreover, it also features better thermal efficiency only with a tradeoff of higher power draw and price.
GeForce GTX 1080: On the other hand, despite the GTX 1080’s lower power consumption of 18.4%, it maintains a significantly higher average temperature of 10.3% compared to the RTX 2080. Moreover, it also fails to meet the targets set by the RTX 2080.
Although the GTX 1080 offers better power efficiency, the RTX 2080 outshines it with its remarkable performance and outstanding thermal efficiency. We recommend that consumers buy the RTX 2080 based on the results from our benchmarks.
More From RTX 2080:
More From GTX 1080:
Thank you! Please share your positive feedback. 🔋
How could we improve this post? Please Help us. 😔
[Comparisons Expert]
Shehryar Khan, a seasoned PC hardware expert, brings over five years of extensive experience and a deep passion for the world of technology. With a love for building PCs and a genuine enthusiasm for exploring the latest advancements in components, his expertise shines through his work and dedication towards this field. Currently, Shehryar is rocking a custom loop setup for his built.
Get In Touch: shehryar@tech4gamers.com


