")


Nvidia GeForce RTX 2080
Rated: 8.5/10
Nvidia GeForce RTX 3080
Rated: 8.8/10
Pros And Cons
| GPU | Pros | Cons |
|---|---|---|
| Nvidia GeForce RTX 2080 | ✅ Good for 1440p & 1080p gaming ✅ Support Ray tracing and DLSS | ❌ Not enough capable for 4K gaming ❌ No discernible performance jump |
| Nvidia GeForce RTX 3080 | ✅ Better ray tracing and 4K gaming ✅ Stunning memory interface and speed | ❌ Draws much higher power ❌ Generates more heat under stress |
- In our gaming performance assessments, the GeForce RTX 3080 outperforms the RTX 2080 by an average margin of approximately 50%.
- According to our efficiency test, the RTX 2080 outperforms the RTX 3080 with a margin of 58% in power efficiency and 5.6% in thermal efficiency.
- Given the price of GPUs, the refurbished RTX 3080 is now selling for about $449, and the renewed RTX 2080 cards are available for around $229.
- We suggest the RTX 3080 for its improved gaming performance, and the RTX 2080 to budget conscious users for its cheap price and lower running cost.
Comparison Table
| Feature | GeForce RTX 2080 | GeForce RTX 3080 |
|---|---|---|
| CUDA Cores | 2944 | 8960 / 8704 |
| Ray Tracing Cores | 46 | 68 |
| Base Clock | 1.52 GHz | 1.26 GHz / 1.44 GHz |
| Boost Clock | 1.80 GHz | 1.71 GHz |
| Memory Clock / Speed | 1750 MHz (14 Gbps effective) | 1188 MHz (19 Gbps effective) |
| GPU TDP | 225 watt | 350 W / 320 W |
| Maximum Temperature | 88°C | 93°C |
| Best Variants | – | Best RTX 3080 |
Architectural Difference
- Architecture: The RTX 2080 features Nvidia’s Turing architecture from the first RTX generation, while the RTX 3080 utilizes Ampere architecture, an unparalleled technology in the field.
- GPU Chip: Considering the GPU chip, the RTX 2080 has TU104 (12nm), while the RTX 3080 (8nm) has a more brilliant GA102 chip.
- Clock Speed: Regarding the GPU base clock speed, the 10GB and 12GB RTX 3080 GPUs have a 17.1% and 4% higher frequency than the RTX 2080, respectively.
- VRAM: The RTX 3080 launched in two variants with different memory configurations: 384-bit 12GB GDDR6X and 320-bit 10GB GDDR6X. In comparison, the RTX 2080 features 256-bit 8GB GDDR6 memory.
- Advanced Technologies: The RTX 2080 features 1st gen Ray Tracing and 2nd gen Tensor cores, while the RTX 3080 has 2nd gen Ray Tracing and 3rd gen Tensor cores. Both GPUs also include Nvidia DLSS.
The RTX 2080 is the high-end GPU of its era launched by Nvidia in their initial RTX 20 series. Contrarily, the RTX 3080 is a top-tier graphics card of Nvidia’s RTX 30 series. In RTX 2080 vs RTX 3080, we will scrutinize the extent of performance improvements and added features implemented by Nvidia in the two GPUs.
Gaming Benchmarks
The most sensible way to assess a graphics card’s performance is to examine its gaming capabilities. In the RTX 2080 vs RTX 3080 benchmarks, we shall assess their performance and respective efficiencies across 10 demanding games at 1440p resolution. The system’s technical specifications utilized to run these games are provided below.
Gaming Rig
- OS: Windows 10 Pro
- CPU: Intel Core i7-13700K
- Motherboard: MSI Z790 Tomahawk Max WiFi Motherboard
- RAM: Kingston Fury Renegade RGB DDR5 32GB 7200MHz
- SSD: Sabrent Rocket 4 Plus G 2TB NVMe SSD
- Power Supply: ENERMAX REVOLUTION D.F. X 1050W
- CPU Cooler: Noctua NH-L9x65 chromax.black CPU Air Cooler
Assassin’s Creed Odyssey
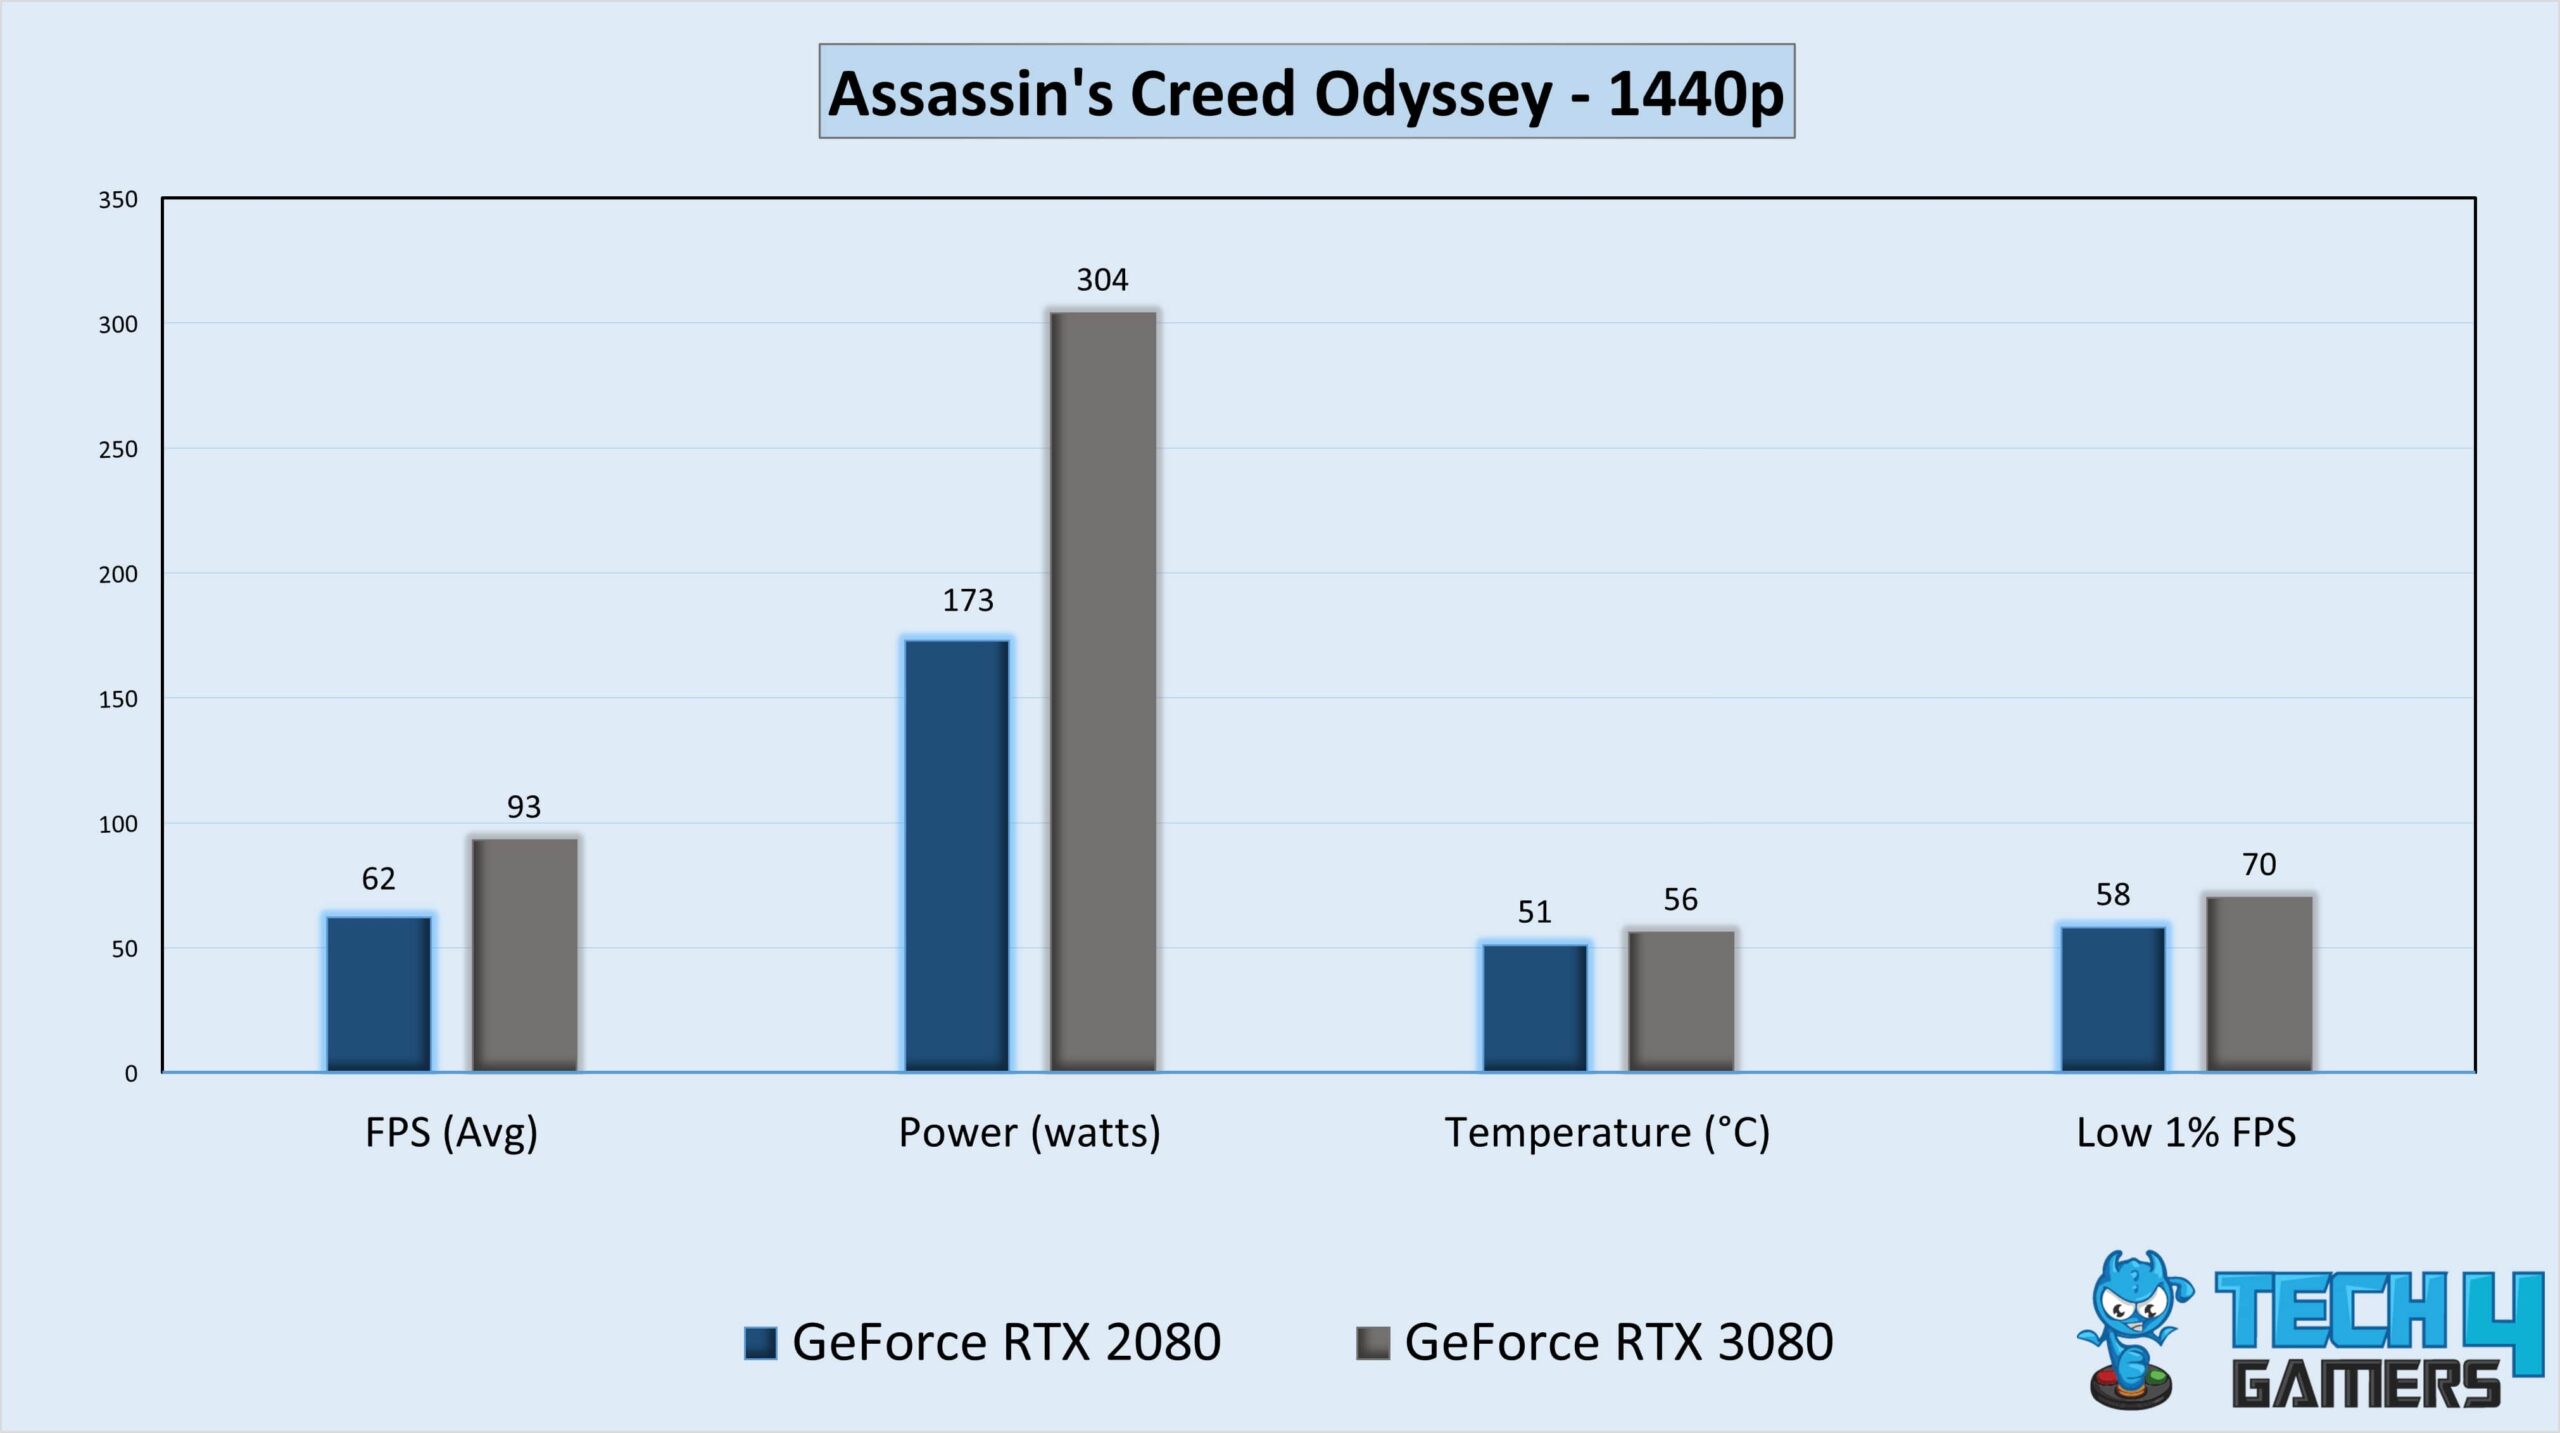
- In our first Assassin’s Creed Odyssey gameplay, the 93 FPS average performance of the RTX 3080 was 50% superior to the RTX 2080’s 62 FPS.
- If we see the low 1% frame rate, the RTX 3080 yield a beautiful 70 FPS, while the RTX 2080 could only work out 58 FPS.
Battlefield V
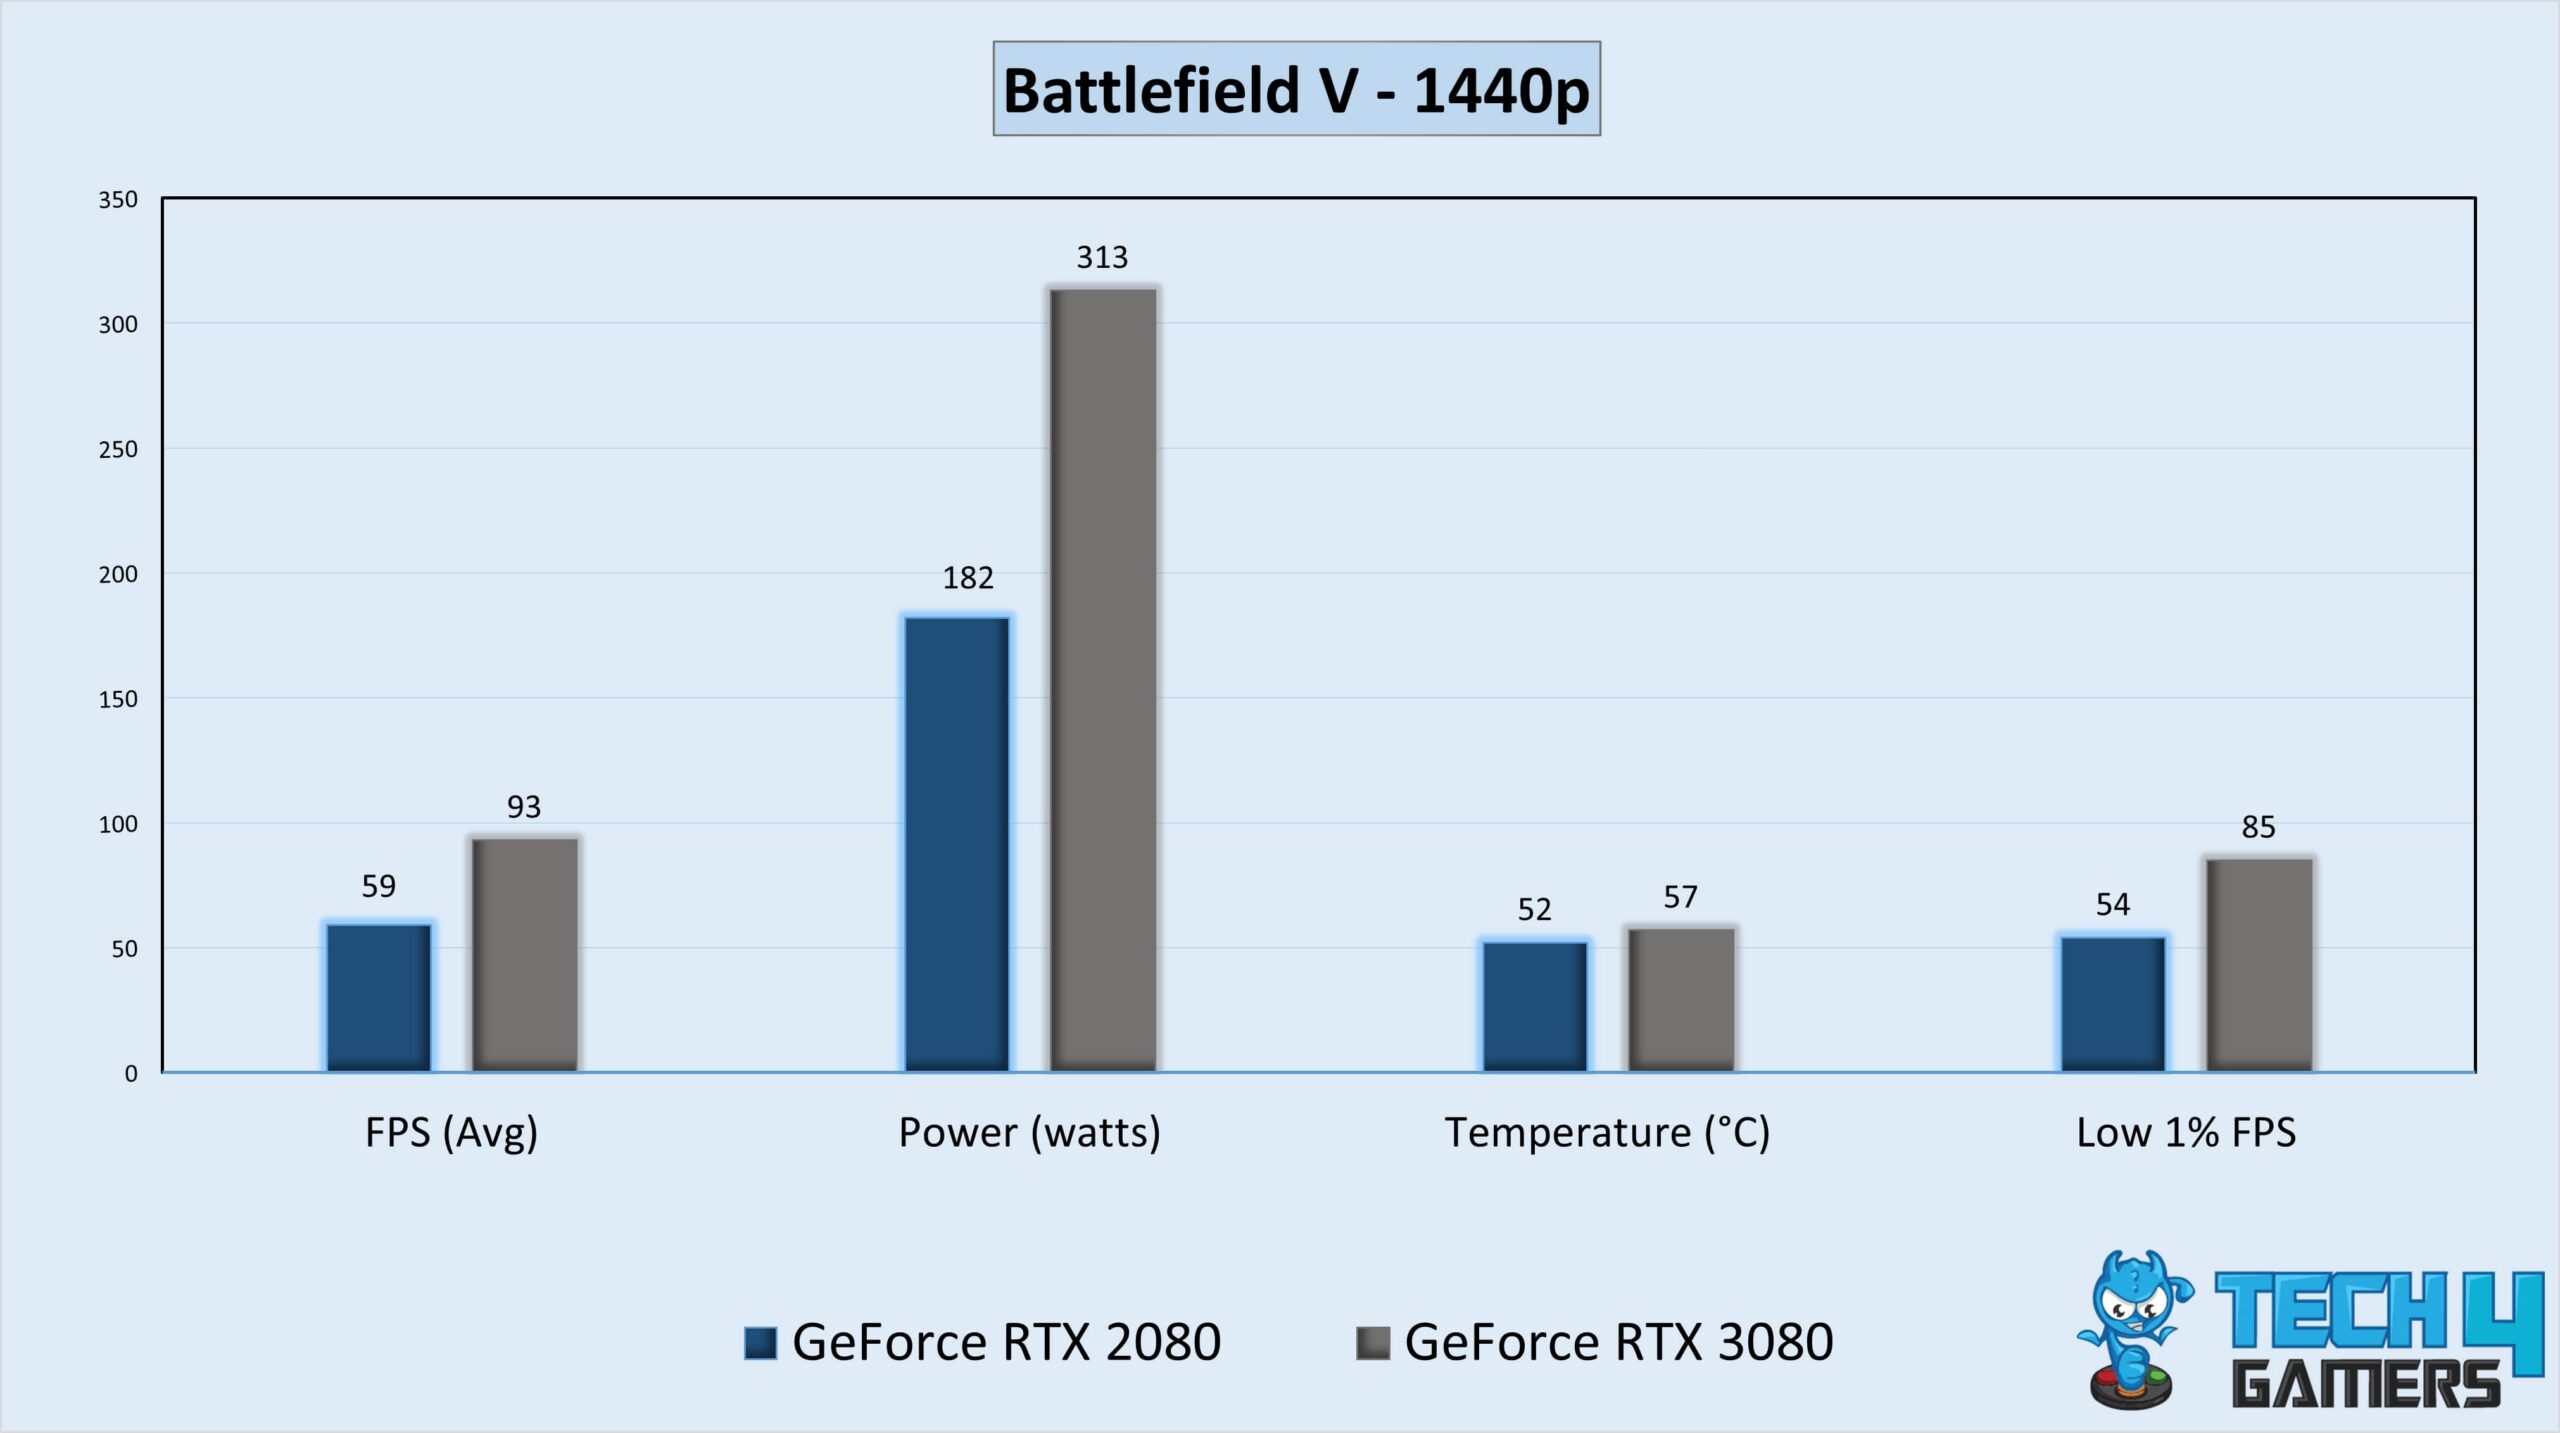
- We saw that the RTX 3080 fared 57.6% or 34 FPS higher frame rate than the RTX 2080 in Battlefield V.
- If we look at the low 1% frame rate, the RTX 3080 produced a stunning 85 FPS, whereas the RTX 2080 could only produce 54 FPS.
Control
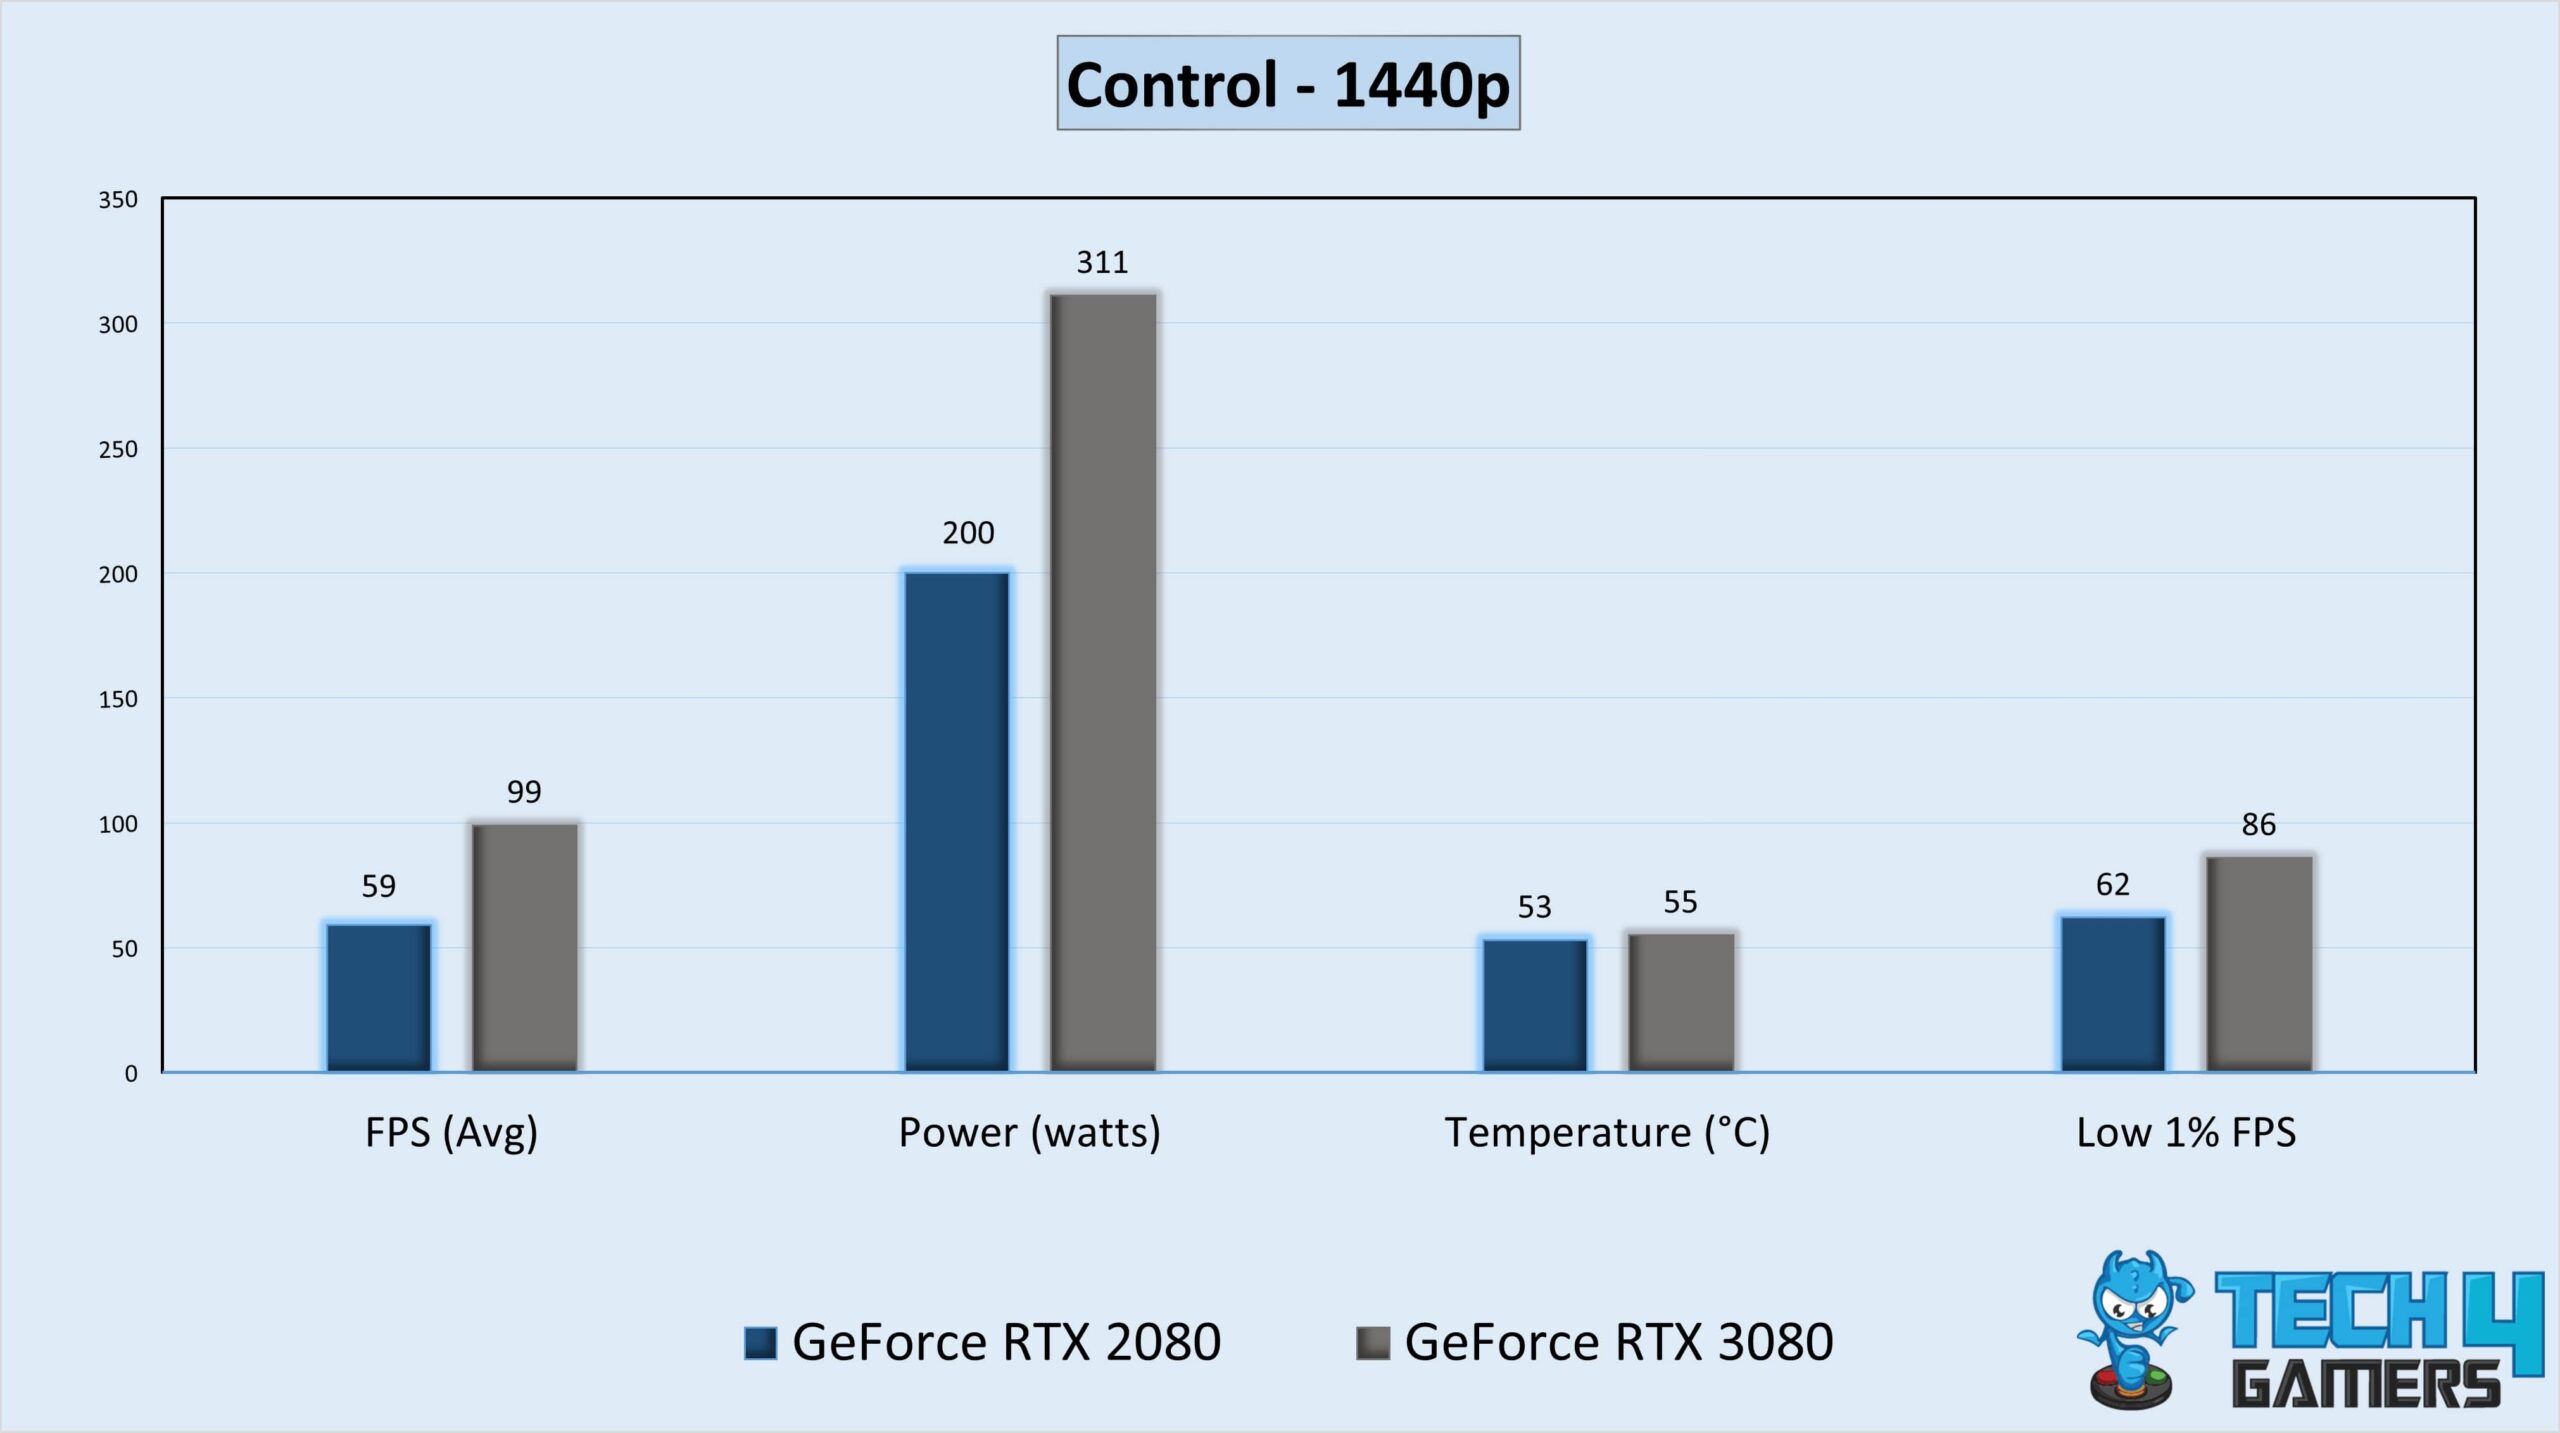
- In Control, the RTX 3080 rendered 99 FPS, about 68% more profitable performance than the RTX 2080’s 59 FPS.
- The RTX 3080 turned an impressive 86 FPS at the low 1% frame rate, while the RTX 2080 could only manage 62 FPS.
Forza Horizon 4
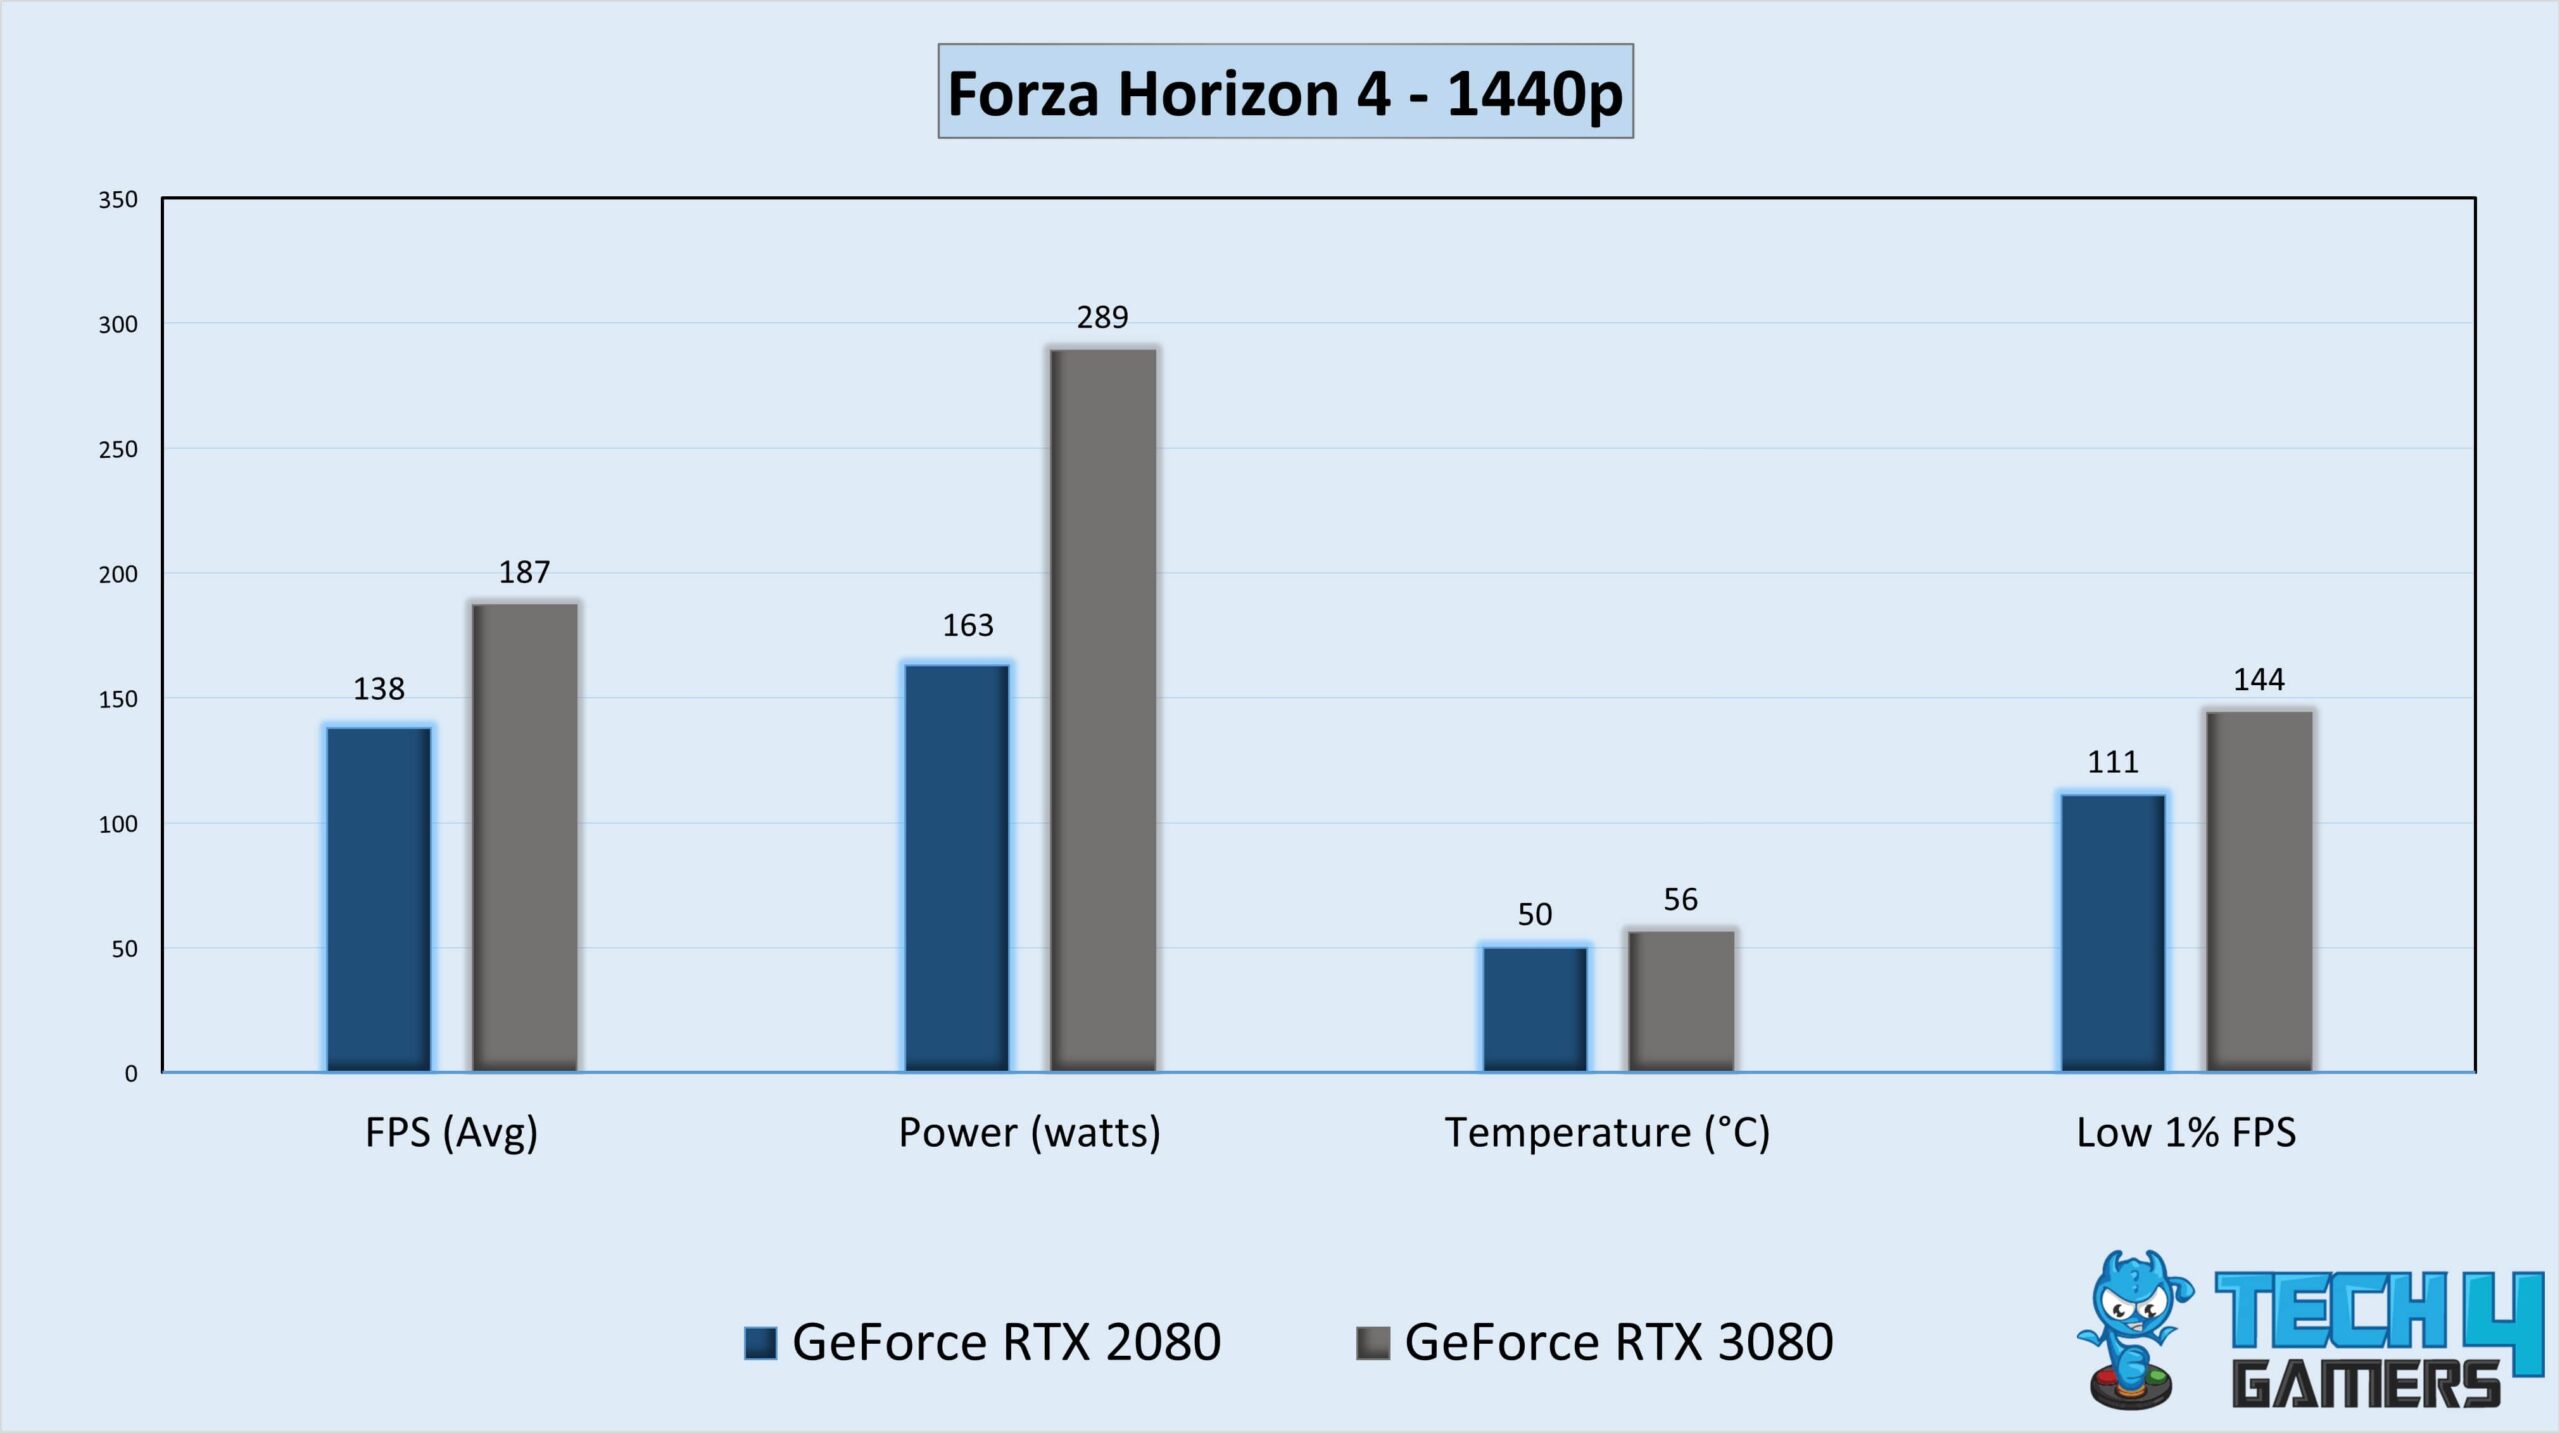
- During our Forza Horizon 4 session, the RTX 3080 performed 35.5% or 49 FPS better than the RTX 2080.
- While the RTX 2080 could barely muster 111 FPS at the low 1% performance, the RTX 3080 produced an astounding 144 FPS.
Horizon Zero Dawn
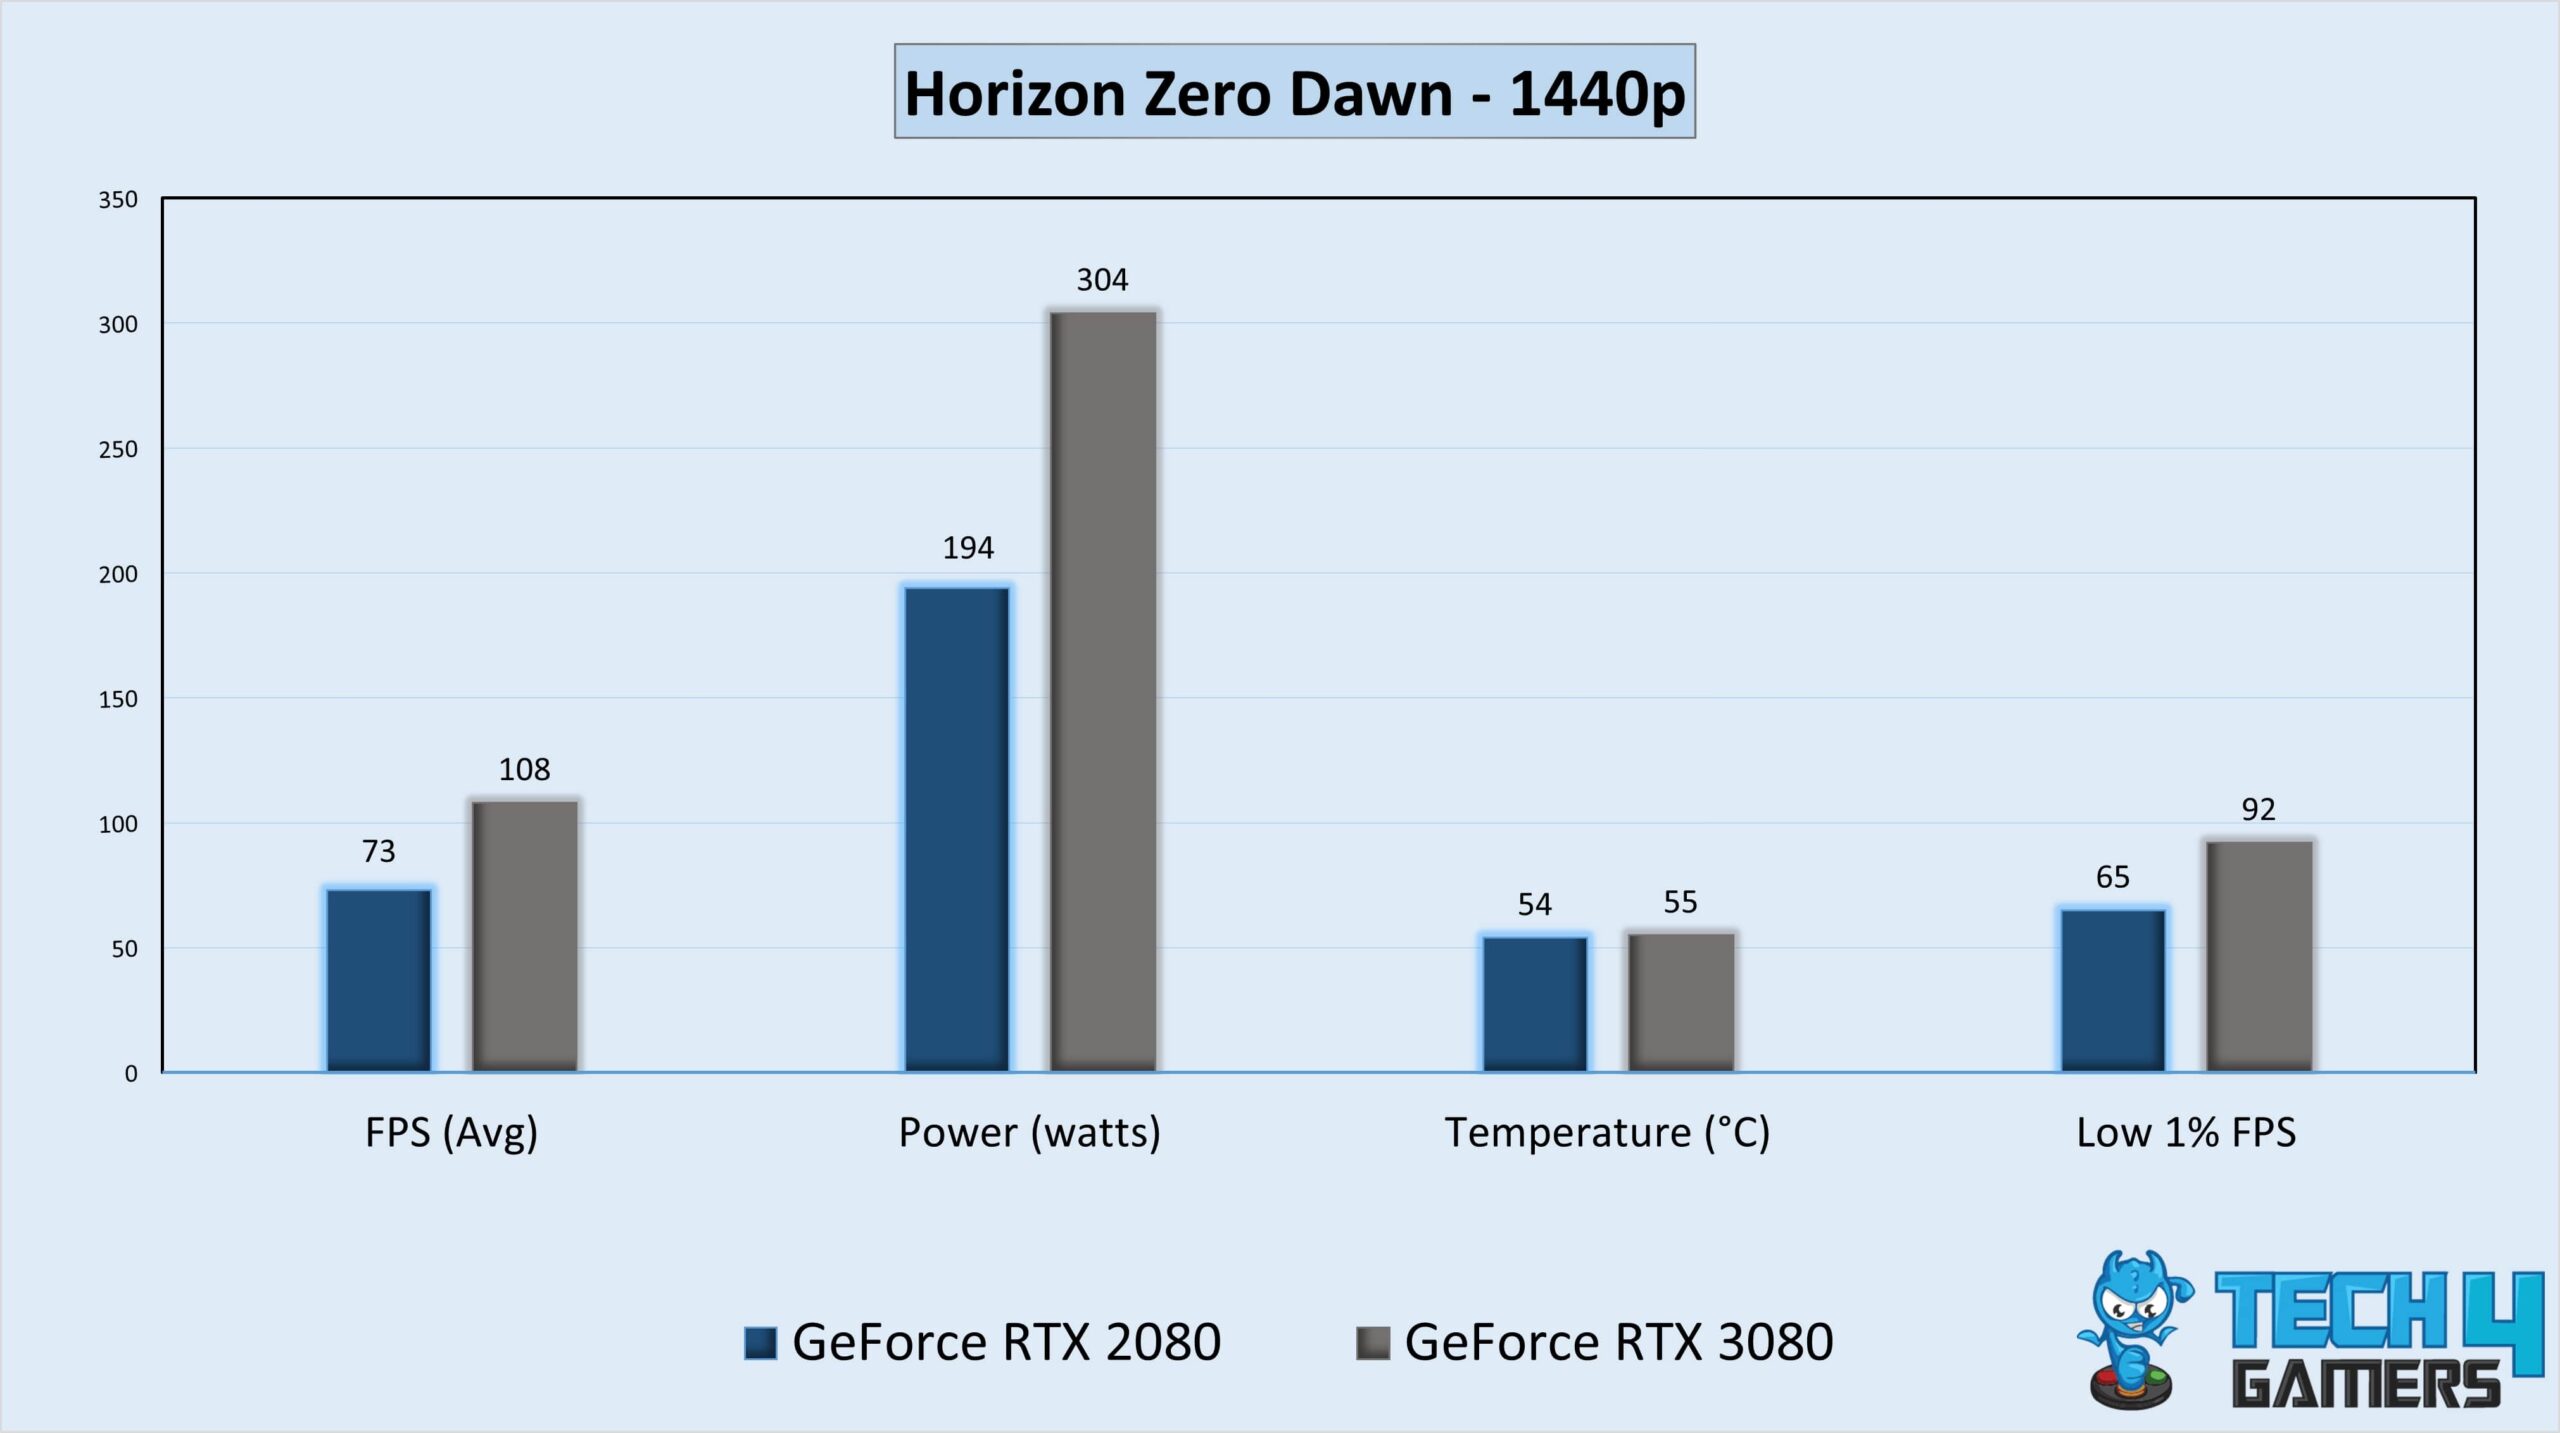
- The RTX 3080 outperformed the RTX 2080 by 48% or 35 FPS in Horizon Zero Dawn, delivering 108 FPS on average.
- Regarding low 1% performance, the RTX 3080 achieved an astonishing 92 FPS, whilst the RTX 2080 could only muster 65 FPS.
Kingdom Come Deliverance
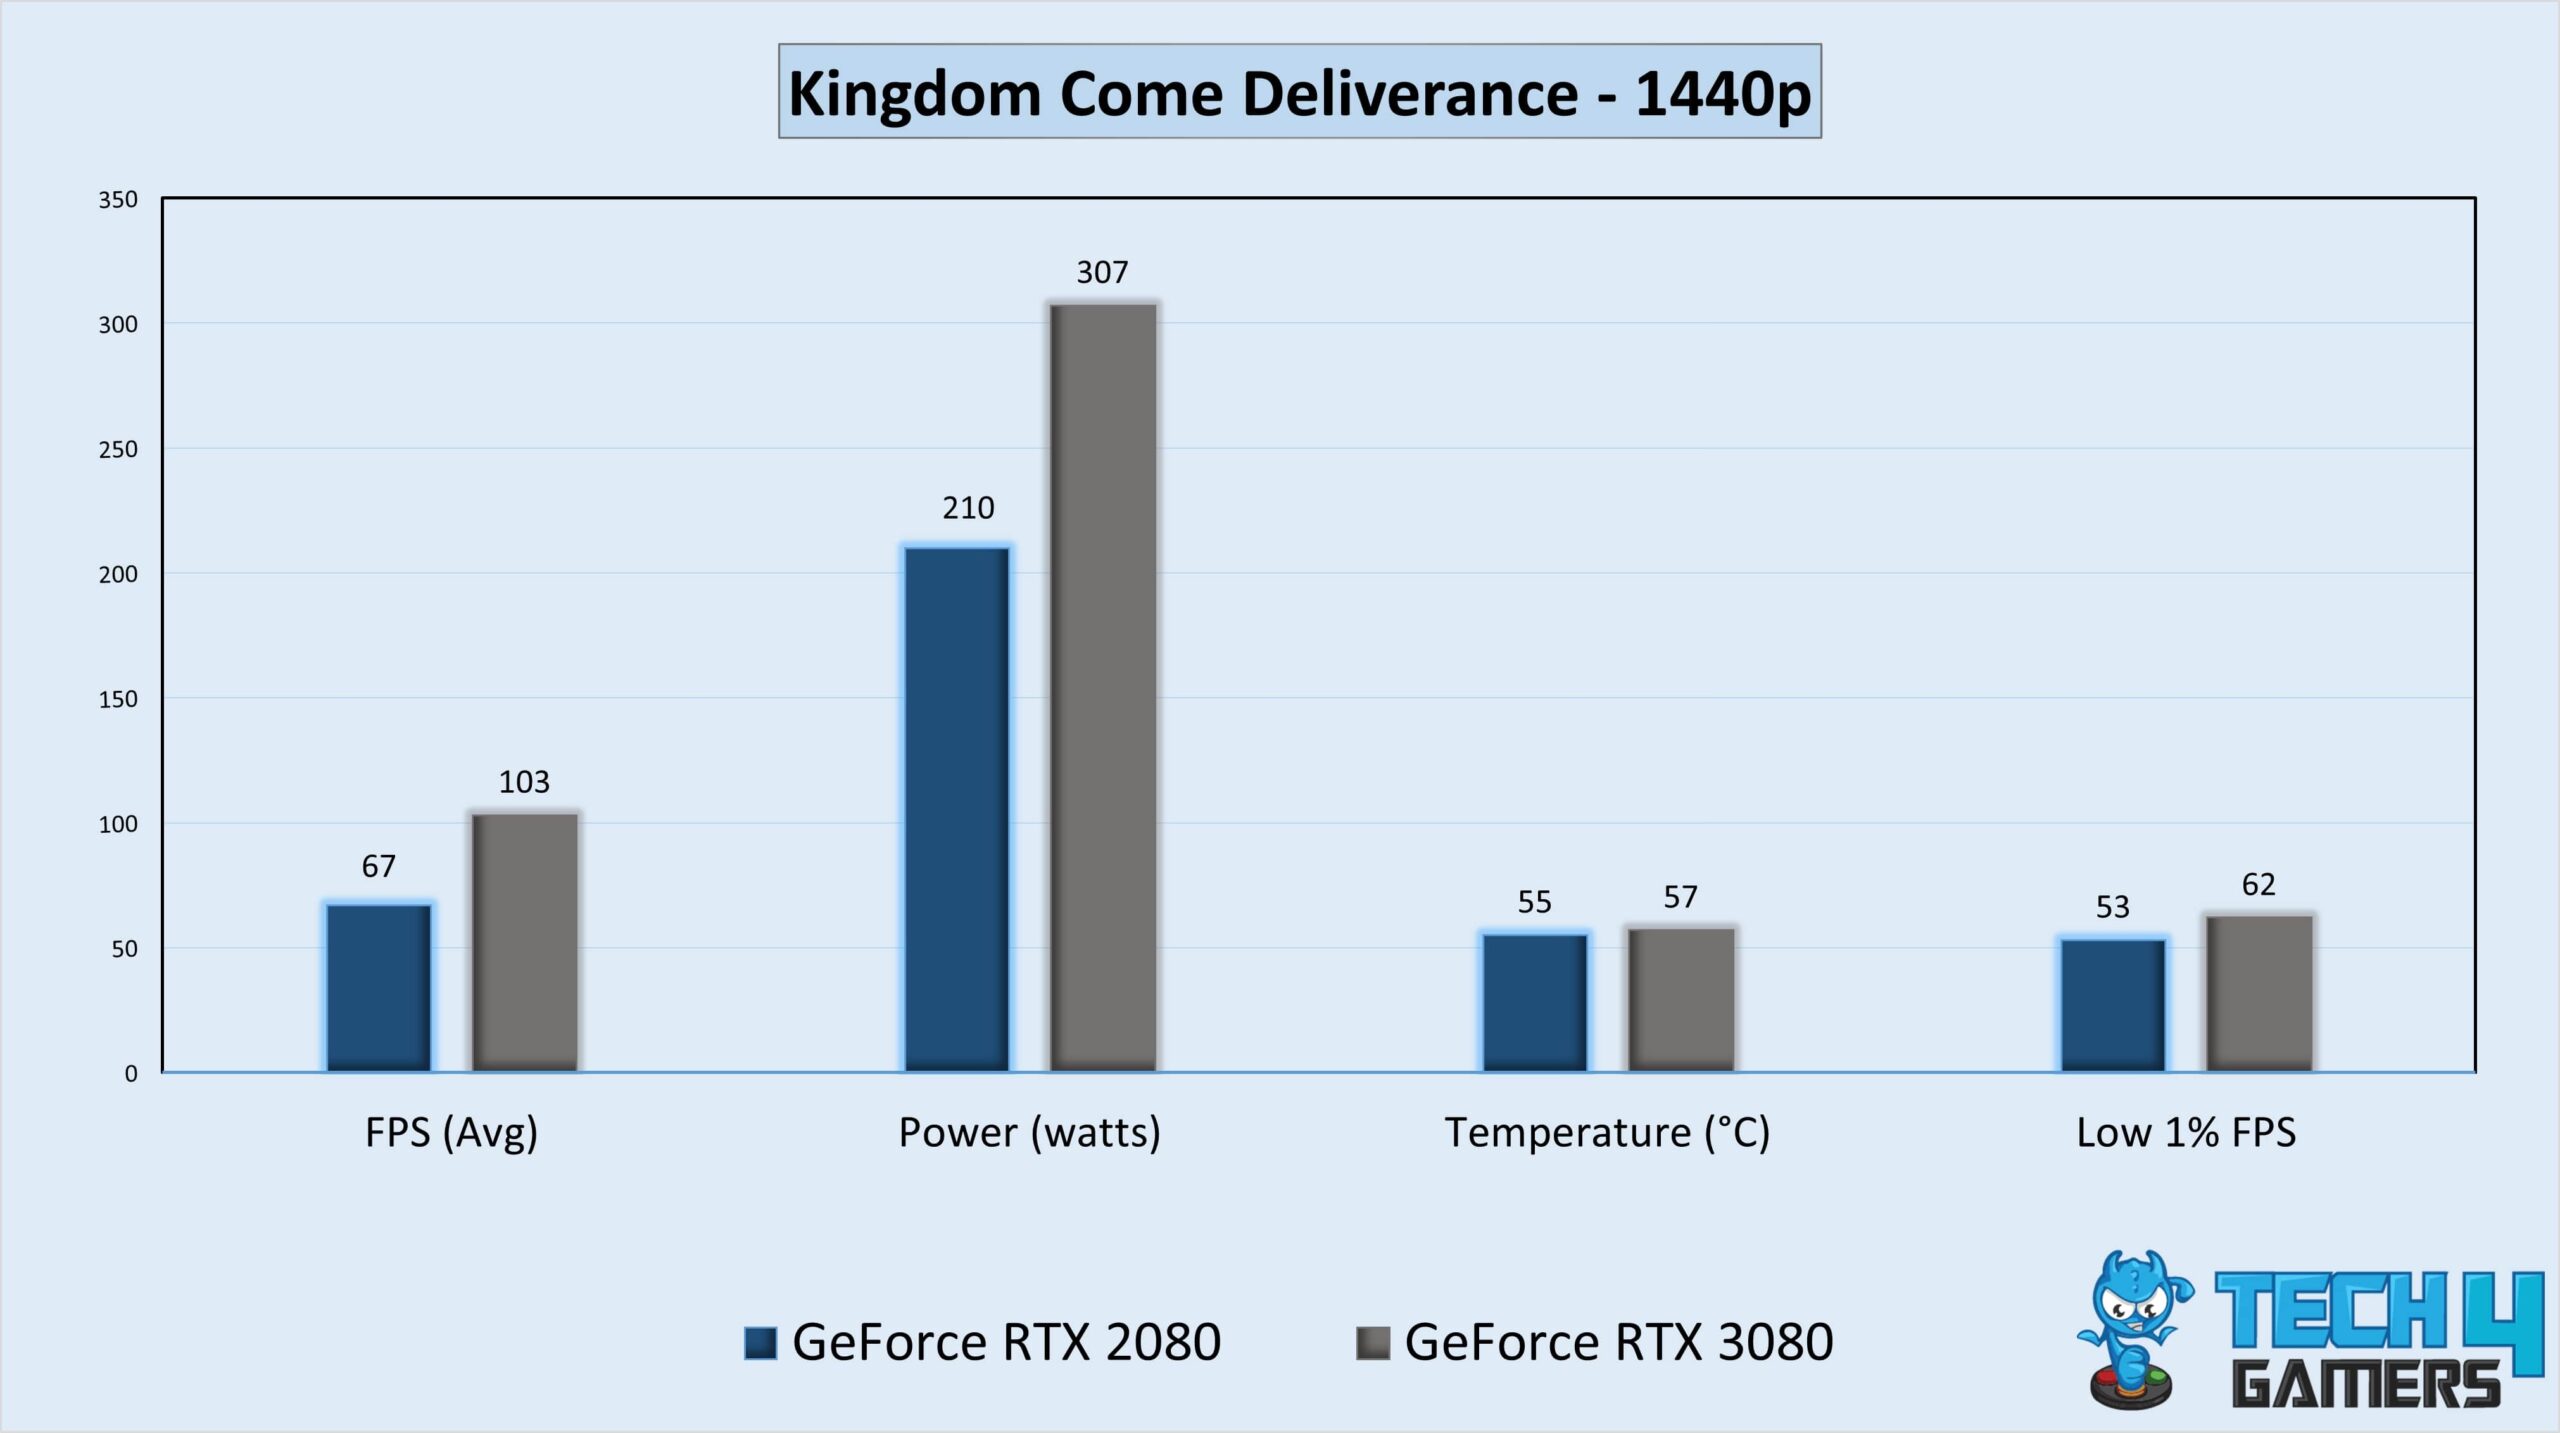
- In our Kingdom Come Deliverance session, the RTX 3080 provided 103 FPS on average, surpassing the RTX 2080 by 54% or 36 FPS.
- During Kingdom Come Deliverance, the RTX 3080 reached an astounding 62 FPS in the low 1%, whilst the RTX 2080 could only manage 53 FPS.
Mafia: Definitive Edition
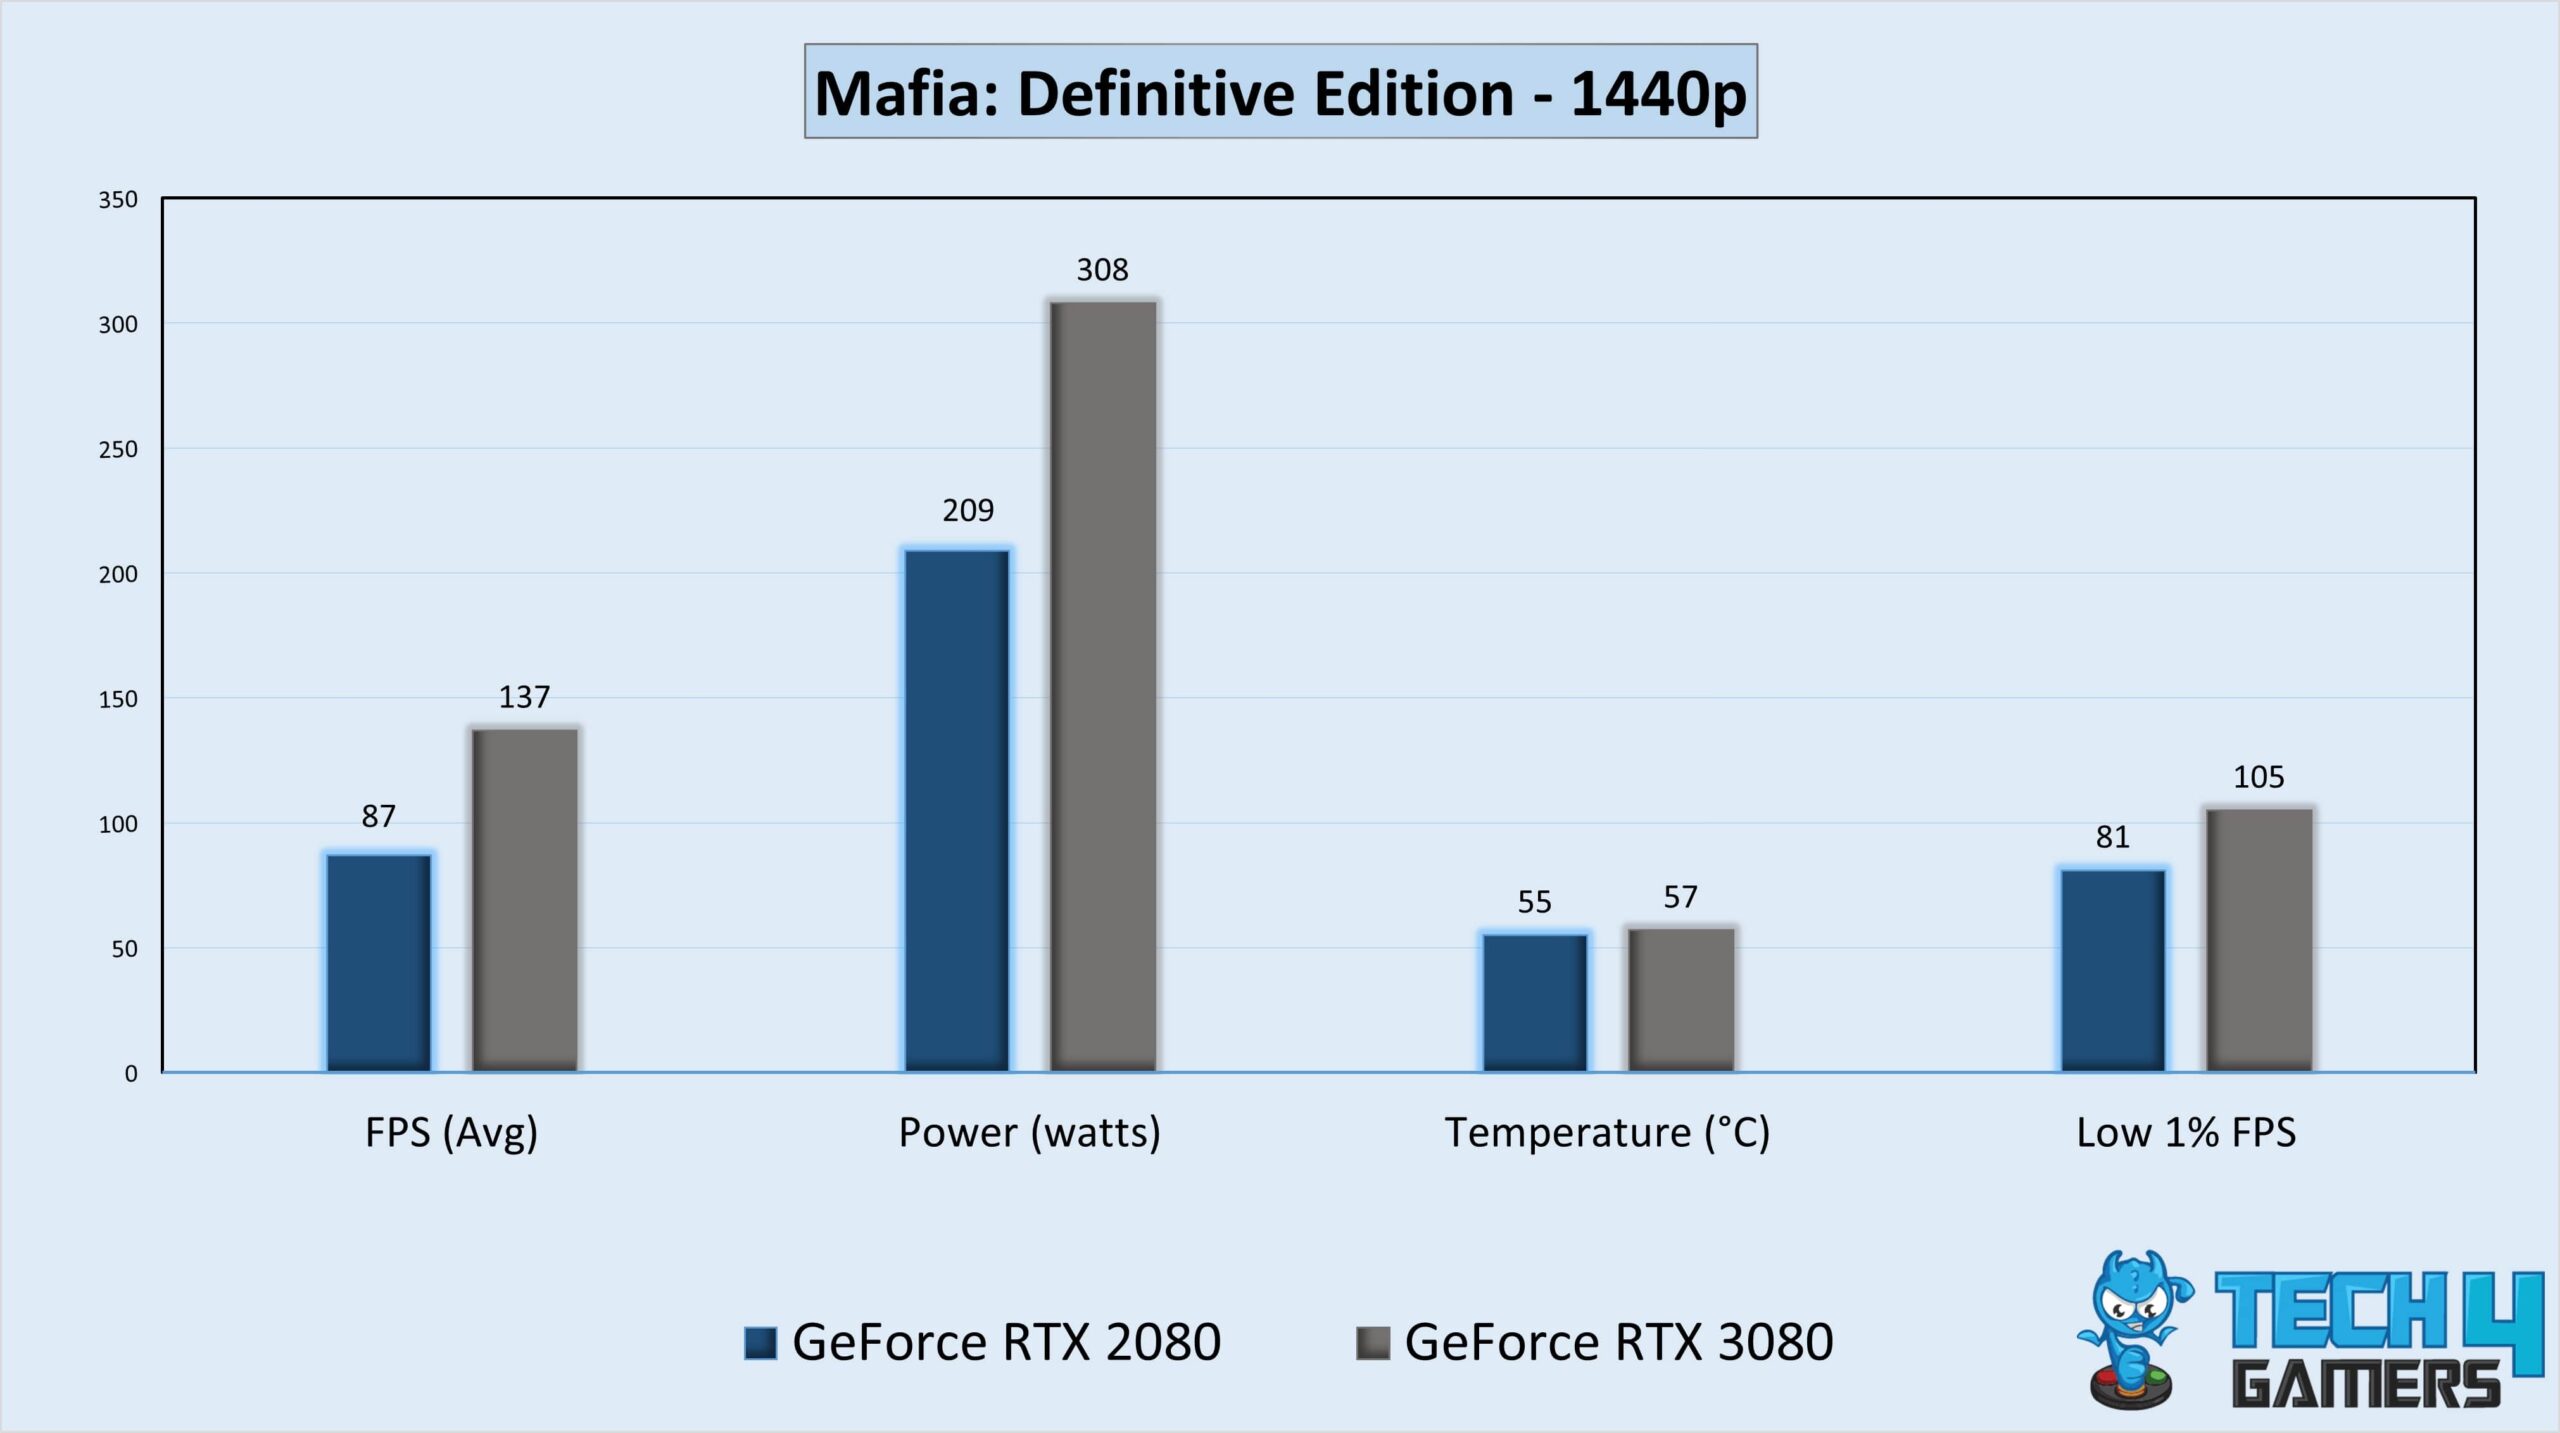
- In Mafia: Definitive Edition, the RTX 3080 provided an average frame rate of 137 FPS, a 57.4% better performance than the RTX 2080.
- When comparing the low 1% frame rates, the RTX 3080 delivered an astounding 105 FPS, while the RTX 2080 could only manage 81 FPS.
Microsoft Flight Simulator
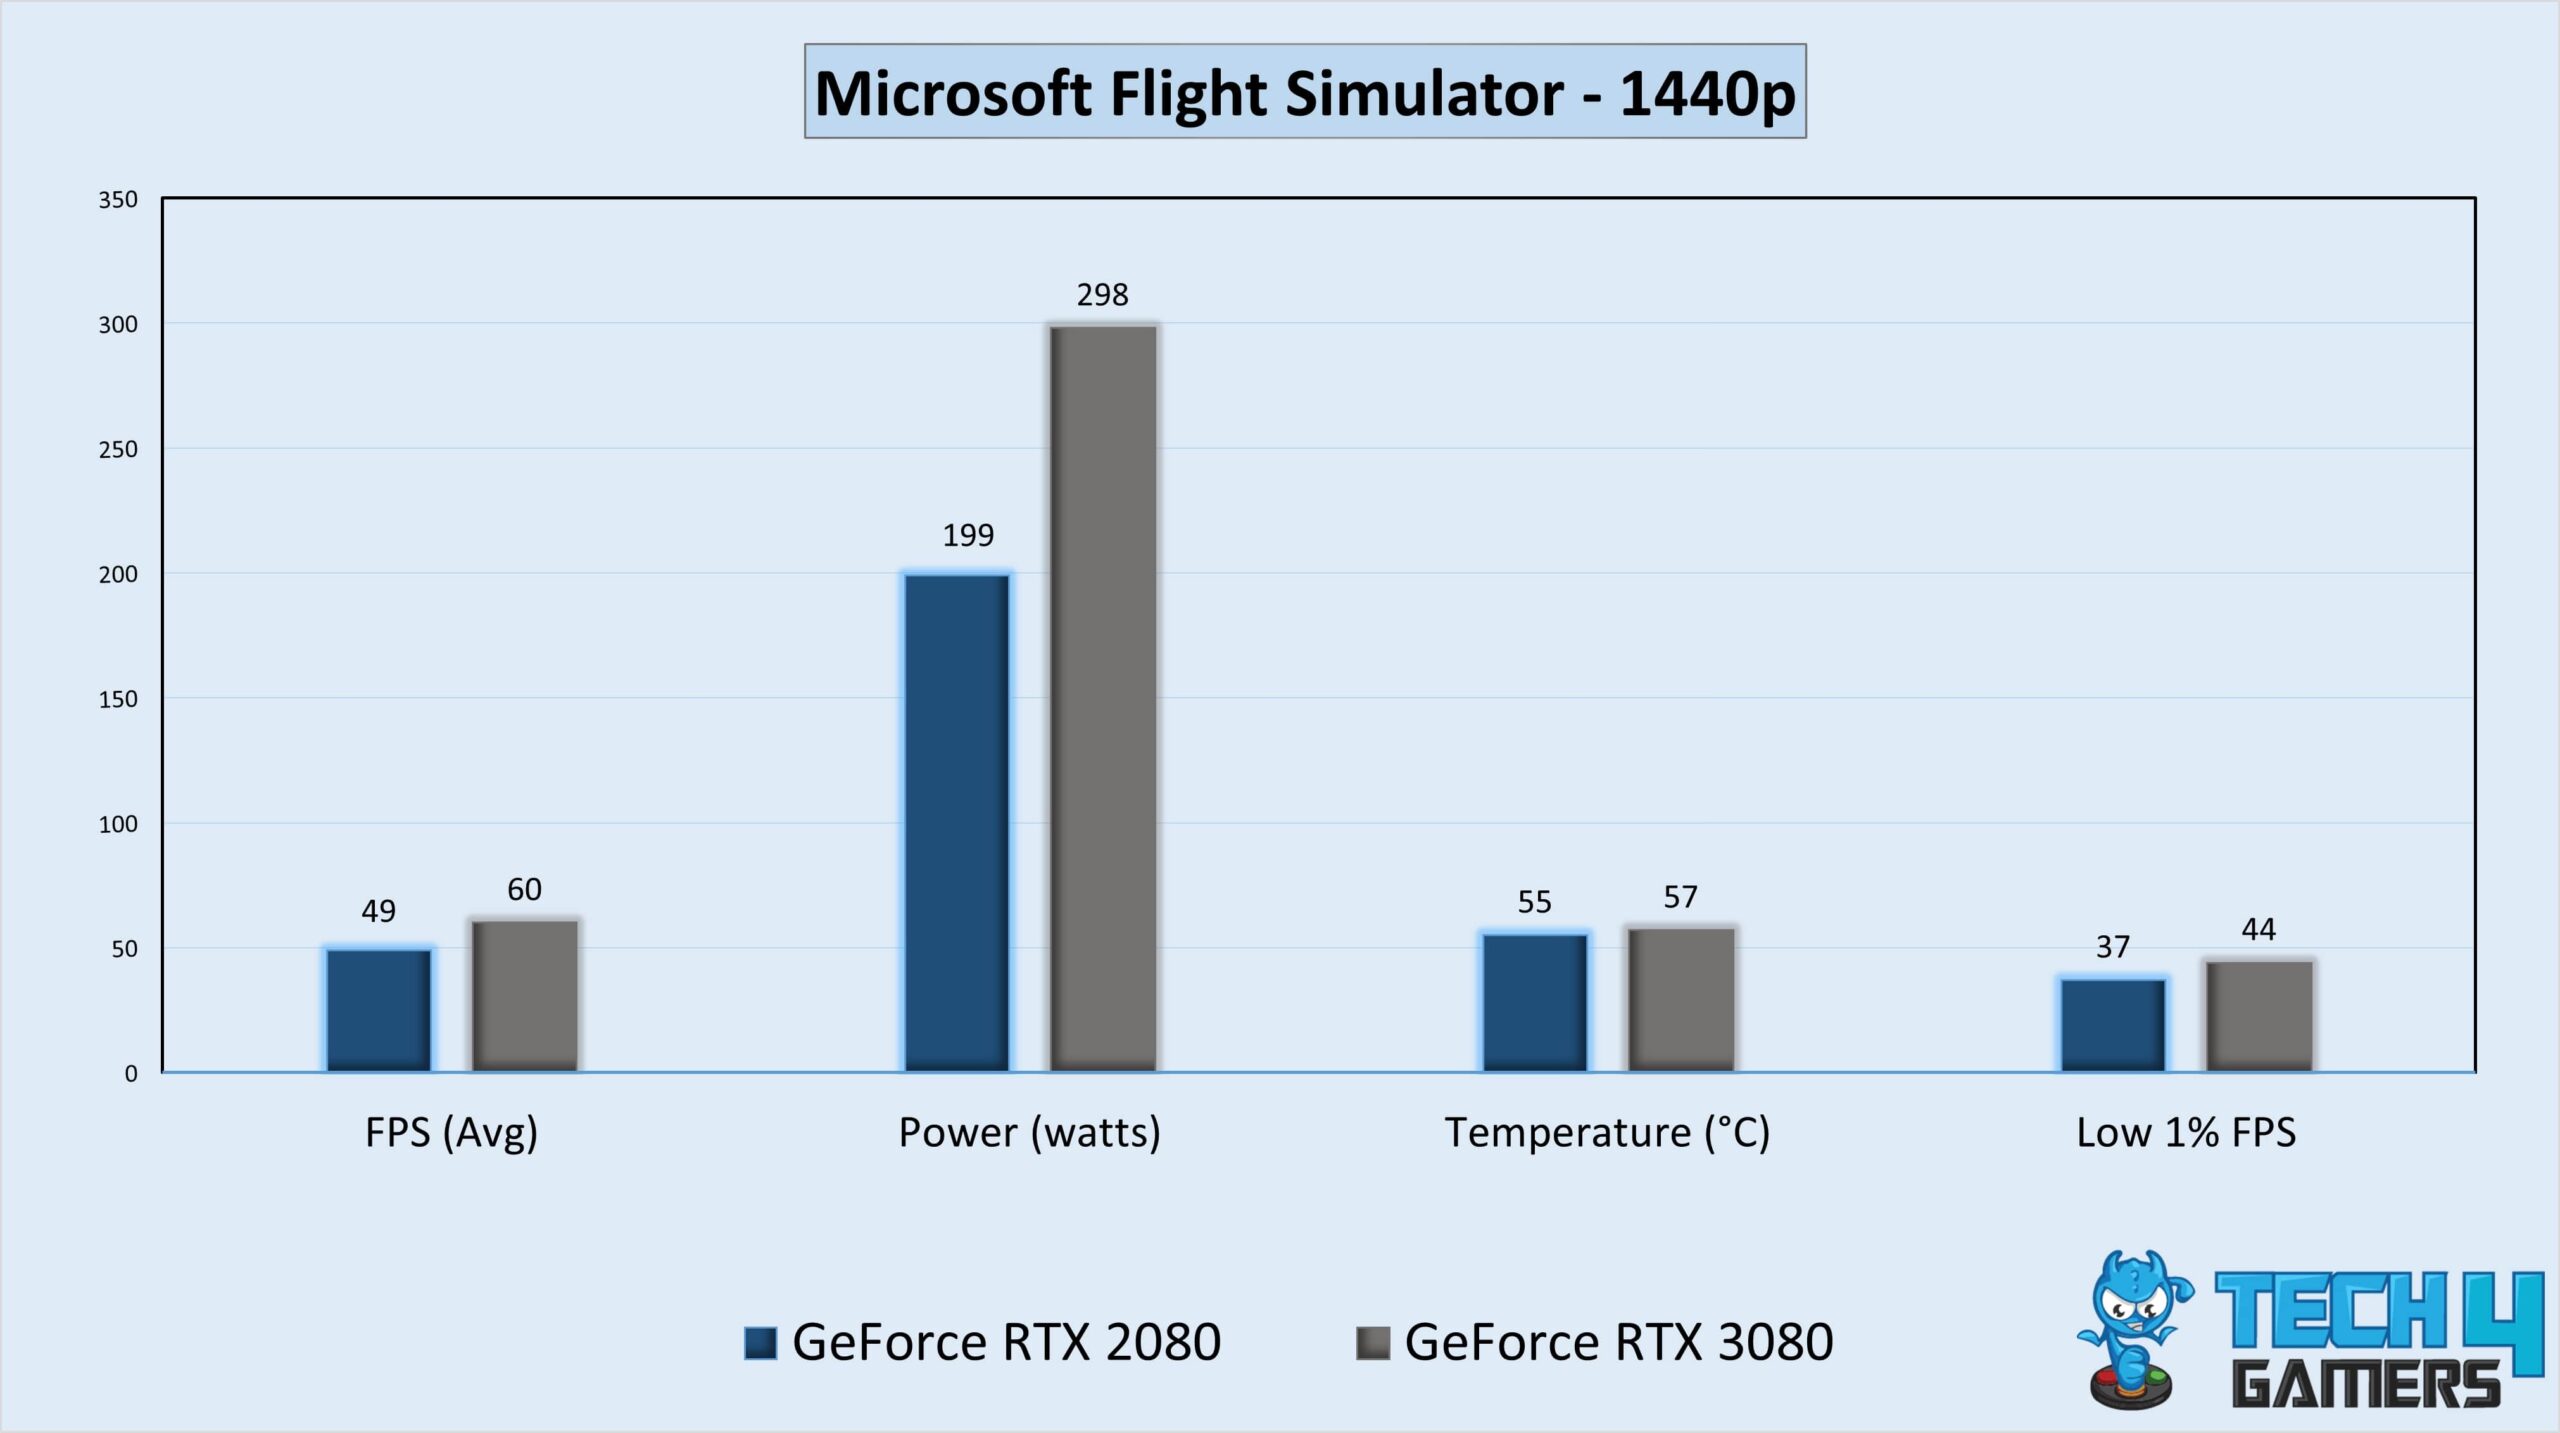
- The performance of the RTX 3080 was 22.4% or 11 FPS better than the RTX 2080 in Microsoft Flight Simulator.
- The RTX 3080 produced 44 FPS at the low 1% frame rate, whereas the RTX 2080 could only muster 37 FPS.
Red Dead Redemption 2
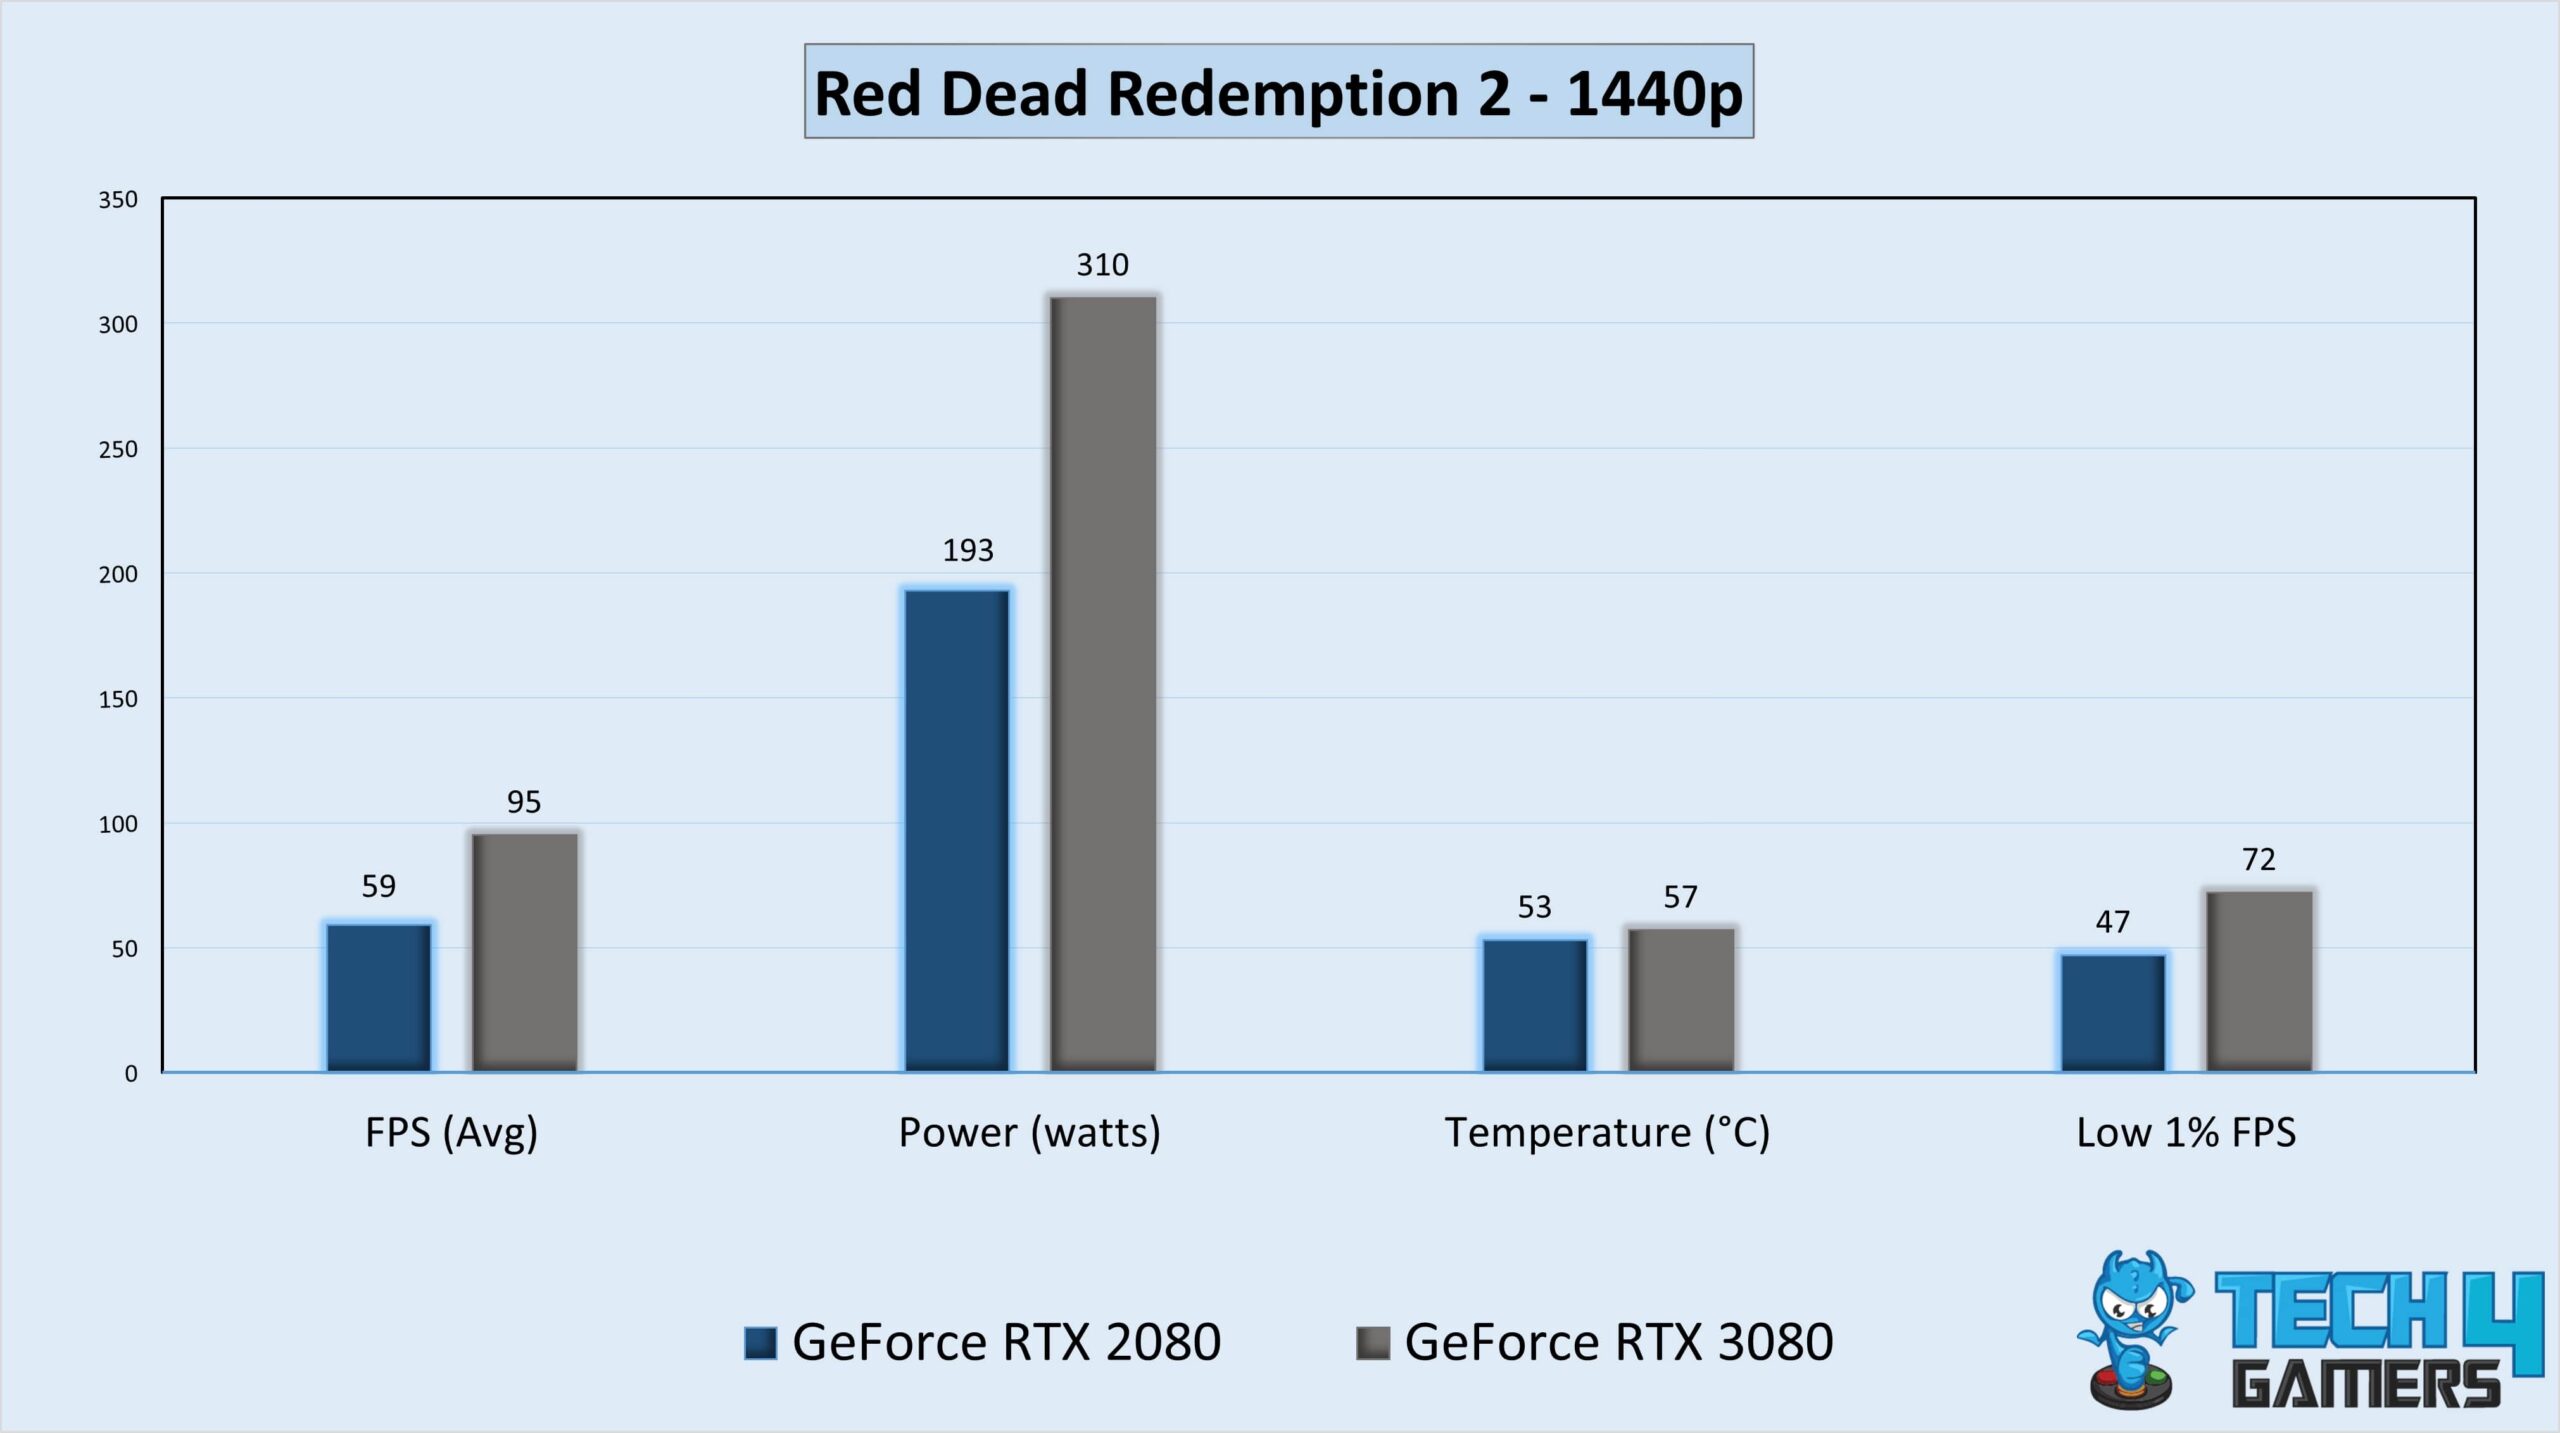
- During Red Dead Redemption 2 gameplay, we noted that the RTX 3080 performed 61% better than the RTX 2080 by delivering 95 FPS against 59 FPS.
- The RTX 2080 could barely manage 47 FPS, whereas the RTX 3080 produced an impressive 72 FPS at the low 1% frame rate.
The Witcher 3: Wild Hunt
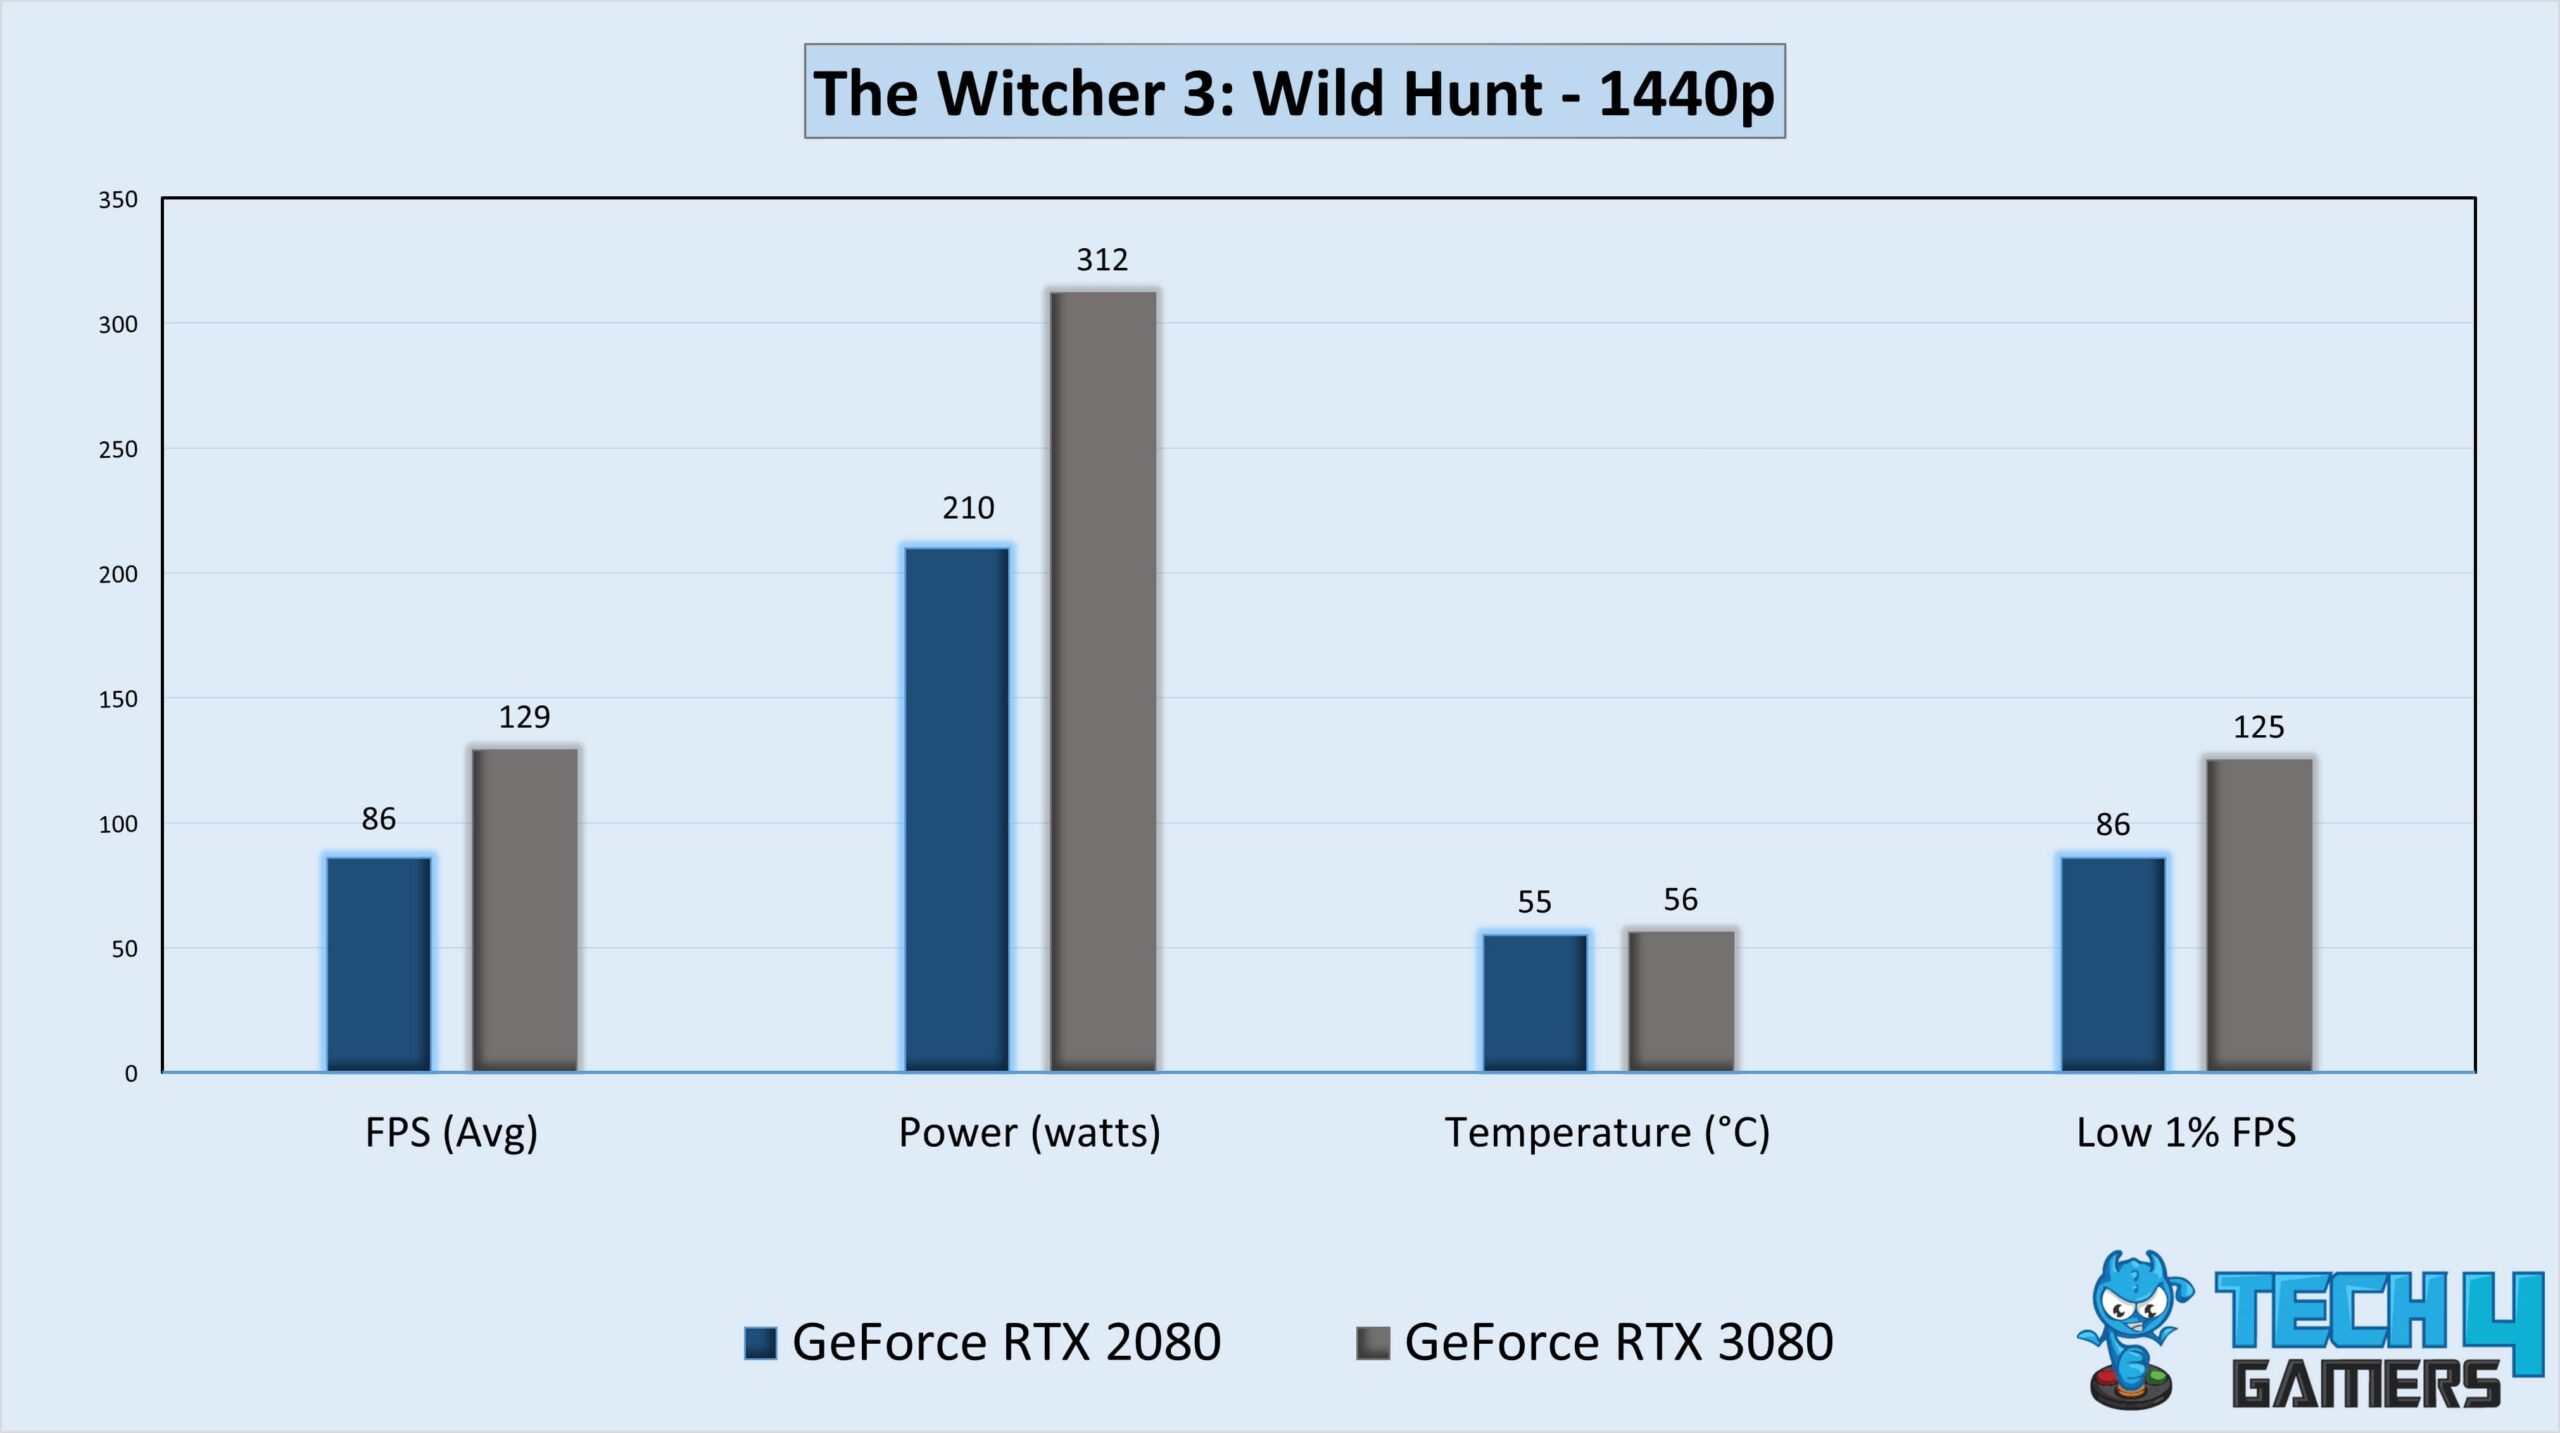
- In our last session of The Witcher 3: Wild Hunt, the performance of the RTX 3080 was 50% greater than the RTX 2080’s 86 FPS.
- At the low 1% performance, the RTX 3080 achieved an astounding 125 FPS, whereas the RTX 2080 mustered up 86 FPS.
Overall Gaming Performance
| Stats | GeForce RTX 3080 | GeForce RTX 2080 |
|---|---|---|
| Average FPS | 110.4 📈 | 73.9 📉 |
| Low 1% FPS | 88.5 📈 | 65.4 📉 |
| Winner: Nvidia GeForce RTX 3080 | ||
In the gaming performance battle of RTX 2080 vs RTX 3080, the RTX 3080 showcases a remarkable average performance advantage over the RTX 2080, boasting an impressive margin of approximately 50%. Coming to the low 1% FPS category, the RTX 3080 once more outperformed the RTX 2080, with an amazing average advantage of about 35.3%.
Power Efficiency
| Stats | GeForce RTX 3080 | GeForce RTX 2080 |
|---|---|---|
| Average Power Draw (W) | 305.6 ⚡ | 193.3 ⚡ |
| Winner: Nvidia GeForce RTX 2080 | ||
In regards to our gaming power efficiency test, the RTX 2080 surpasses the RTX 3080 by approximately 58%. When we assess the efficiency based on performance per watt, the RTX 2080 demonstrated greater efficiency in this scenario as well.
Thermal Efficiency
| Stats | GeForce RTX 3080 | GeForce RTX 2080 |
|---|---|---|
| Average Gaming Temperaure(°C) | 56.3 🌡️ | 53.3 🌡️ |
| Winner: Nvidia GeForce RTX 2080 | ||
In light of gaming temperature we noted for these GPUs, the RTX 2080 has a 5.6% greater thermal efficiency than the RTX 3080, which allows it to run cooler than RTX 3080 while gaming.
Price And Availability
| GPU | Launch MSRP | Current Price |
|---|---|---|
| Nvidia GeForce RTX 2080 | 💲699 | 💲229 (Refurbished) |
| Nvidia GeForce RTX 3080 | 💲699 | 💲449 (Refurbished) |
| Price Difference | 0% | 96% |
Nvidia launch these graphics cards at a same price point. However, as of February 2024, the price of the RTX 3080 is roughly double that of the RTX 2080. Regarding availability, these graphics processing units are readily found in renewed condition at many retailers.
Final Verdict: What Do We Recommend
GeForce RTX 2080: The RTX 2080 is good GPU for gaming at 1080p and 1440p resolution. The current price is quite minimal, and it boasts high power efficiency, resulting in significantly reduced operational costs.
GeForce RTX 3080: The RXT 3080 is a top-notch GPU with improved gaming skills. It can also be used for 4K gaming. It has significantly enhanced ray tracing and upscaling performance. Moreover, its memory specs are also wonderful.
For serious gamers prioritizing top performance and willing to invest, go for the RTX 3080. If cost-effectiveness, power efficiency, and strong thermal management are key, opt for the RTX 2080.
More From RTX 3080
More From RTX 2080:
Thank you! Please share your positive feedback. 🔋
How could we improve this post? Please Help us. 😔
[Comparisons Expert]
Shehryar Khan, a seasoned PC hardware expert, brings over five years of extensive experience and a deep passion for the world of technology. With a love for building PCs and a genuine enthusiasm for exploring the latest advancements in components, his expertise shines through his work and dedication towards this field. Currently, Shehryar is rocking a custom loop setup for his built.
Get In Touch: shehryar@tech4gamers.com


