AMD Ryzen 7 9800X3D Rated: 9.3/10 Intel Core i9-14900K Rated: 9/10
Pros And Cons
| CPU | Pros | Cons |
|---|---|---|
| AMD Ryzen 7 9800X3D | ✅ Offers 96MB of L3 Cache ✅ Improved thermal performance | ❌ High power consumption |
| Core i9-14900K | ✅ Enhanced single and multi-core performance ✅ Up to 6 GHz clock speed | ❌ Struggles with thermal efficiency |
Comparison Table
| Feature | Core i9-14900K | AMD Ryzen 7 9800X3D |
|---|---|---|
| No. of Cores | Total: 24 P-Cores: 8 E-Cores: 16 | Total: 8 |
| No. of Threads | 32 | 16 |
| Base Clock | 3.2 GHz | 4.7 GHz |
| Boost Clock | up to 6 GHz | Max Turbo: Up to 5.2GHz |
| Integrated Graphics | UHD Graphics 770 | AMD Radeon Graphics |
| Best Motherboard | Best Motherboards For i9-14900K | Best Motherboard For Ryzen 7 9800X3D |
| Best RAM | Best RAM For i9-14900K | Best RAM For Ryzen 7 9800X3D |
| Best Cooler | Best CPU Coolers For i9-14900K | Best CPU Cooler For Ryzen 7 9800X3D |
| Processor Review | AMD Ryzen 7 9800X3D |
Architectural Differences
- Core Count: The 9800X3D from Ryzen comes with 8 cores and 16 threads which provide decent performance in productivity, but the 14900K takes off the charts with its 24 cores and 32 threads.
- Clock Speed: When it comes to clock speeds, the 9800X3D takes the lead with a base clock of 4.7GHz compared to 3.2GHz. On the other hand, the 14900K provides a better boost clock of up to 6GHz in comparison to 5.2GHz.
- Cache: Once again, the Ryzen 9800X3D takes the lead by offering 96MB of shared L3 Cache as compared to its counterpart which is equipped with 36MB of shared L3 cache.
- Process Node: Going over the process nodes, the 9800X3D is equipped with a 4nm node while the 14900K hosts a 10nm process node.
- TDP: Although both chips offer a similar TDP rating, the 14900K takes a slight lead with 125W while the 9800X3D comes with a rating of 120W.
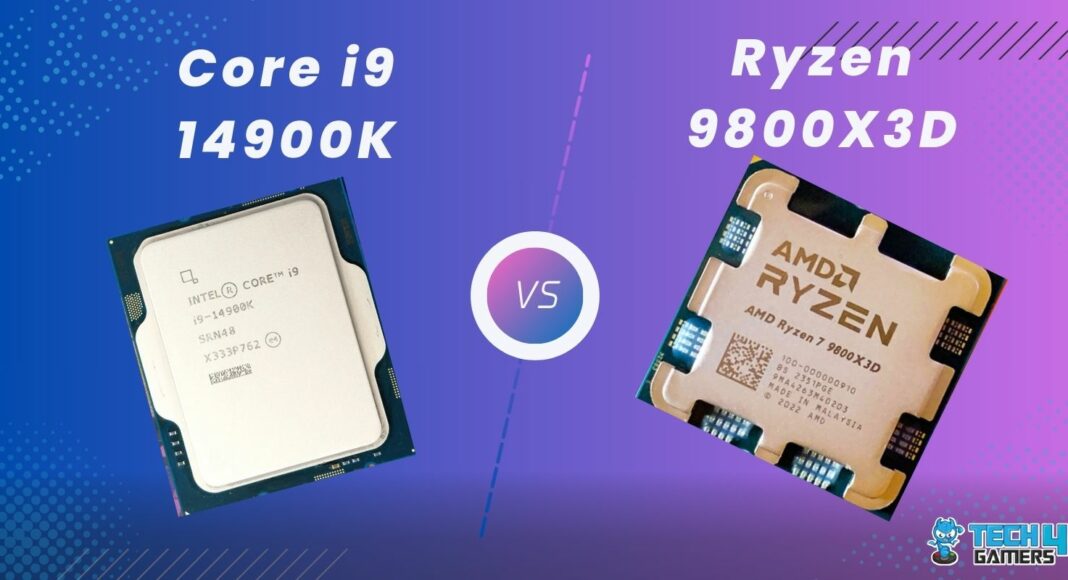
After the recent launch of the X3D chips from AMD, many users have started to speculate how well it performs against the big names of Intel’s last generation. This article will focus on that aspect and I will be testing the Ryzen 7 9800X3D vs i9-14900K in both gaming and productivity benchmarking.
Gaming Benchmarks – 1080p
Now to get things started, let’s start with the gaming benchmarking, to draw a fair conclusion I have pitted the processors against each other in several games to ensure precision and accuracy. Here is the testing rig that will be used for these benchmarks.
Test Bench
- OS – Windows 11
- CPU Cooler – Enermax LiqMaxFlo 360mm
- Graphics Card – GIGABYTE RTX 4090 Gaming OC 24G
- SSD – XPG Gammix S50 Lite
- Power Supply – be quiet! Dark Power Pro 13 1300W
- Mobo (AMD) – ASRock X870E Taichi Lite
- Mobo (Intel) – MSI MPG Z890 Edge Ti WiFi Review
Player Unknown Battleground

- Starting with PUBG, the Ryzen 7 9800X3D impressed me with an average of 500 FPS, outshining the Core i9-14900K, which averaged 339 FPS. That’s about a 38% difference in favor of Ryzen, making the gameplay feel a lot smoother.
- The Ryzen handled the 1% lows better too, staying at 366 FPS compared to Core i9’s 241 FPS. This 41% gap meant fewer frame drops, which made a noticeable difference in those intense firefights.
League of Legends

- While testing League of Legends, I saw Ryzen pulling off a strong 396 FPS, whereas the Core i9 lagged behind slightly at 321 FPS. The 20.9% difference was noticeable, especially in high-action moments.
- In terms of 1% lows, Ryzen held steady at 285 FPS, compared to Core i9’s 229 FPS. This 21.7% difference meant Ryzen felt more consistent during team fights, where every frame counts.
Overwatch 2

- Overwatch 2 was interesting because both CPUs performed closely. Ryzen averaged 539 FPS, with Core i9 close behind at 519 FPS, just about a 3.7% lead for Ryzen.
- When it came to 1% lows, though, Ryzen still felt smoother, managing 488 FPS while Core i9 hit 436 FPS. The extra 11.2% lead in lows made the gameplay feel just a bit more stable during hectic battles.
Lost Ark

- In Lost Ark, Ryzen took a strong lead, averaging 405 FPS, while the Core i9 only managed 274 FPS. The 38.5% difference really showed up in crowded areas, making Ryzen feel significantly smoother.
- For 1% lows, Ryzen held its ground at 220 FPS compared to Core i9’s 165 FPS, giving me around 28.5% more stability during busy scenes with lots of enemies on screen.
Dota 2

- Dota 2 ran beautifully on Ryzen, hitting an average of 404 FPS, much higher than Core i9’s 234 FPS. The 53.2% difference was evident, especially during big team fights where I noticed Ryzen handling the action more fluidly.
- Moreover, for the 1% lows, Ryzen stayed at 162 FPS, while Core i9 dropped to 120 FPS. This 29.7% gap in lows made Ryzen feel more reliable in high-pressure situations, keeping the frame drops to a minimum.
Cyberpunk 2077

- While testing Cyberpunk 2077, Ryzen reached 227 FPS on average, which was a decent step up from the Core i9’s 167 FPS. This 30.4% difference added a noticeable improvement to the overall experience.
- In terms of 1% lows, Ryzen performed well at 185 FPS, while Core i9 fell to 147 FPS. That extra 22.8% on Ryzen helped it feel more stable in busy city scenes and high-action moments.
Black Myth: Wukong

- Black Myth: Wukong was really close between the two processors. Ryzen averaged 84 FPS, just a slight edge over Core i9’s 83 FPS, which made them feel almost identical in terms of performance.
- However, for 1% lows, Ryzen had a small advantage with 78 FPS compared to Core i9’s 71 FPS. This 9.3% difference wasn’t huge, but it did add a little extra smoothness when things got intense.
Productivity Benchmarks
Since the gaming benchmarks have been covered and we can pretty much see a clear winner, let’s switch the stage and check how well they perform when it comes to productivity benchmarking.
Cinebench R24

- When I was testing single-core performance in Cinebench R24, the Core i9-14900K had a slight edge, scoring 140 compared to Ryzen’s 133. The 5.1% difference gives a minor lead in single-core tasks, but it’s not a massive gap.
- During multi-core tests, the Core i9-14900K took a substantial lead with a score of 2179, while Ryzen 7 9800X3D scored 1318. This 49.2% difference highlights the Core i9’s advantage in heavy workloads.
Geekbench 6

- In Geekbench 6’s single-core test, both CPUs performed almost identically, with Ryzen scoring at 3307 and Core i9 at 3291 only a tiny 0.4% difference. In practical terms, this means they’re almost indistinguishable in single-core tasks.
- For multi-core performance, the Core i9-14900K took a noticeable lead, scoring 23053 compared to Ryzen’s 18223. That 23.4% difference makes Core i9 the stronger choice for multi-threaded tasks.
iGPU – FP32 Performance

- While testing FP32 performance, the Core i9’s integrated GPU performed much better, scoring 846 versus Ryzen’s 565. This 39.8% difference means that the Core i9’s iGPU could be handy for applications using iGPU performance.
Overall Performance
Average Framerate
The Ryzen 7 9800X3D performs exceptionally well when it comes to gaming performance and takes a major lead of 27.5% over the Core i9-14900K which makes it really tempting for any users looking to upgrade and improve their gaming experience.
1% Lows
After getting a detailed analysis of the 1% lows of both processors, it can be safely said that the Ryzen 7 9800X3D provides a more stable gaming experience as there is a major 23.4% difference when compared to the Core i9-14900K.
Productivity
On the contrary to the gaming performance, the Core i9-14900K finally takes the lead when compared against the Ryzen 7 9800X3D in the productivity benchmarks which comes as no surprise as the chip hosts more cores and threads.
Thermal Efficiency
| Game | Core i9-14900K (°C) | Ryzen 9 9800X3D (°C) |
|---|---|---|
| Player Unknown Battleground | 71 | 56 |
| League of Legends | 66 | 48 |
| Overwatch 2 | 71 | 53 |
| Lost Ark | 78 | 53 |
| Dota 2 | 66 | 51 |
| Cyberpunk 2077 (Next Gen) | 67 | 57 |
| Black Myth : Wukong | 56 | 46 |
| Average Thermal Statistics | 67.8🌡️ | 52🌡️ |
| Winner: AMD Ryzen 9 9800X3D | ||
Due to the utilization of the new chipset technology, the Ryzen 7 9800X3D can provide great results while generating as little heat as possible. During our testing, this fact checked out as the chip was 26.4% more thermally efficient compared to Core i9-14900K.
Price
| CPU | Core i9-14900K | Ryzen 7 9800X3D | Price Difference |
|---|---|---|---|
| Launch MSRP | 💲589 | 💲479 | 20.5% |
| Current Price | 💲438 | 💲479 | 8.9% |
Although the Core i9-14900K was more expensive at its launch, it is currently being sold at a cheaper price when compared to the new 9800X3D chip. Furthermore, since the latter is still new, users might face shortage issues when trying to acquire it.
What I Recommend
Core i9-14900K: Although the Core i9 struggles in gaming performance, it makes up for it when it comes to productivity tasks. Moreover, since the chip is equipped with 24 cores and 32 threads, it is bound to save you a lot of time if you are using it in content creation.
AMD Ryzen 7 9800X3D: Being the cream of the 9000 lineup, the X3D chips never fail to deliver, similar to how they have performed before the 9800X3D also offers remarkable gaming performance while also offering decent efficiency in productivity tasks.
To sum it all up, both the processors have their ups and downs, while the Core i9 is unparalleled when it comes to content creation, the 9800X3D doesn’t fall far behind while offering a major boost in gaming performance so the decision to get either of these chips rests on your priorities.
The Core i9-14900K performs better in tasks like video editing and rendering due to its superior multi-core performance. The Ryzen 7 9800X3D supports AM5 with DDR5 and PCIe 5.0. The Core i9-14900K works with LGA 1700 and supports both DDR4 and DDR5. The Ryzen 7 9800X3D on AM5 has a future-proof upgrade path. The Core i9-14900K on LGA 1700 may have limited future upgrade options. The Core i9-14900K generally has better overclocking headroom than the Ryzen 7 9800X3D, allowing enthusiasts to push its performance further with adequate cooling. The Core i9-14900K has a more powerful integrated GPU compared to the Ryzen 7 9800X3D, making it a better choice for users without a dedicated GPU. FAQs
More From Ryzen 7 9800X3D More From Core i9-14900K
Thank you! Please share your positive feedback. 🔋
How could we improve this post? Please Help us. 😔
[Comparisons Expert]
Shehryar Khan, a seasoned PC hardware expert, brings over three years of extensive experience and a deep passion for the world of technology. With a love for building PCs and a genuine enthusiasm for exploring the latest advancements in components, his expertise shines through his work and dedication towards this field. Currently, Shehryar is rocking a custom loop setup for his built.
Get In Touch: shehryar@tech4gamers.com


