


Nvidia GeForce RTX 5090 Rated: 8.4/10 AMD Radeon RX 7900 XT Rated: 8.6/10
Pros And Cons
| GPU | Pros | Cons |
|---|---|---|
| RTX 5090 | ✅ Better at handling AI workloads ✅ DLSS 4 with improved frame generation | ❌ Very high power consumption |
| RX 7900 XT | ✅ Larger VRAM than most cards ✅ Excellent 1440p card | ❌ Lower rendering performance |
- From our calculations, the RTX 5090 is 66.5% better in 4K gaming and 40% better in terms of productivity when compared to the AMD’s RX 7900 XT.
- With its high performance, the RTX 5090 is also a very power-hungry card. This makes the RX 7900 XT 59% more power efficient than the RTX 5090.
- Currently, the RTX 5090 is being sold for its MSRP, so the RX 7900 XT is $1,080 cheaper than that. Moreover, this gap will increase even more as the RTX 5090’s price will reach sky-high as it does for all of Nvidia’s flagships.
- We recommend you get the RX 7900 XT because not only is it an excellent 1440p card with great productivity performance, but it is also reasonably priced. However, if you have a larger budget, go for the RTX 5090.
Comparison Table
| Features | RTX 5090 | RX 7900 XT |
|---|---|---|
| Slot Width | Dual-slot | Dual-slot |
| Release Date | Jan 30th, 2025 | Nov 3rd, 2022 |
| Power Connectors | 1x 16-pin | 2x 8-pin |
| Shader Cores (CUDA) | 21760 | 5376 |
| TMUs | 680 | 336 |
| ROPs | 176 | 192 |
| Tensor Cores | 680 | N/A |
| RT Cores | 170 | 84 |
| Suggested PSU | 950W | 700W |
| Best Variants | - | Best RX 7900 XT |
| Best CPU | - | Best CPUs For RX 7900 XT |
Architectural Difference
- Process Nodes: Even though the RX 7900 XT is two years older than the RTX 5090, it still shares the same process node that the RTX 5090 uses: 5nm.
- Clock Speeds: The RTX 5090 comes with a clock speed of 2017 MHz, which can be ramped up to 2407 MHz. In contrast, the RX 7900 XT has a base clock of 1387 MHz, which speeds up to 2394 MHz, almost similar to the RTX 5090’s.
- VRAM: The RTX 5090 arrives with its 32 GB GDDR7 VRAM with a wider bus width of 512-bit. On the other hand, the RX 7900 XT is also great with its 20 GB GDDR6 VRAM and a 320-bit bus width.
- TDP: With a TDP of 300W, the RX 7900 XT proves to be an efficient card. In contrast, the RTX 5090 is infamous for its high power consumption because of its 575W TDP.
- Supported Technologies: The RTX 5090 supports DLSS 4, which is better than the RX 7900 XT’s FSR 3. This is because it uses AI-based tensor cores that improve frame generation and help in image upscaling as well.
The RTX 5090 is Nvidia’s new powerhouse graphics card, and we decided to test it out with one of AMD’s cards. In this RTX 5090 vs RX 7900 XT comparison, we’ll explain the comparison in great detail so you have all the necessary information regarding these two cards.
Gaming Benchmark – 4K
The specifications already set a narrative for each card, but it wouldn’t be fair not to focus on practicality. So, here is the performance of these GPUs in eight games played at 4K, so you get a clear picture of how these two graphic cards perform in the real world.
Recommended Test Bench
- CPU – AMD Ryzen 7 9800X3D
- Mobo – MSI MPG X870E Carbon WiFi
- RAM – G. Skill Trident Z5 Neo RGB DDR5-6400 CL30
- CPU Cooler – Xigmatek Aurora 360mm Cooler
- Storage – XPG GAMMIX S70 BLADE 2TB NVMe SSD
- Power Supply – MSI MAG A1000GL ATX 3.1 80+ Gold
- Operating System – Windows 11
S.T.A.L.K.E.R. 2: Heart of Chornobyl
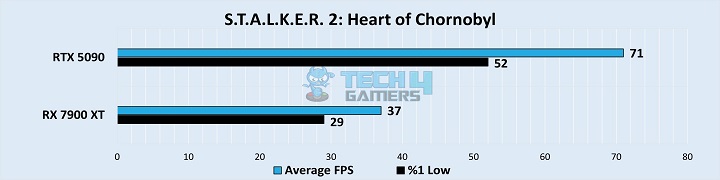
- In this game, the RTX 5090 displayed better performance, 63% to be specific, because it obtained an average of 71 FPS, which was way higher than the RX 7900 XT’s 37 FPS.
- In terms of the 1% lows, the RTX 5090 was ahead with an average of 52 FPS. In contrast, the RX 7900 XT acquired an average of 29 FPS, and it was 56.8% behind comparatively.
God Of War Ragnarok
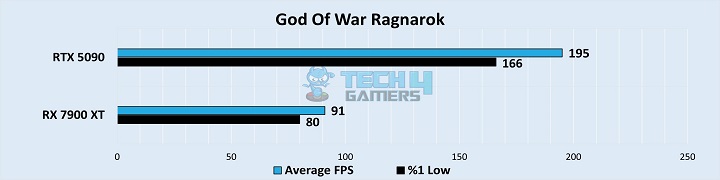
- On God Of War, we saw the RTX 5090 performed 72.7% better than the RX 7900 XT because it averaged 195 FPS. The RX 7900 XT, on the other hand, achieved an average of 91 FPS.
- As for the 1% lows, the RTX 5090 displayed quite a smoother experience with its 166 FPS, being 69.9% better, to be specific. Alternatively, the RX 7900 XT had framerates reaching 80 FPS, on average.
Warhammer 40K: Space Marine 2
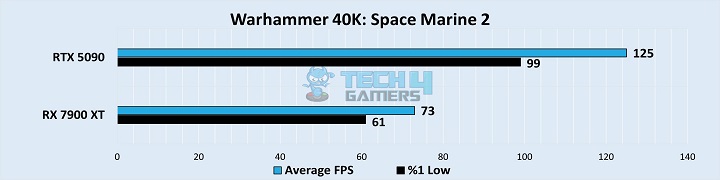
- On Space Marine 2, the RTX 5090 came out to the top with its 125 FPS. On the contrary, the RX 7900 XT was 52.5% behind, with an average of 73 FPS in this game.
- For the 1% lows, there was a 47.5% difference between these two cards because the RTX 5090 and the RX 7900 XT obtained an average of 99 FPS and 61 FPS, respectively.
A Plague Tale Requiem
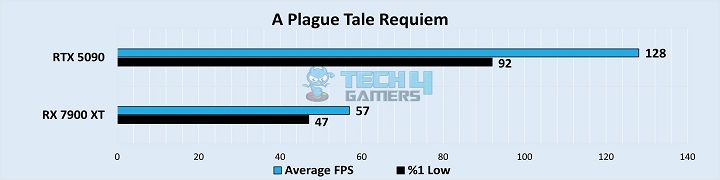
- With maxed-out settings, we saw the RTX 5090 shine with an average of 128 FPS. This equates to a 76.8% difference because the RX 7900 XT was quite behind with an average of 57 FPS.
- Here, the RTX 5090 came out to the top with a 64.7% lead because it obtained an average of 92 FPS. In contrast, the RX 7900 XT had minimum values dipping to 47 FPS, on average.
Star Wars Outlaws
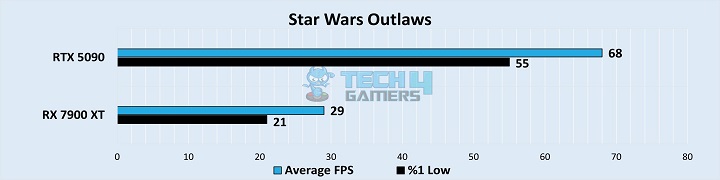
- In this demanding game, we observed the RTX 5090 averaged 68 FPS. Whereas the RX 7900 XT performed with an average of 29 FPS, making for a whopping 80.4% margin which is the highest we recorded in this article.
- Similarly, we also recorded the highest difference in terms of the 1% low on this game because they reached 89.5%, with the RTX 5090 leading with an average of 55 FPS over the RX 7900 XT’s 21 FPS.
Starfield
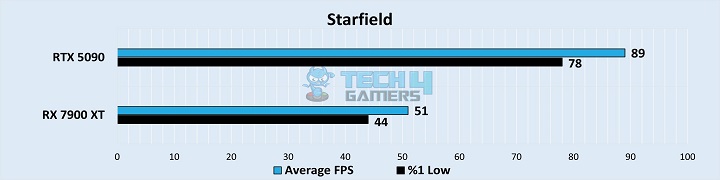
- On Starfield, the margin dropped to the all-time low for this comparison, being 54.3% won by the RTX 5090, which averaged 89 FPS. At the same time, the RX 7900 XT acquired an average of 51 FPS.
- As far as the 1% lows are concerned, the RTX 5090 provided a 55.7% smoother experience than the RX 7900 XT, as both of these cards averaged 78 FPS and 44 FPS, respectively.
Cyberpunk 2077
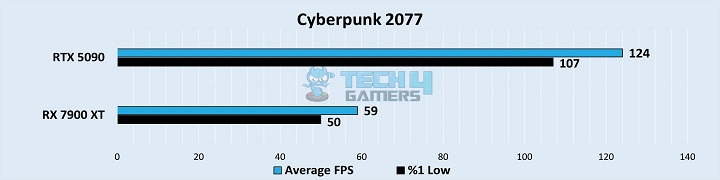
- Without any ray tracing, the RTX 5090 led with 71% as it obtained an average of 124 FPS on Cyberpunk 2077. Simultaneously, the RX 7900 XT barely reached the 60 FPS mark because it averaged 59 FPS.
- Even during the most demanding moments, the RTX 5090 performed with a minimum of 107 FPS. This was 72.6% higher than the RX 7900 XT’s 1% low framerates because it averaged 50 FPS.
Dragon Age: The Veilguard
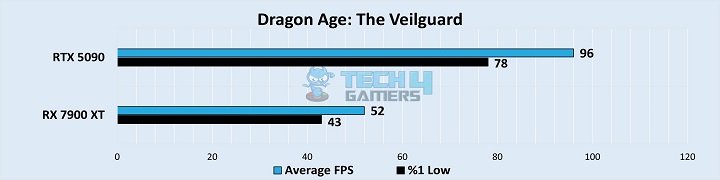
- Lastly, we saw the RTX 5090 excel with an average of 96 FPS on the new Dragon Age game. Meanwhile, the RX 7900 XT acquired an average of 52 FPS, which makes for a 59.5% performance difference.
- Frame dips were much controlled on the RTX 5090 because it averaged 78 FPS which was 57.9% better when compared to the RX 7900 XT’s average 1% low of 43 FPS.
Productivity Benchmarks
Since not everyone aims to use a graphics card for gaming only, some people use it for productivity purposes as well. This is why we have decided to provide you with their productivity performance so you can see which card is more efficient.
Adobe Premiere Pro
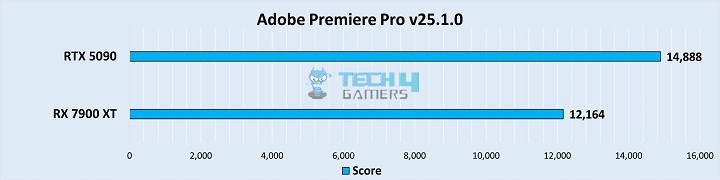
- On Adobe Premiere Pro, the RTX 5090 took the lead with 14,888 points. This was a 20.1% performance margin when compared to the RX 7900 XT, which also obtained a fairly decent score of 12,164 points.
Blender (Barbershop)
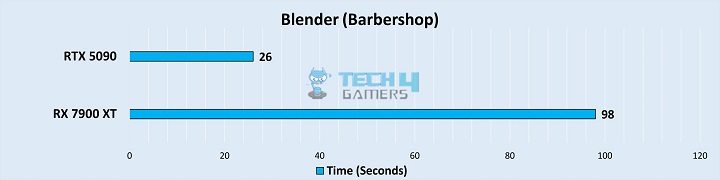
- While rendering on Blender, the RTX 5090 was 26.5% faster because it finished the operation in only 26 seconds. Compare this with RX 7900 XT’s performance; we saw it took 1 minute 38 seconds to complete the render.
UL Procyon (AI Image Generation)
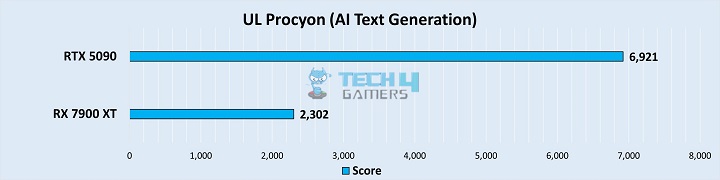
- While generating AI text, the RTX 5090 outshined the RX 7900 XT because it obtained a score of 6,921 points. In contrast, the RX 7900 XT was 100.2% behind because it with its 2,302 points.
Overall Performance
| Graphic Cards | RTX 5090 | RX 7900 XT |
|---|---|---|
| Average FPS | 📈112 | 📈56.1 |
| 1% Lows | 📉90.9 | 📉46.9 |
| Productivity (Rating) | ✏️7/10 | ✏️4.7/10 |
| Winner: GeForce RTX 5090 | ||
Average Framerate
We went ahead and calculated the averages obtained from the eight tested games, and we saw that the RTX 5090 was the victor. Compared to the RX 7900 XT, the RTX 5090 performed 66.5% on average in terms of 4K gaming. The RX 7900 XT is better at 1440p, so the way it performed at 4K is understandable.
1% Lows:
As for the performance regarding the 1% lows, we saw almost the same story. According to our calculations, the RTX 5090 had smoother dips, 63.9% more smoother than the RX 7900 XT. However, the RX 7900 XT’s 1% low performance was fairly good when we compared it to its average framerates.
Productivity:
In terms of productivity, the result was also clear-cut. We saw that, on average, the RTX 5090 performed around 40% better than the RX 7900 XT, especially in the area where rendering and AI tasks are involved. For video editing, the RX 7900 XT performed excellently as well.
Average Power Consumption
| Power Consumption | RTX 5090 | RX 7900 XT |
|---|---|---|
| Idle | 31⚡ | 11⚡ |
| Gaming | 588⚡ | 320⚡ |
| Ray Tracing | 562⚡ | 321⚡ |
| Maximum | 602⚡ | 320⚡ |
| Winner: RX 7900 XT | ||
Since the RTX 5090 is known to be a power-hungry graphics card due to its atrociously higher TDP, it also proved to consume the most amount of power comparatively. To put into perspective, the RX 7900 XT is 59% more power-efficient than the RTX 5090.
Pricing And Availability
| GPU | RTX 5090 | RX 7900 XT | Price Difference |
|---|---|---|---|
| Launch MSRP | 💲1999 | 💲899 | 75.9% |
| Current Price | 💲1999 | 💲919 | 74% |
For now, the RX 7900 XT is around 74% cheaper than the RTX 5090, and it is far more widely available in online stores. In terms of the RTX 5090’s current price, it is still being sold for its MSRP. However, this is going to change, and it’s not going to change for the better because its price is going to increase significantly.
Final Verdict—What We Recommend?
RX 7900 XT: This is more of a 1440p card because it barely reached the 60 FPS mark in games played at 4K. However, you can easily use it for 4K as well by lowering the settings of the game. Apart from gaming, it is also excellent in terms of video editing. However, it lacks performance in rendering and in AI-based workloads.
RTX 5090: On the contrary, this card is in a league of its own. It surpassed each section with flying colors if we disregard its insanely high power consumption. Moreover, the price of Nvidia’s flagships always reaches sky-high, and this is going to be the case for this card as well. But would its upcoming high price be justified?
Regardless, we suggest you get the RX 7900 XT if you want a 1440p card that not only provides a great gaming experience but also is a great choice for productivity. And if you want to rig your setup with the best GPU and you have no issues with the budget, go for the RTX 5090 by all means.
Since the RX 7900 XT lacks AI acceleration, the RTX 5090 is better in terms of future-proofing because the use of AI will become more important within a few years. Since the RTX 5090 uses Nvidia’s driver, it can be problematic for Linux. The RX 7900 XT has better open-source Linux drivers like Mesa and ROCm. The RTX 5090 is a better choice for AI workloads because of its use of AI-based technology and CUDA-based AI applications. No, the RX 7900 XT doesn’t have any CUDA cores because they are only supported by Nvidia cards. AMD uses OpenCL and ROCm instead. The RX 7900 XT’s FSR 3 isn’t hardware accelerated like DLSS 4, which makes RTX 5090 better in terms of frame generation. FAQs
More From GeForce RTX 5090 More From RX 7900 XT
Thank you! Please share your positive feedback. 🔋
How could we improve this post? Please Help us. 😔
[Comparisons Expert]
Shehryar Khan, a seasoned PC hardware expert, brings over five years of extensive experience and a deep passion for the world of technology. With a love for building PCs and a genuine enthusiasm for exploring the latest advancements in components, his expertise shines through his work and dedication towards this field. Currently, Shehryar is rocking a custom loop setup for his built.
Get In Touch: shehryar@tech4gamers.com


