

AMD Radeon RX 7900 XT
Rated: 8.5/10
Nvidia GeForce RTX 4080 Super
Rated: 8/10
Pros And Cons
| Graphics Card | Pros | Cons |
|---|---|---|
| RTX 4080 Super | ✅ Better Overall Performance ✅ Better power efficiency | ❌Higher Price |
| RX 7900 XT | ✅ Larger VRAM buffer ✅Larger VRAM bandwidth | ❌Bad power efficiency |
- In our testing, the RTX 4080 Super had an overall performance around 15% higher than the RX 7900 XT, with particular advantages in RT gaming.
- Despite being significantly more powerful, the RTX 4080 Super also managed to consume 26% less power than the RX 7900 XT, making the power budget much more manageable.
- The the time of writing this article, the RX 7900 XT is around 27.5% cheaper than the RTX 4080 Super, making it a much better value.
- If you want to get a top-tier card while saving a buck, the RX 7900 XT gives you the option of rounding some corners, whereas the RTX 4080 Super asks for a higher price while also not slacking in any department.
Comparison Table
| Feature | GeForce RTX 4080 Super | Radeon RX 7900 XT | ||
|---|---|---|---|---|
| Architecture | Ada Lovelace | RDNA 3.0 | ||
| Design Chip | AD103-400-A1 | Navi 31 XT (215-145000156) | ||
| Product Family | Nvidia GeForce RTX 40 series | Navi III | ||
| Steam Processors/Cuda Cores | 10240 | 5376 | ||
| Compute Units/Tensor Cores | 320 | - | ||
| Ray Accelerators | 80 | 84 | ||
| ROPs | 112 | 192 | ||
| Memory Bandwidth | 736.3 GB/s | 800.0 GB/s | ||
| Best Variants | Best RTX 4080 Super Graphics Cards | Best RX 7900 XT Graphics Cards |
Architectural Differences
- Clock Speed: The RTX 4080 Super surpasses the RX 7900 XT with higher base and boost clocks, operating at 2295MHz (base) and up to 2550MHz (boost) compared to AMD’s 1500MHz (base) and 2394MHz (boost).
- VRAM: The RX 7900 XT wins in terms of VRAM, with 20GB of GDDR6 memory carried over a 320-bit bus. The RTX 4080 Super, however, has a memory buffer of 16GB using GDDR6X memory over a 256-bit bus.
- TDP: The RTX 4080 has a slightly higher TDP of 320 watts compared to the 7900 XT’s TDP of 300 watts.
- Process Node: Both graphics cards use the 5nm processing nodes from TSMC.
- Other Technologies: The RTX 4080 Super boasts various gaming-enhancing technologies, while the RX 7900 XT, utilizing free-to-use software, closely matches it in most aspects. However, Nvidia’s solutions tend to be more polished than AMD’s.
The price of the RX 7900 XT has been falling since the time of its release, making it an excellent value for for high-end gamers. Nvidia has stopped lacking, too, with the RTX 4080 Super getting a larger price cut than its predecessor. How do these cards do against one another? Keep reading our RTX 4080 Super vs RX 7900 XT review to find out!
Gaming Tests – 1440p
Being the same tier of the card in both companies’ GPU hierarchies, the comparison of the RTX 4080 Super vs RX 7900 XT boils down to the maximum framerate each company could supply in their respective price brackets. To test the performance of both GPUs, we have constructed a test bench with the specifications listed below:
Test Bench
- CPU: Ryzen 9 5900X
- Operating System: Windows 11
- Motherboard: MSI MEG X570 ACE
- RAM: Patriot Viper LED DDR4 2×16 GB 3600MHz
- SSD: Sabrent Rocket 4 Plus 1TB NVMe SSD
- Cooler: Xigmatek Aurora 360mm Cooler
- Power Supply: ENERMAX REVOLUTION D.F. X 1050W
Avatar: Frontiers Of Pandora
- With RT and quality upscaling enabled, the Nvidia card achieved a 21% higher average framerate of around 119 FPS, while the RX 7900 XT lagged behind at approximately 95 FPS.
- The 1% lows were around 27% lower on the RX 7900 XT, hovering around 61 FPS, while the RTX 4080 Super had lows of around 84 FPS.
Starfield
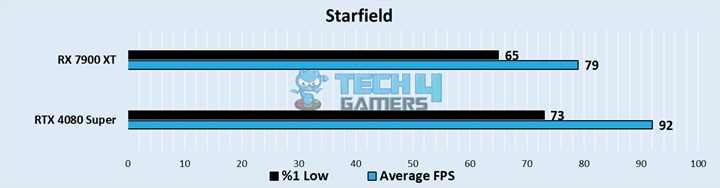
- With the Ultra settings running on the native resolution, the RX 7900 XT suffered a loss of 14% in this game, averaging a framerate of 79 FPS, while the RTX 4080 Super had an average framerate closer to around 92 FPS.
- The RTX 4080 Super was around 12% faster when we measured the 1% lows at a framerate of around 73 FPS, whereas the RX 7900 XT sat at lows of around 65 FPS.
Assassin’s Creed Mirage
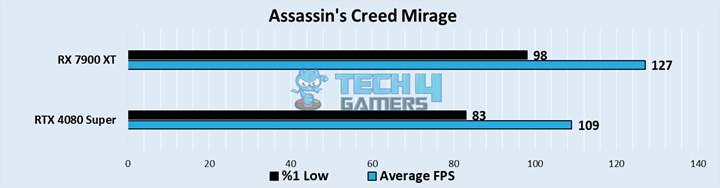
- Surprisingly, with RT off at native resolution in AC Mirage, the RX 7900 XT outpaced the RTX 4080 Super, achieving an average framerate of 127 FPS, while the Nvidia card lagged at around 109 FPS, marking a 16% difference.
- The 1% lows were also 18% faster on the RX 7900 XT at around 98 FPS versus the RTX 4080 Super’s lows of 83 FPS.
Baldur’s Gate 3
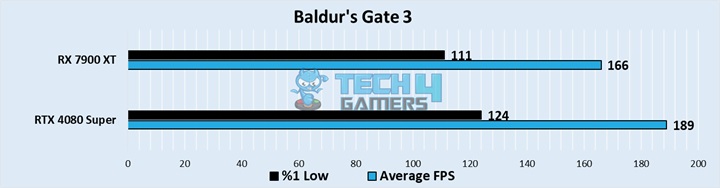
- The performance difference fell to the status quo in Baldurs Gate 3, with the RX 7900 XT getting an average framerate of 166 FPS, while the RTX 4080 Super was 12% ahead with an average framerate of 189 FPS.
- There was a difference of around 12% in the 1% lows of these GPUs as well, with the RTX 4080 Super getting lows of 124 FPS, whereas the RX 7900 XT had lows of 111 FPS.
Alan Wake 2
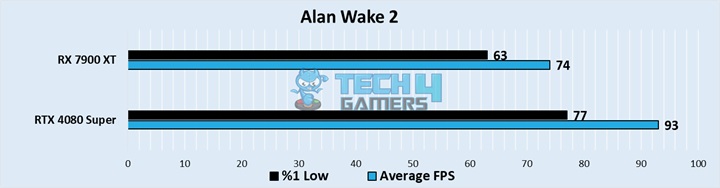
- The RTX 4080 Super had an average framerate of 93 FPS, which surpassed the 74 FPS average of the RX 7900 XT by around 20%. This test was done natively at 1440p, with RT off and the Ultra preset applied.
- The difference in performance rose to 22% when we examined the 1% lows, with the Nvidia card getting a framerate of around 77 FPS, whereas the RX 7900 XT had lows closer to 63 FPS.
Diablo 4
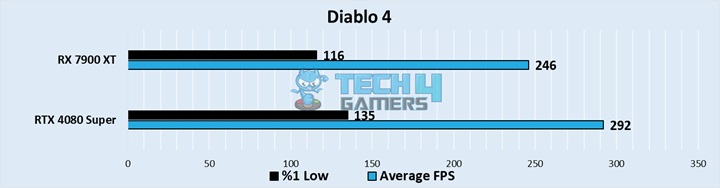
- Both systems ran Diablo 4 smoothly, but the RTX 4080 Super maintained a significant lead with an average framerate of 292 FPS, while the Radeon card lagged around 16% behind at approximately 246 FPS.
- The 1% lows maintained the 16% difference between the processors, with the RTX 4080 Super getting an average framerate of 135 FPS, whereas the RX 7900 XT had lows of around 116 FPS.
Forza Motorsport
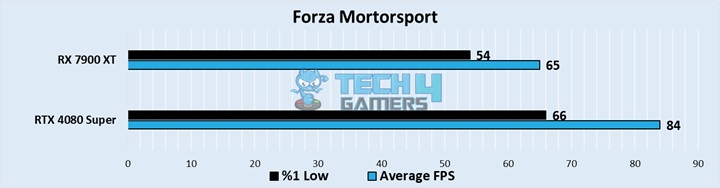
- Utilizing FSR/DLSS and RT in this title, testing revealed the RX 7900 XT to be approximately 23% slower than the RTX 4080 Super. The Radeon card averaged 65 FPS, while the RTX 4080 Super achieved a noticeably higher 84 FPS.
- The RTX 4080 Super maintained smooth 1% lows of 66 FPS in our testing, whereas the RX 7900 XT was around 23% slower, with 1% lows dancing around the 54 FPS mark.
Hogwarts Legacy
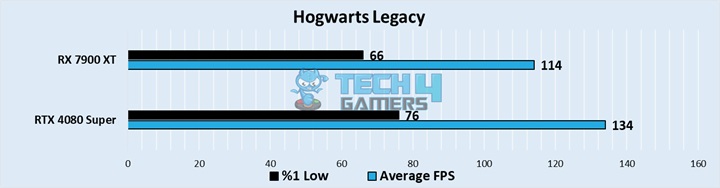
- Running this game at the Ultra preset, there was a difference of around 15% in this game, with the RTX 4080 Super being in the lead. It had an average framerate of 134 FPS, whereas its rival held closer to 114 FPS in our testing.
- With the RTX 4080 Super getting 1% lows of around 76 FPS while the RX 7900 XT had lows of close to 66 FPS, the difference in performance of around 15% was maintained in the minimum framerates of our game.
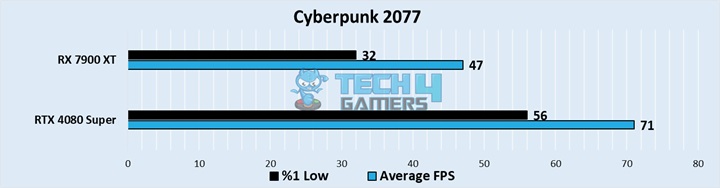
Cyberpunk 2077
PUBG
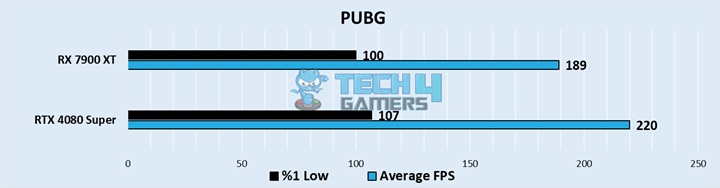
- Finally, our testing converged with PUBG running around 14% better on the RTX 4080 Super with an average framerate of 220 FPS, while the RX 7900 XT had an average framerate closer to around 189 FPS.
- The 1% lows were around 100 FPS on the Radeon card, whereas the Nvidia card managed to do slightly better with lows of around 107 FPS.
Overall Gaming Performance
| Featured | RTX 4080 Super | RX 7900 XT |
|---|---|---|
| Average FPS | 140 📈 | 120 📈 |
| %1 lows | 88 📉 | 77 📉 |
| Winner: Nvidia's RTX 4080 | ||
In our testing, the RTX 4080 Super demonstrated superior performance over the RX 7900 XT, averaging around a 15% lead. While a noticeable difference may not be immediate in 1440p gaming, the RTX 4080 Super excelled in most games, particularly leveraging its strength in RT scenarios.
Here is some of our recorded gameplay for these cards:

In our FP32 test, the RTX 4080 Super only performed 1% better than the RX 7900 XT, serving as a reminder that a card’s synthetic performance does not represent its gaming capabilities.
– Uzair Qureshi
Power Consumption
| Game | RTX 4080 Super (W) | RX 7900 XT (W) |
|---|---|---|
| Avatar Frontiers Of Pandora | 275 | 306 |
| Starfield | 245 | 309 |
| Assassin's Creed Mirage | 166 | 308 |
| Baldur's Gate 3 | 286 | 308 |
| Alan Wake 2 | 248 | 309 |
| Diablo 4 | 254 | 305 |
| Forza Motorsport | 228 | 309 |
| Hogwarts Legacy | 246 | 310 |
| Cyberpunk 2077 | 228 | 309 |
| PUBG | 278 | 308 |
| Average Power Consumption | 245.4 | 308.1 |
| Winner: Nvidia's RTX 4080 Super | ||
Despite having significantly more power, the RTX 4080 Super managed to get away with using around 26% less power in our testing when compared to the RX 7900 XT. This brings the rather large power budget of the Radeon card to a much more manageable amount, which can lead to some savings in the lifespan of these cards.
Price And Value
| Graphics Card | Launch MSRP | Current Price |
|---|---|---|
| RTX 4080 Super | 💲999 | 💲999 |
| RX 7900 XT | 💲899 | 💲724 |
| Difference | 10.01% | 27.53% |
Despite the performance improvement and the price cut that Nvidia has given to the RTX 4080 Super, it still stands as a worse value than the RX 7900 XT. The MSRP of the Radeon card has fallen significantly below its launch MSRP, which increases its value proposition further.
What We Recommend
RX 7900 XT: The RX 7900 XT has sustained its value since launch, offering commendable performance suitable for 1440p and even 4k gaming with some concessions on ray tracing and assistance from FSR. It’s an excellent choice for those seeking top-tier gaming without breaking the bank.
RTX 4080 Super: The RTX 4080 Super boasts high performance at a high price. It excels in all facets of modern gaming, including ray tracing. While the premium cost aligns with its top-notch capabilities, it’s a worthwhile investment if you prioritize cutting-edge features and exceptional gaming experiences.
Our discussion of the RTX 4080 Super vs RX 7900 XT concluded that the difference between the performance of these cards is just as important as the difference in price. The more well-rounded card also has a heftier price tag, whereas something like the RX 7900 XT has a few caveats, but it is still serviceable for high-end gaming.
FAQs
The RX 7900 XT and RTX 4080 Super both have a suggested PSU size of 700 watts.
The RX 7900 XT has 84 RT cores, whereas the RTX 4080 Super has 80 RT cores. The higher core count does not correlate with performance, as the cores on the RTX 4080 Super are substantially more advanced.
The RX 7900 XT uses a dual 8-pin connector, whereas the RTX 4080 Super uses a single 16-pin connector.
More From RX 7900 XT
Thank you! Please share your positive feedback. 🔋
How could we improve this post? Please Help us. 😔
[Comparisons Specialist]
I’m a passionate computer hardware expert specializing in CPUs and GPUs. With a lifelong curiosity for hardware and extensive hands-on experience, I provide valuable insights, practical advice, and in-depth analysis on these components. Engaging with the hardware community, I exchange knowledge and stay at the forefront of technological advancements.
Get In Touch: uzair@tech4gamers.com


Feedback By:
Avery
Riley
Morgan
Casey
Jordan
Taylor
Sam
Chris
Jamie
Alex