


GeForce RTX 2080
Rated: 8.6/10
GeForce RTX 4060
Rated: 8.8/10
Pros And Cons
| GPU | Pros | Cons |
|---|---|---|
| RTX 2080 | ✅ Excellent for 1440P / 1080P gaming. ✅ Exciting DLSS feature with vast potential. | ❌ Requires a big power supply. |
| RTX 4060 | ✅ Comes with an attractive price reduction. ✅ Provides stunning ray tracing capability. | ❌ Performance is weaker. |
- In our testing, the RTX 2080 slightly outperforms the RTX 4060 in average FPS across various benchmarks, with an average of 92.5 FPS compared to 89.3 FPS for the RTX 4060.
- While the RTX 4060’s average temperature reaches 73.4°C compared to the RTX 2080’s 71.8°C, both GPUs demonstrate competitive thermal performance.
- The RTX 4060 consumes 115.4W compared to the RTX 2080’s 213.5W, making it a more energy-efficient choice with a 59.6% advantage in power consumption.
- Priced around 849 USD, the RTX 2080 targets high-end users, while the RTX 4060 offers a more budget-friendly option for gamers with its lower price point.
Comparison Table
| Technical Specs | GeForce RTX 2080 | GeForce RTX 4060 |
|---|---|---|
| GPU Name | TU104 | AD106 |
| Architecture | Turing | Ada Lovelace |
| CUDA Cores | 2944 | 3840 |
| Tensor Cores | 368 | 120 |
| RT Cores | 46 | 30 |
| ROPs | 64 | 48 |
| Suggested PSU | 600W | 550W |
| Best Variants | BEST RTX 4060 |
Architectural Difference
- Process Node: Diving into GPU manufacturing, the RTX 2080 operates on a 12nm process size, whereas its competitor, the RTX 4060, gains a competitive edge with its advanced 5nm process size.
- Clock Speed: In the realm of clock speeds, the RTX 2080 falls short with a 1515 MHz base and 1710 MHz boost, while the RTX 4060 surges ahead with an impressive 1830 MHz base and a whopping 2535 MHz boost.
- VRAM: Notably, the RTX 4060 and RTX 2080 feature an impressive 8GB of GDDR6 VRAM, enabling seamless rendering of complex graphics.
- TDP: Additionally, the RTX 4060 excels in power efficiency with a lower TDP of 200W, providing an advantage over the RTX 2080, which consumes 215W.
- Supported Technologies: Finally, regarding gaming advancements, the RTX 4060 and RTX 2080 harness the power of DLSS (Deep Learning Super Sampling) technology, an innovation that improves the gaming experience.
Our focus will be on the RTX 4060 vs RTX 2080’s gaming performance and a comprehensive array of benchmarks to uncover just how far the RTX 4060 has evolved over two generations.
Gaming Performance Benchmarks
Now, we’ll see the strengths and weaknesses of the RTX 4060 and RTX 2080 through rigorous testing and real-world gaming scenarios, helping you decide which GPU best suits your gaming needs.
Testing Rig
- CPU: Intel Core i7 13700k
- Motherboard: MSI MEG Z790 ACE MAX Motherboard
- CPU Cooler: MSI MAG CORELIQUID C360
- Memory: G.SKILL Trident Z5 RGB 32GB DDR5 6000MHz
- SSD: XPG GAMMIX S70 BLADE 2TB NVMe SSD
- Power Supply: ENERMAX REVOLUTION D.F. X 1050W
- Operating System: Windows 11 Professional 64-Bit
Assassin’s Creed Valhalla
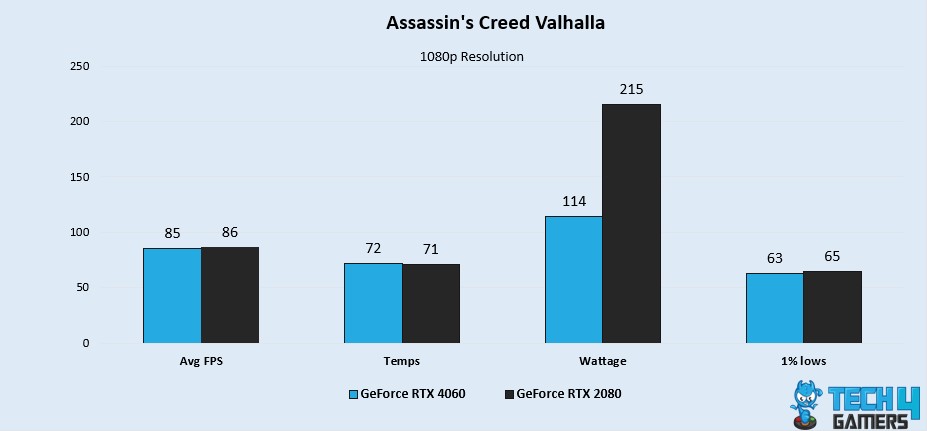
- While playing the game, the RTX 4060 and RTX 2080 show a minimal difference of 1.1% in average FPS performance, with the RTX 4060 achieving 85 FPS and the RTX 2080 achieving 86 FPS.
- Despite the RTX 4060’s 1% low performance of 63 FPS, which is 3.1% lower than the RTX 2080’s 65 FPS, it still showcases impressive gaming capabilities.
Control
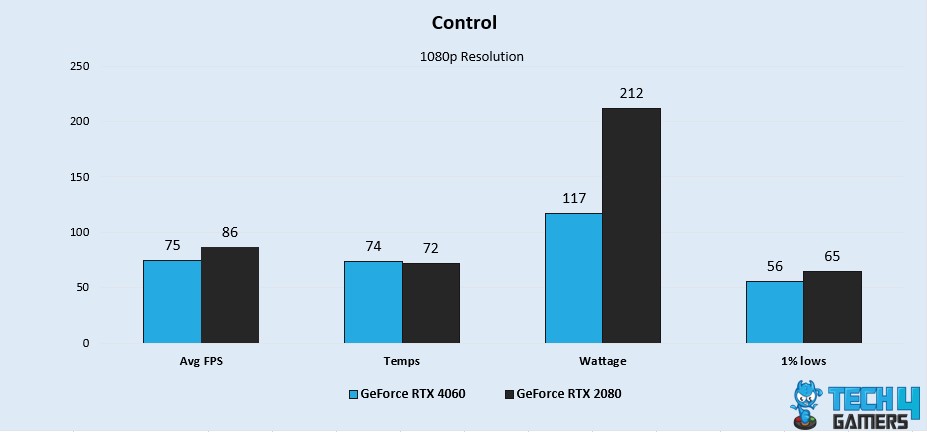
- There is a substantial performance gap, with the RTX 2080 outperforming the RTX 4060 by 13.6% in average FPS. The RTX 4060 achieves 75 FPS, while the RTX 2080 achieves 86 FPS.
- The RTX 4060 falls behind with a 1% low performance of 56 FPS, showing a significant 14.8% difference compared to the stable 65 FPS of the RTX 2080.
Cyberpunk 2077
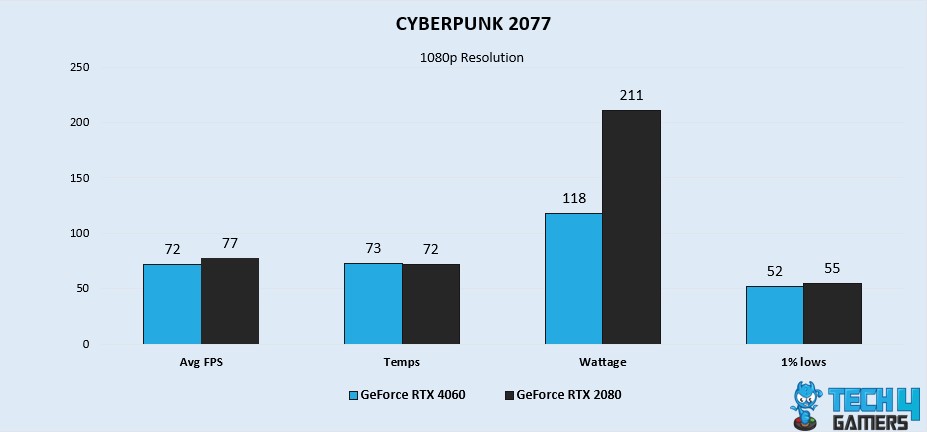
- While playing Cyberpunk 2077, the RTX 2080 delivers an impressive 6.7% lead over the RTX 4060 in average FPS performance. The RTX 4060 achieves 72 FPS, while the RTX 2080 achieves 77 FPS.
- Moreover, with a 1% low performance of 52 FPS, the RTX 4060 exhibits a modest 5.6% difference compared to the RTX 2080, which maintains a stable 55 FPS.
Hogwarts Legacy
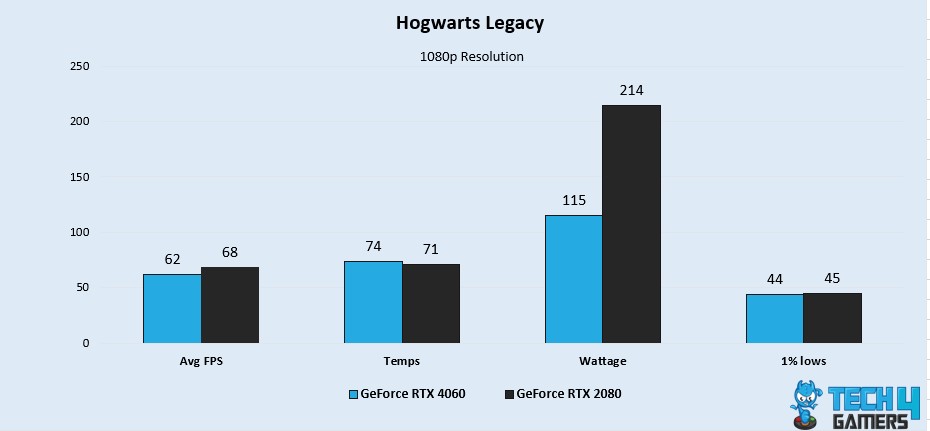
- In our first Hogwarts Legacy gameplay at 1080p, there is a noteworthy 9.2% difference in average FPS performance, with the RTX 2080 achieving 62 FPS and the RTX 4060 achieving 68 FPS.
- Despite its 1% low performance of 44 FPS, slightly lower by 2% than the RTX 2080’s 45 FPS, the RTX 4060 still delivers a smooth gaming experience.
Red Dead Redemption 2
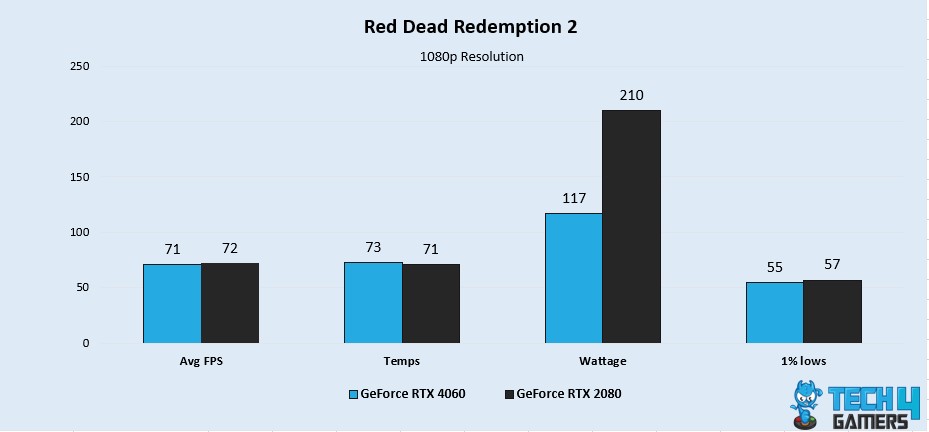
- In my RDR 2 gameplay, the RTX 4060 and RTX 2080 display a slight disparity of 1.3% in average FPS performance. The RTX 4060 achieves 71 FPS, and the RTX 2080 achieves 72 FPS.
- The RTX 4060 showcases a 1% low performance of 55 FPS, demonstrating a 3.5% difference from the RTX 2080’s 57 FPS while providing enjoyable gaming performance.
The Last Of Us Part I
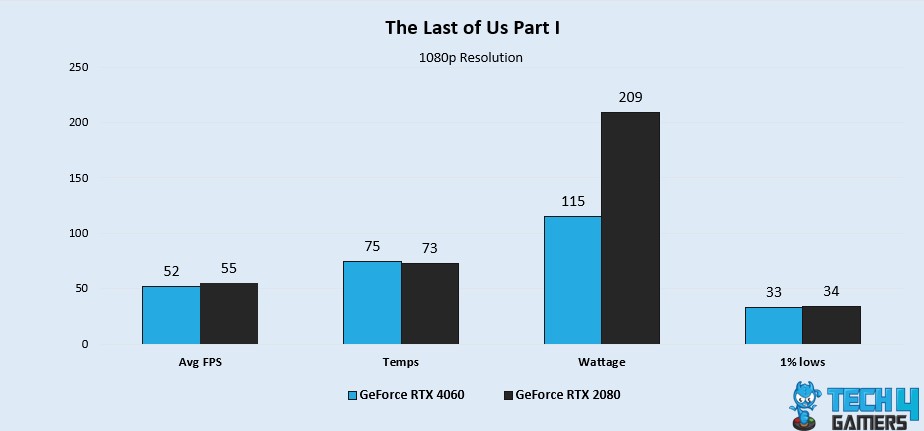
- In this gameplay, the RTX 4060 exhibits a 5.6% disadvantage over the RTX 2080 in average FPS performance, achieving 52 FPS compared to the RTX 2080’s 55 FPS.
- With a 1% low performance of 33 FPS, the RTX 4060 falls slightly behind by 2.9% compared to the RTX 2080’s 34 FPS but still offers decent gaming capabilities.
God Of War

- During my session of God of War, I noted a difference of 9% in average FPS performance, with the RTX 4060 achieving 74 FPS and the RTX 2080 achieving 81 FPS.
- Despite a 1% low performance of 59 FPS, 9.6% lower than the RTX 2080’s 65 FPS, the RTX 4060 delivers satisfactory gaming performance.
F1 22
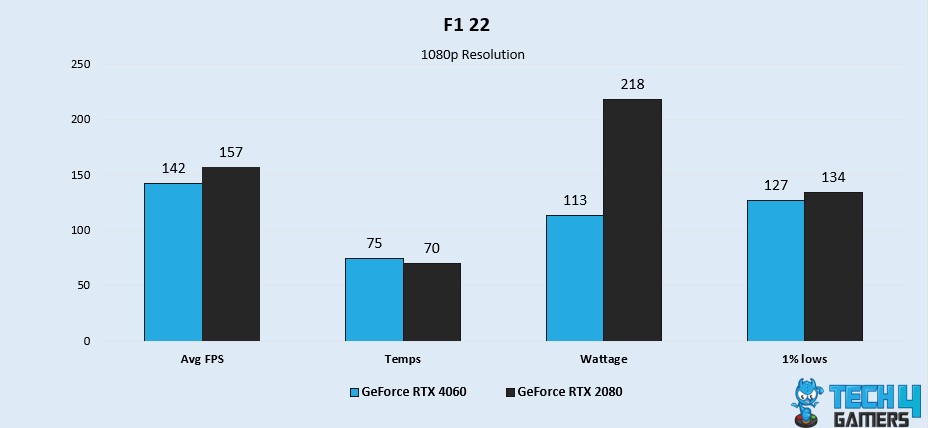
- The RTX 2080 displays a remarkable 10% lead over the RTX 4060 in average FPS performance. The RTX 4060 achieves 142 FPS, while the RTX 2080 achieves 157 FPS.
- The RTX 4060 demonstrates a 1% low performance of 127 FPS, showing a minor 5.3% difference compared to the RTX 2080’s 134 FPS, ensuring smooth gameplay.
Far Cry 6
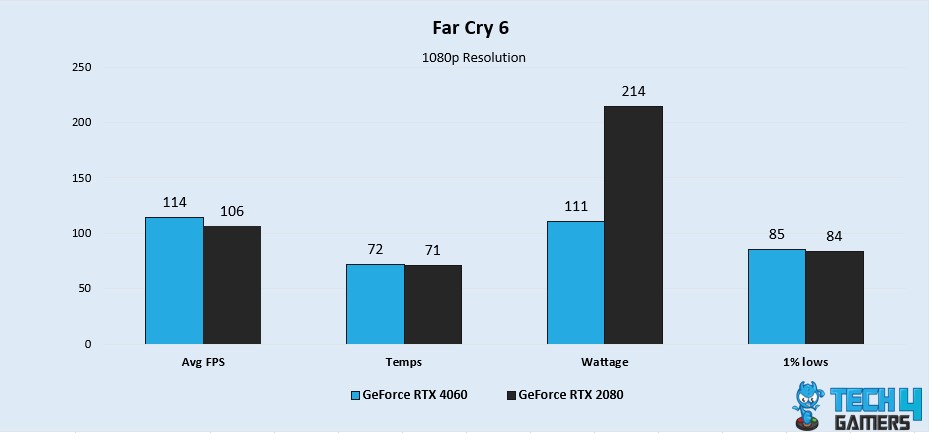
- When playing Far Cry 6, the RTX 4060 exhibits a commendable 7.2% lead over the RTX 2080 in average FPS performance. The RTX 4060 achieves 114 FPS, while the RTX 2080 achieves 106 FPS.
- With a 1% low performance of 85 FPS, the RTX 4060 showcases a minimal 1.1% difference compared to the RTX 2080’s 84 FPS, offering comparable gaming experiences.
Marvel’s Spider-Man Remastered
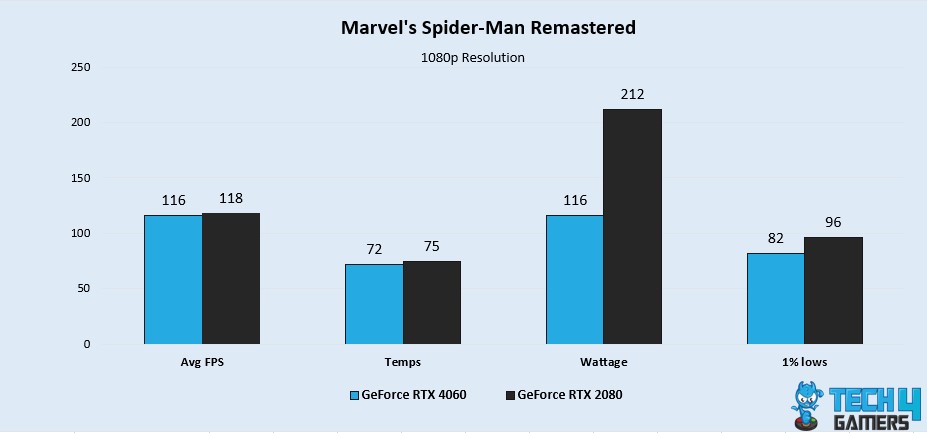
- The RTX 4060 and RTX 2080 showcase a slight 1.7% difference in average FPS performance. The RTX 4060 achieves 116 FPS, while the RTX 2080 achieves 118 FPS.
- Despite its 1% low performance of 82 FPS, significantly lower by 15.7% than the RTX 2080’s stable 96 FPS, the RTX 4060 still delivers respectable gaming performance.
Marvel’s Guardians Of The Galaxy
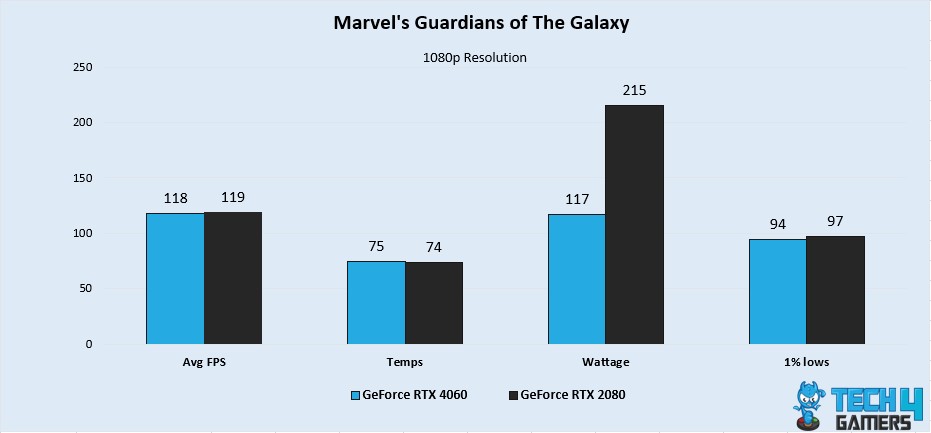
- The RTX 4060 and RTX 2080 demonstrate a marginal 0.8% difference in average FPS performance. The RTX 4060 achieves 118 FPS, while the RTX 2080 achieves 119 FPS.
- The RTX 4060 exhibits a 1% low performance of 94 FPS, demonstrating a 3.1% difference compared to the RTX 2080’s 97 FPS, providing enjoyable gaming experiences.
Dying Light 2
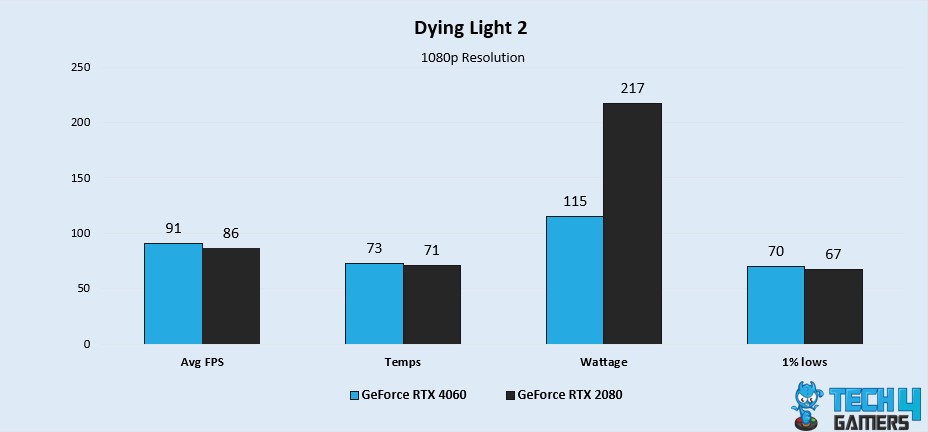
- When I played my last game, the RTX 4060 outperformed the RTX 2080 by 5.6% in average FPS performance, achieving 91 FPS compared to the RTX 2080’s 86 FPS.
- With a 1% low performance of 70 FPS, the RTX 4060 showcases a 4.3% difference compared to the RTX 2080’s 67 FPS, offering solid gaming performance.
Overall Gaming Performance
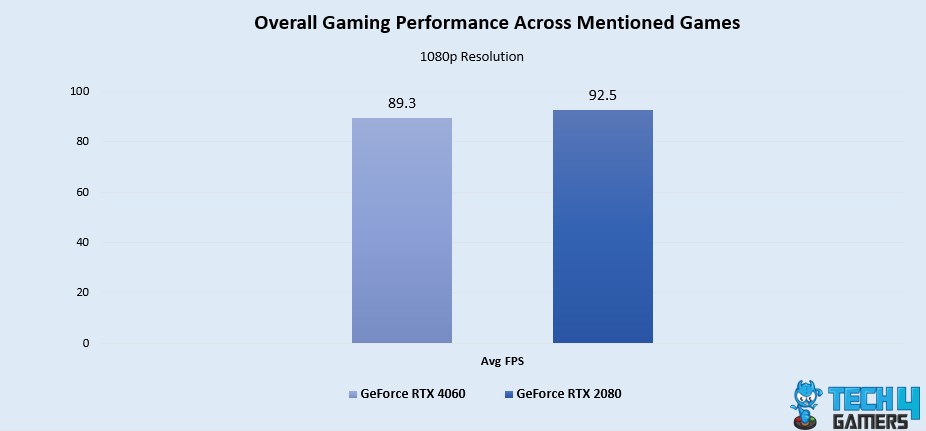
The RTX 2080 demonstrates gaming dominance, achieving an impressive average FPS of 92.5, while the RTX 4060 falls slightly behind with 89.3 FPS. In summary, the RTX 2080 stands out as the clear winner for gamers, boasting a slight 3.5% advantage in FPS performance over the RTX 4060.
Winner: RTX 2080
Average Power Consumption
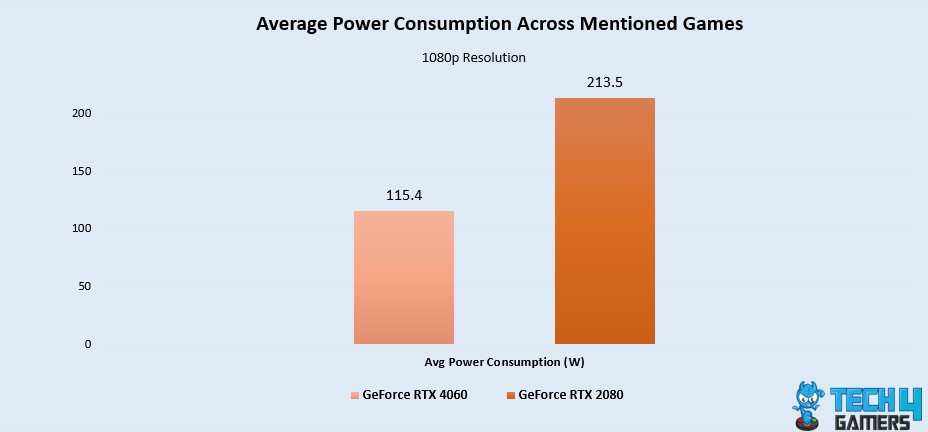
The RTX 4060 stood its ground, averaging a mere 115.4W power consumption. In stark contrast, the RTX 2080, its counterpart, reached an average of 213.5W. Finally, in the power consumption showdown, the RTX 4060 emerges as the undisputed winner, flexing its efficiency muscles with an astonishing 59.6% advantage over the RTX 2080.
Winner: RTX 4060
Average Thermal Statistics
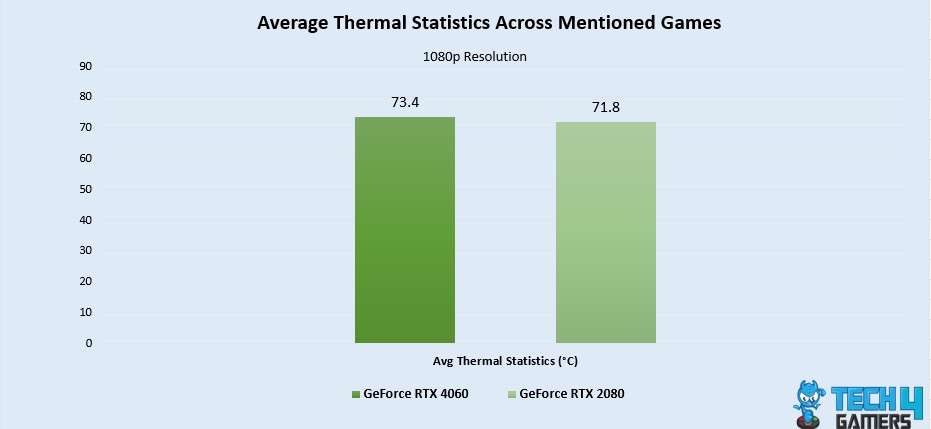
During our thermal management tests, the RTX 2080 emerged, boasting an average of 71.8°C. In contrast, the RTX 4060 trailed slightly behind with an average temperature of 73.4°C, showcasing a marginal difference of 1.6°C. The RTX 2080 proves its dominance by a remarkable margin of 2.1%.
Winner: RTX 2080
Pricing And Availability
| GPU | MSRP | Current Price |
|---|---|---|
| GeForce RTX 4060 | 💲299 | 💲295 |
| GeForce RTX 2080 | 💲699 | 💲849 |
| Difference | 75% | 53.2% |
The RTX 2080 has a price point of around 849 USD, making it a non-budget-friendly option for performance seekers. On the other hand, the RTX 4060 is positioning itself as a budget choice for gamers.
Final Verdict: Which One To Go For?
GeForce RTX 2080: The RTX 2080 proves its gaming dominance with a slight advantage in average FPS performance over the RTX 4060. Additionally, it showcases exceptional thermal efficiency, maintaining lower temperatures during gaming sessions. However, users should note its higher power consumption and relatively higher price point, making it less budget-friendly compared to its counterpart.
GeForce RTX 4060: The RTX 4060 presents itself as a compelling choice for budget-conscious gamers. Despite falling slightly behind in average FPS performance, it excels in power efficiency, consuming significantly less power than the RTX 2080. Moreover, it offers competitive gaming experiences at a more affordable price point.
More From RTX 2080
More From RTX 4060
Thank you! Please share your positive feedback. 🔋
How could we improve this post? Please Help us. 😔
[Comparisons Expert]
Shehryar Khan, a seasoned PC hardware expert, brings over five years of extensive experience and a deep passion for the world of technology. With a love for building PCs and a genuine enthusiasm for exploring the latest advancements in components, his expertise shines through his work and dedication towards this field. Currently, Shehryar is rocking a custom loop setup for his built.
Get In Touch: shehryar@tech4gamers.com


