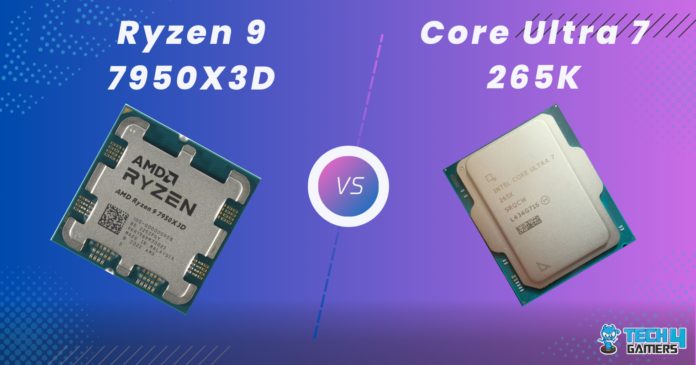
AMD Ryzen 9 7950X3D Rated: 8/10 Intel Core Ultra 7 265K Rated: 7.6/10
Pros And Cons
| CPU | Pros | Cons |
|---|---|---|
| Core Ultra 7 265K | ✅ Has 4 more physical cores ✅ More modern manufacturing process | ❌ Worse in terms of performance |
| Ryzen 9 7950X3D | ✅ Has 100 MB larger L3 cache size ✅ Better in terms of performance | ❌ Much more expensive |
Comparison Table
| Feature | Core Ultra 7 265K | Ryzen 9 7950X3D |
|---|---|---|
| Codename | Arrow Lake | Zen 4 (Raphael) |
| Model number | 265K | - |
| Integrated GPU | Arc Xe2 (Arrow Lake-S) | Radeon Graphics (Ryzen 7000) |
| Transistors | - | 13.1 billions |
| Fabrication Process | 3 nm | 5 nm |
| Socket | FCLGA-1851 | AM5 |
| Best Motherboards | - | Best Motherboards For Ryzen 9 7950X3D |
| Best CPU Coolers | - | Best CPU Coolers For Ryzen 9 7950X3D |
| Best RAM | - | BEST RAM For Ryzen 9 7950X3D |
Architectural Differences
- Core Count: The 7950X3D has 16 cores and 32 threads, which is higher than the 20 cores and 20 threads, which are comprised of 8 P-cores and 12 E-cores.
- Clock Speed: Our Ryzen 9 7950X3D has a base clock of 4.2GHz with a boost of up to 5.7GHz, whereas the 265K has a base clock of 3.9GHz and a boost of up to 5.4GHz.
- Process Node: The Ryzen processor has a manufacturing process of 5nm, whereas the 265K has a 3nm fabrication process.
- TDP: The 7950X3D has a PL1 TDP of 120 watts, which is a bit lower than the 125-watt TDP of the 265K.
- Cache: The Ryzen 7950X3D has a huge 128MB L3 cache buffer, whereas the 265K has an L3 cache of around 30MB.
The X3D chips have made a name for themselves as being one the most powerful gaming processors on the market. Intel has tried to catch up with AMD with their new Core Ultra chips. In the Core Ultra 7 265K vs Ryzen 9 7950X3D comparison, let’s see how these two powerhouses compared to each other.
Gaming Benchmarks – 1080p
Now that we have the specs of these processors out of the way, let us see how these processors compare against each other in gaming benchmarks at 1080p. To test this out, we have used a test bench, the specs of which are written below:
Test Bench
- OS – Windows 11
- CPU Cooler – Enermax LiqMaxFlo 360mm
- Graphics Card – GIGABYTE RTX 4090 Gaming OC 24G
- SSD – XPG Gammix S50 Lite
- Power Supply – be quiet! Dark Power Pro 13 1300W
- Mobo (AMD) – ASRock X870E Taichi Lite
- Mobo (Intel) – MSI MPG Z890 Edge Ti WiFi Review
Star Wars Jedi: Survivor

- In terms of average framerates, the Ryzen 9 7950X3D was about 40% faster with an average of 204 FPS, whereas the Core Ultra 7 265K had an average of 146 FPS.
- The 1% lows were about 44% higher on the AMD chip at about 184 FPS in our testing, whereas the Core Ultra 7 265K got down to around 128 FPS in our testing.
The Last Of Us Part 1

- There was a very small 1.5% difference between the 196 FPS of the Ryzen 9 and the 193 FPS of the Core Ultra in our testing of The Last Of Us Part 1.
- The minimum framerates were about 5.5% higher on the Intel chip at about 136 FPS, whereas the 7950X3D had lows of about 129 FPS.
Cyberpunk 2077

- The 7950X3D was exactly 25% faster in our testing of Cyberpunk 2077, where it had an average framerate of 185 FPS, whereas the Core Ultra 7 265K hovered closer to about 148 FPS.
- The difference shrank to 20% when it came to the 1% lows, where the 7950X3D got a framerate of around 136 FPS, whereas the 265K had a performance of about 113 FPS.
Hogwarts Legacy

- AMD’s 7950X3D managed an impressive 26% lead in this game, where it had an average framerate of about 150 FPS, whereas the Core Ultra 7 265K hovered closer to about 119 FPS.
- The minimum framerates were about 98 FPS on the Ryzen processor, whereas the Core Ultra had a performance about 18% lower at about 83 FPS.
Remnant 2

- The Ryzen kept a 17% lead in our Remnant 2 test. It had an average framerate of about 137 FPS in our testing, whereas the Core Ultra 7 265K hovered closer to an average of 117 FPS.
- The difference became a hair smaller at about 15.5%, with the 7950X3D getting lows of about 119 FPS, whereas the Core Ultra 7 265K hovered at about 103 FPS.
Homeworld 3

- The 7950X3D was only faster by about 4.8% in this game, where it had an average framerate of 88 FPS in our testing, whereas the 265K was nipping at its heels with a framerate of 84 FPS.
- The 1% lows were vastly different between the two chips, with the 7950X3D getting a framerate of 43 FPS, a whole 53.5% higher than the 28 FPS of the 265K.
A Plague Tale: Requiem

- We measured a 39% advantage to using the Ryzen in our testing, where it had a framerate of about 168 FPS, whereas the Core Ultra 7 265K hovered closer to about 121 FPS in A Plague Tale: Requiem.
- The minimum framerates also had a similar difference of about 38%, where the 7950X3D got a framerate of about 101 FPS, whereas the Core Ultra 7 265K had lows of about 73 FPS.
Hitman 3

- Finally, there was a very small difference in the averages of Hitman 3, where the 7950X3D hovered at about 257 FPS, whereas the 265K stuck closer to 256 FPS.
- The minimums flipped the table, with the 7950X3D sticking to about 231 FPS, whereas the Core Ultra 7 265K hovered closer to 232 FPS.
Productivity Benchmarks
Now that the gaming benchmarks are over, we will cover the performance of these chips in a couple of productivity tests. If you are wondering about the test bench for this section, it is the same one we’ve mentioned above for the gaming tests.
Cinebench R24

- The single-core score of the 265K was about 18% higher than the 7950X3D at about 123 points and 145 points, respectively.
- As for the multicore score, the 7950X3D hovered around 2119 points, which was very close to the 2165 points that the Core Ultra 7 got in our testing.
7-Zip

- The Ryzen won by about 12.5% in our 7-Zip compression test, in which it had a score of about 205 points, while the 265K hovered closer to about 182 points.
- The Core Ultra 7 265K scored about 176 points in our 7-Zip decompression test, which was about 50% behind the 265 points that the 7950X3D produced.
Photoshop

- In the Pudget Systems benchmark, the 7950X3D performed around 12.5% better than the Core Ultra 7 in our testing.
- The 7950X3D had a performance of about 10399 points, while the 265K hovered closer to about 9246 points.
Overall Performance
Average Framerate
On average, our testing showed that the Ryzen 9 7950X3D was about 17% faster than the Core Ultra 265K in gaming. As you can imagine, this is a very significant difference, though the delta would shrink if we did these tests at higher resolutions.
1% Lows
The average difference was about 16% in the 1% lows of the games we tested, with the 7950X3D being the obvious advantage. It performed much better in our testing, and the games we ran on it were like butter. A small number of games came close to matching the power of 7950X3D on the Core Ultra 7 265K.
Productivity
All benchmarks except the Cinebench R23 single-core test ran substantially worse on the Core Ultra 7 265K. Not only did the Ryzen beat the Intel processor in gaming, it also took the cake when it came to productivity performance. The 7950X3D takes the cake in overall performance because of its victories.
Power
| Game | Ryzen 9 7950X3D | Core Ultra 7 265K |
|---|---|---|
| Star Wars Jedi: Survivor | 85 | 123 |
| The Last Of Us Part 1 | 88 | 117 |
| Cyberpunk 2077 | 82 | 131 |
| Hogwarts Legacy | 80 | 115 |
| Remnant 2 | 89 | 120 |
| Homeworld 3 | 85 | 135 |
| A Plague Tale: Requiem | 82 | 122 |
| Hitman 3 | 85 | 125 |
| Average Power Draw | 84.5⚡ | 123.5⚡ |
| Winner: Ryzen 9 7950X3D | ||
In addition to the improved gaming and productivity performance, the Ryzen 9 7950X3D also took about 32% less power than its competition in our testing. This means that the Ryzen has a much better performance-per-watt than the Core Ultra 7 265K.
Temperature
| Game | Ryzen 9 7950X3D | Core Ultra 7 265K |
|---|---|---|
| Star Wars Jedi: Survivor | 74 | 68 |
| The Last Of Us Part 1 | 67 | 64 |
| Cyberpunk 2077 | 68 | 66 |
| Hogwarts Legacy | 77 | 78 |
| Remnant 2 | 71 | 67 |
| Homeworld 3 | 68 | 65 |
| A Plague Tale: Requiem | 72 | 68 |
| Hitman 3 | 75 | 76 |
| Average Temperatures | 71.5🌡️ | 69🌡️ |
| Winner: Core Ultra 7 265K | ||
Temperatures were about the same on both processors, though the Ryzen 9 7950X3D ran about only 3.6% hotter. This difference is not any means of concern because both processors stayed well within safe temperature ranges in our testing, though both did get a bit toasty.
Price
| CPU | Ryzen 9 7950X3D | Core Ultra 7 265K | Price Difference |
|---|---|---|---|
| Launch MSRP | 💲699 | 💲394 | 77.41% |
| Current Price | 💲499 | 💲384 | 29.95% |
The 7950X3D was released for a much higher launch price than the Core Ultra 7 265K did, though this difference has gone from almost double the price to about 30% in the last year. Still, the 7950X3D is quite a bit pricier than the 265K, with our research indicating a $115 price difference.
What We Recommend
Ryzen 9 7950X3D: The 7950X3D beat the Intel chip by a substantial margin in all the tests we did. It had a lower power consumption, performed better in the gaming tests, and outpaced the 265K in terms of productivity, too. However, the price tag of this chip is significantly higher.
Core Ultra 7 265K: This chip performed adequately in our testing. Though it did not beat the 7950X3D, some people might not benefit from the gain in performance it makes. Additionally, the delta between these two in gaming would disappear to your game at higher resolutions like 1440p or 4K.
The Ryzen 9 7950X3D outperforms gaming, productivity, and efficiency but costs more. The Core Ultra 7 265K offers good value, especially for high-resolution gaming.
The Ryzen 9 7950X3D has basic Radeon Graphics. The peak temperature of the Ryzen 9 7950X3D is 89°C. The peak temperature of the Core Ultra 7 265K is 105°C. The Core Ultra 7 265K has Intel Arx Xe2 graphics. The Core Ultra 7 265K and the Ryzen 9 7950X3D have a bus frequency of about 100MHz. FAQs
More From Ryzen 9 7950X3D More From Core Ultra 7 265K
Thank you! Please share your positive feedback. 🔋
How could we improve this post? Please Help us. 😔
[Comparisons Expert]
Abdemanaf is a skilled creative writer who has been honing his craft since 2011. While initially working in different fields, he found a passion for technology and has been exploring the tech world since early 2015. Over the years, he has developed an in-depth knowledge of the latest tech trends and product offerings by various companies.
Abdemanaf’s writing reflects his analytical mindset and ability to think critically. He has a knack for breaking down complex technical information into easily digestible pieces, making his articles engaging and accessible to readers from all backgrounds. In February 2022, he joined Tech4Gamers as a blog and product comparison writer, where he has been able to hone his skills further.
As a writer, Abdemanaf is dedicated to staying up-to-date with the latest technological advancements and trends, enabling him to provide readers with the most relevant and accurate information. He is always eager to learn more and is constantly seeking new challenges to improve his skills.
Get In Touch: manaf@tech4gamers.com


![Core i3 13100 Vs Ryzen 5 5600 [8 Games Tested]](https://tech4gamers.com/wp-content/uploads/2023/07/CPU-Comparison-Template-NEW-218x150.jpg)
