At Tech4Gamers, I proudly wear the title of Comparisons Specialist. Focused on CPUs and GPUs, I bring forth a wealth of hands-on experience and a keen eye for detail to provide our audience with the latest insights and analyses.
The Nvidia RTX 4070 is our recommended choice for exceptional 1440P gaming, offering an impressive 8.9% boost in gaming performance compared to the RTX 3070 Ti.
During our 1440P gaming, the RTX 4070 proved to be 45.4% more power-efficient than the RTX 3070 Ti, enhancing both performance and energy efficiency.
While the RTX 3070 Ti exhibits slightly better thermal efficiency by 6.1% in our 1440P gaming, the RTX 4070 maintains stability and cooler operation.
The RTX 4070 is better if you want to buy either card new, but if you’re looking at the used market, go for the RTX 3070 Ti.
Why Trust Tech4Gamers
Ali is our comparison expert who has been benchmarking graphics cards, and processors.
100+ components tested and reviewed by our team of hardware experts (Tech4Gamers Team).
100+ hours spent testing different components for our comparisons.
At Tech4Gamers, ensuring you get reliable information is our priority. That’s why every hardware round-up undergoes a meticulous review process by our team of experts and editors. Each review is carefully examined against our strict editorial guidelines, guaranteeing you trustworthy insights you can depend on.
Process Node: The RTX 3070 Ti uses 8nm processing nodes, whereas the RTX 4070 uses much more modern and efficient 5nm nodes.
Clock Speed: The RTX 3070 Ti has a base clock of 1575 MHz and a boost of up to 1770 MHz. The base of the 4070 is 1920 MHz, with a boost of up to 2475 MHz.
VRAM: Nvidia’s RTX 3070 Ti has a memory size of 8 gigabytes, whereas the RTX 4070 uses 12 gigabytes of memory. Both cards use GDDR6X memory.
TDP: The RTX 3070 Ti has a 290-watt TDP, which is substantially higher than the 200-watt TDP of the newer card.
Nvidia’s new RTX 4070 serves as solid competition to the current market of graphics cards, but can it hold a candle to its best predecessor? Find out in the RTX 4070 vs RTX 3070 Ti comparison!
Gaming Performance – 1440p
Our website specializes in gaming tests, which is exactly what we’re going to take a look at next. The gaming tests of the RTX 4070 vs RTX 3070 Ti comparison were conducted at 1440p.
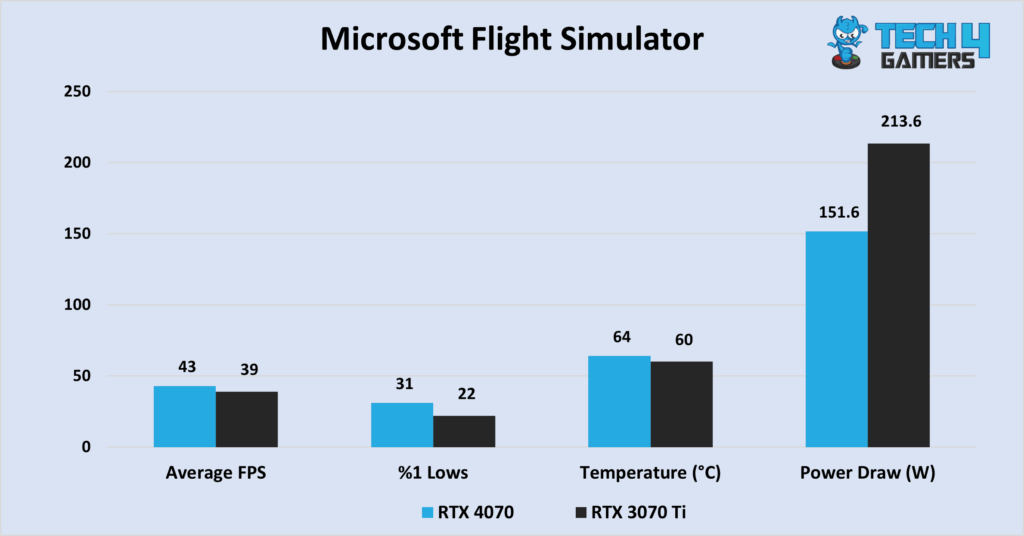
Microsoft Flight Simulator – Image Credits (Tech4Gamers)
Starting with our Microsoft Flight Simulator gameplay, the RTX 4070 takes the lead with 43 FPS on average, and the RTX 3070 Ti scores 39 FPS, signaling a 10% difference.
In terms of 1% lows, the RTX 4070 comes out with 31 FPS, taking a 40.9% lead over the RTX 3070 Ti’s 22 FPS lows.
Dying Light 2
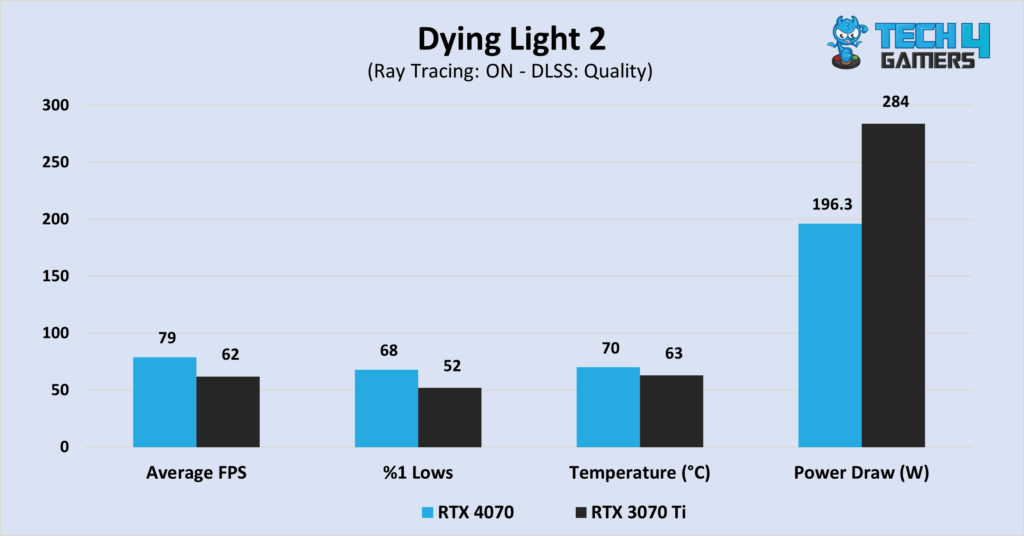
Dying Light 2 – Image Credits (Tech4Gamers)
Testing Dying Light 2 with ray tracing on, we saw the RTX 4070 averages a health 79 FPS. Its rival 3070 Ti records 62 FPS which computes to a 27% difference.
The RTX 4070 had lows of 68 FPS, which is a 30.7% increase against the 52 FPS minimums of the RTX 3070 Ti.
Far Cry 6
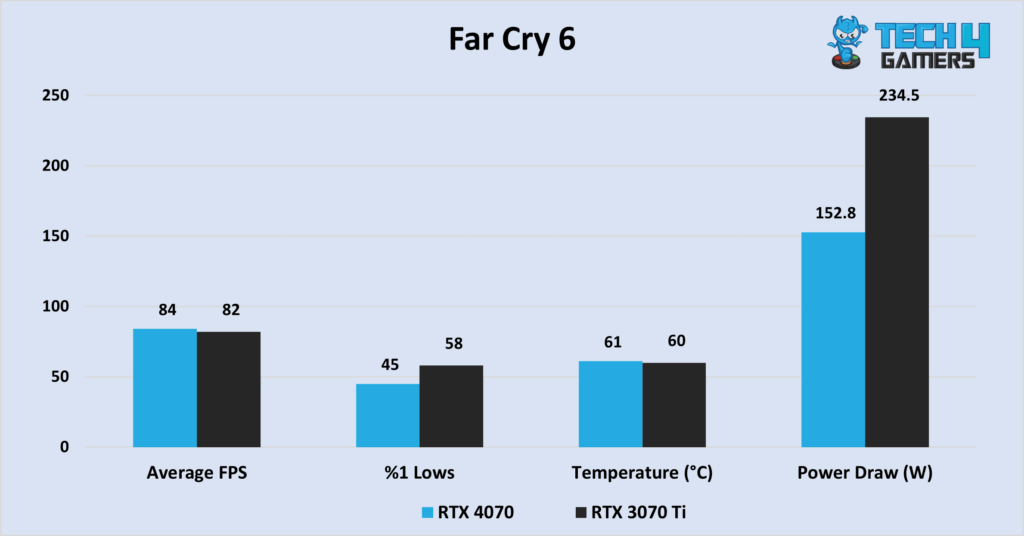
Far Cry 6 – Image Credits (Tech4Gamers)
In our Far Cry 6 test, the RTX 4070 had an average framerate of 84 FPS, while the RTX 3070 Ti was only 2.5% behind, with an average of 82 FPS.
The results flipped in the minimums, with the RTX 4070 getting lows of 45 FPS, which were 28.8% lower than the 58 FPS lows of the RTX 3070 Ti.
Back 4 Blood
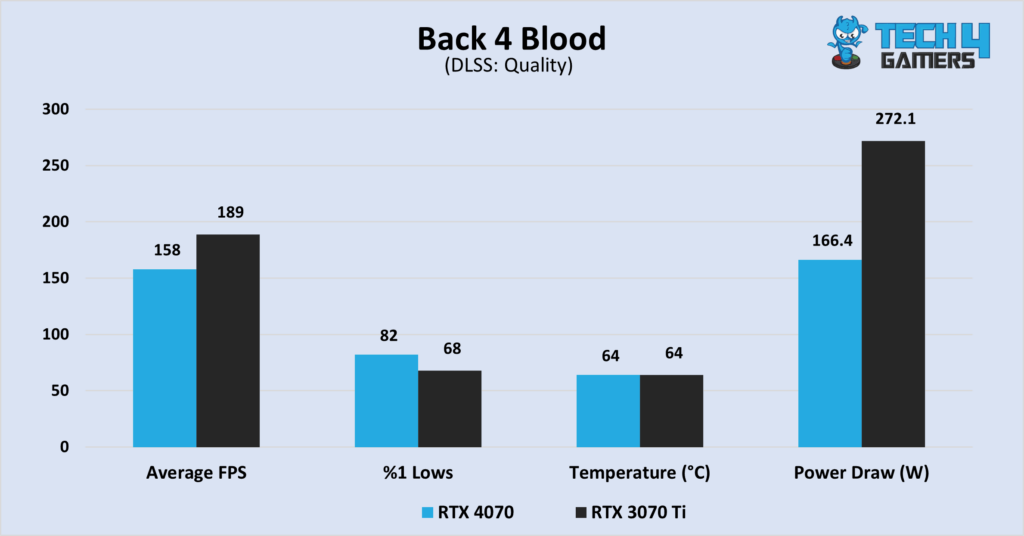
Back 4 Blood – Image Credits (Tech4Gamers)
Our test of Back 4 Blood showed that the RTX 3070 Ti had an average framerate of 189 FPS, which was 19.6% higher than the 158 FPS of the RTX 4070.
Things take a turn in terms of frame times as the RTX 4070 scores 82 FPS. The RTX 3070 Ti falls behind with 68 FPS, constituting a 20% difference.
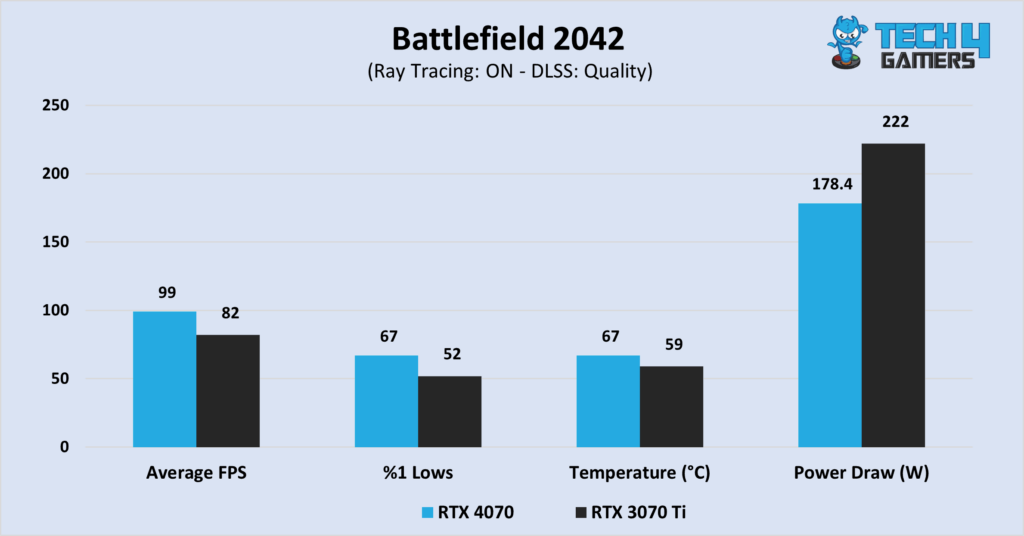
Battlefield 2042
Battlefield 2042 – Image Credits (Tech4Gamers)
In our Battlefield 2042 test, the RTX 4070 continues its lead, averaging 99 FPS. The RTX 3070 Ti is trailing by 20.7% here with an average of 82 FPS.
Nvidia’s RTX 3070 Ti is trailing the RTX 4070 again regarding 1% lows, scoring 52 FPS in reply to 67 FPS, adding up to a 28% difference in performance.
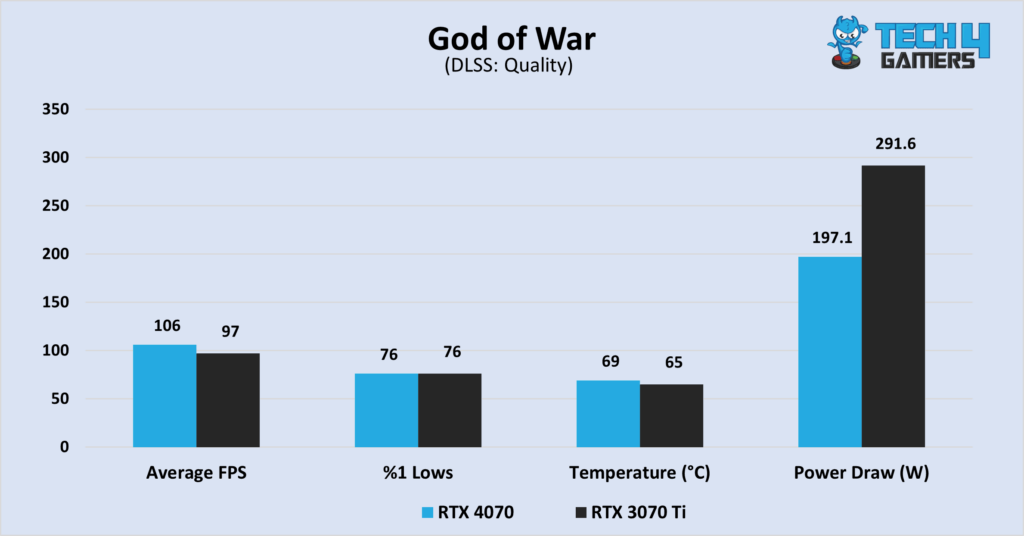
God Of War
God of War – Image Credits (Tech4Gamers)
The RTX 3070 Ti scores 97 FPS on average in our benchmarking, making it 9.2% slower than the RTX 4070, which had an average of 106 FPS.
Both GPUs score 76 FPS as far as the 1% lows are concerned.
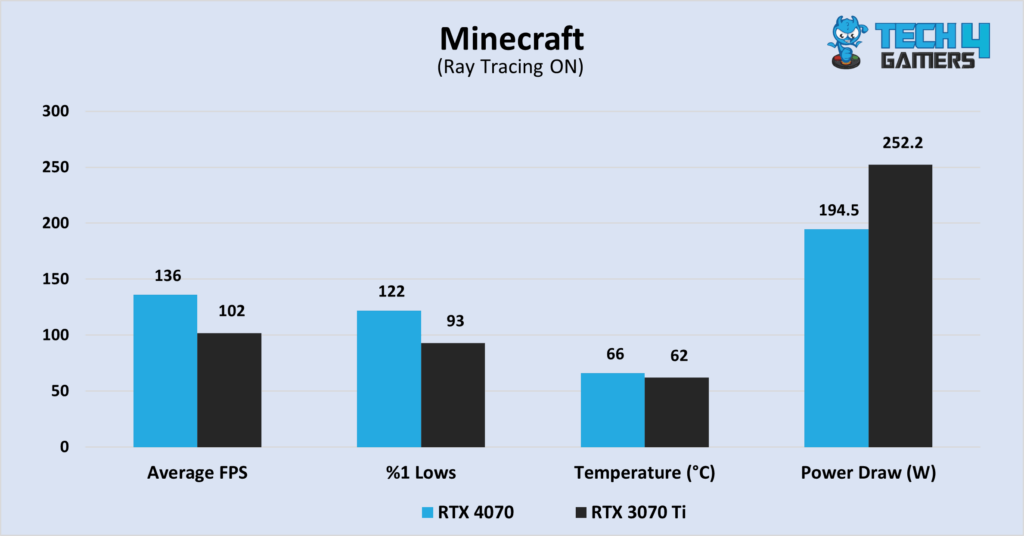
Minecraft
Minecraft – Image Credits (Tech4Gamers)
The RTX 4070 averaged 136FPS with RT enabled in our Minecraft tests, while the RTX 3070 Ti averaged 102 FPS, showing a difference of 33%.
In our test of 1% lows, the Nvidia RTX 4070 manages 122 FPS, keeping a comfortable 31.1% lead over the 93 FPS of the RTX 3070 Ti.
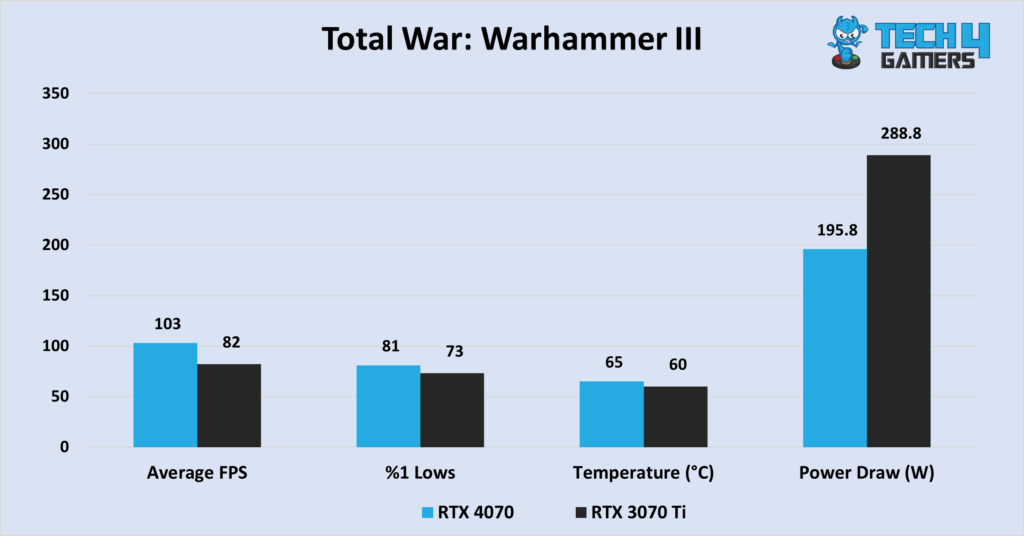
Total War: Warhammer III
Total War: Warhammer 3 – Image Credits (Tech4Gamers)
In this title, the GeForce RTX 4070 manages 103 FPS on average in our tests. On the other hand, the RTX 3070 Ti scores 82FPS, which computes a difference of .25%
The RTX 4070 maintains its lead with a framerate of 81 FPS – staying 16.9% ahead in terms of 1% lows over the 73 FPS of the RTX 3070 Ti.
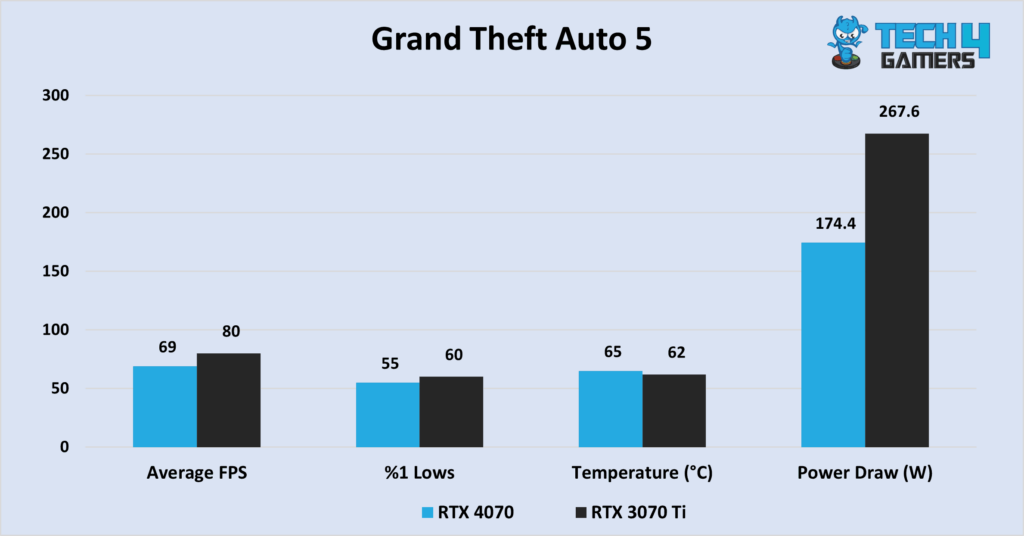
Grand Theft Auto 5
Grand Theft Auto 5 – Image Credits (Tech4Gamers)
GTA V ran with an average framerate of 69 FPS on the RTX 4070, which was 15.9% lower than the 80 FPS of the RTX 3070 Ti.
The 1% lows of the RTX 3070 Ti held around 60 FPS, which was around 9% higher than the 55 FPS of the RTX 4070.
Overall Gaming Performance
Processor
Average FPS
1% Lows
RTX 4070
104.9📈
69.8📉
RTX 3070 Ti
96.3📈
62📉
Winner: RTX 4070
Average Framerate
In our testing, we found that the RTX 4070 was around 8.9% faster on average than the RTX 3070 Ti. This wasn’t the case all of the time, with a few games running better on the RTX 3070 Ti.
1% Lows
As with the averages, the lows were also better on the RTX 4070, around 12.5% higher to be exact. This lead was very noticeable in some games. However, the RTX 3070 Ti also managed to come out ahead in some games in this regard.
Zooming out a bit, we can see clearly that the RTX 4070 is the better performer of the two, even while disregarding DLSS frame generation.
Power Consumption
Game
RTX 4070
RTX 3070 Ti
Microsoft Flight Simulator
151.6
213.6
Dying Light 2
196.3
284
Far Cry 6
152.8
234.5
Back 4 Blood
166.4
272.1
Battlefield 2042
178.4
222
God Of War
197.1
291.6
Minecraft
194.5
252.2
Total War: Warhammer III
195.8
288.8
Grand Theft Auto 5
174.4
267.6
Age Of Empire IV
196.9
297.7
Average Power Draw
180.4⚡
262.4⚡
Winner: RTX 4070
Even though it had better performance in games, the RTX 4070 managed to pull 45% less power compared to the RTX 3070 Ti. This makes it significantly more power efficient than its predecessor, which is exactly what Nvidia claimed with this card.
Thermal Performance
Game
RTX 4070
RTX 3070 Ti
Microsoft Flight Simulator
64
60
Dying Light 2
70
63
Far Cry 6
61
60
Back 4 Blood
64
64
Battlefield 2042
67
59
God Of War
69
65
Minecraft
66
62
Total War: Warhammer III
65
60
Grand Theft Auto 5
65
62
Age Of Empire IV
68
66
Average Temperature
65.9🌡️
62.1🌡️
Winner: RTX 3070 Ti
Our testing showed that the thermals of the RTX 3070 Ti were around 6.1% lower than that of the RTX 4070. Despite the difference, neither GPU had alarming temperatures, with both sitting comfortably in the safe zone.
Pricing And Availability
CPU
Launch MSRP
Current Price
RTX 4070
💲599
💲519
RTX 3070 Ti
💲599
💲499
Price Difference
0%
3.93%
As of September 2024, the RTX 4070 and the RTX 3070 Ti have very similar prices on Amazon, with there only being a very small 3.93% difference. However, you can find the RTX 3070 Ti for a much lower price on the used market.
RTX 3070 Ti Vs RTX 4070: Which One Would We Recommend?
RTX 4070: Our testing showed that this card performed better when it came to gaming at 1440p, and it also had much better power-efficiency. It was also only a bit more pricey than its competition, making it the better choice if you want to buy a new card.
RTX 3070 Ti: Though this card lost overall, in some games it had better performance than the RTX 4070. It had slightly lower thermals as well, for what its worth. Additionally, the lower price tag also makes it so that this card can be had for a discounted price on the used market.
With the data that is available, we think that the RTX 4070 is the better choice if you are choosing between these two cards, but we would love to hear your opinions in the comments below!
Frequently Asked Questions
Does Nvidia RTX 3000 series support DLSS 3?
No. DLSS 3 support is limited to the Lovelace RTX 4000 cards as they have improved Tensor cores to support this technology.
I’m a passionate computer hardware expert specializing in CPUs and GPUs. With a lifelong curiosity for hardware and extensive hands-on experience, I provide valuable insights, practical advice, and in-depth analysis on these components. Engaging with the hardware community, I exchange knowledge and stay at the forefront of technological advancements.


Feedback By: