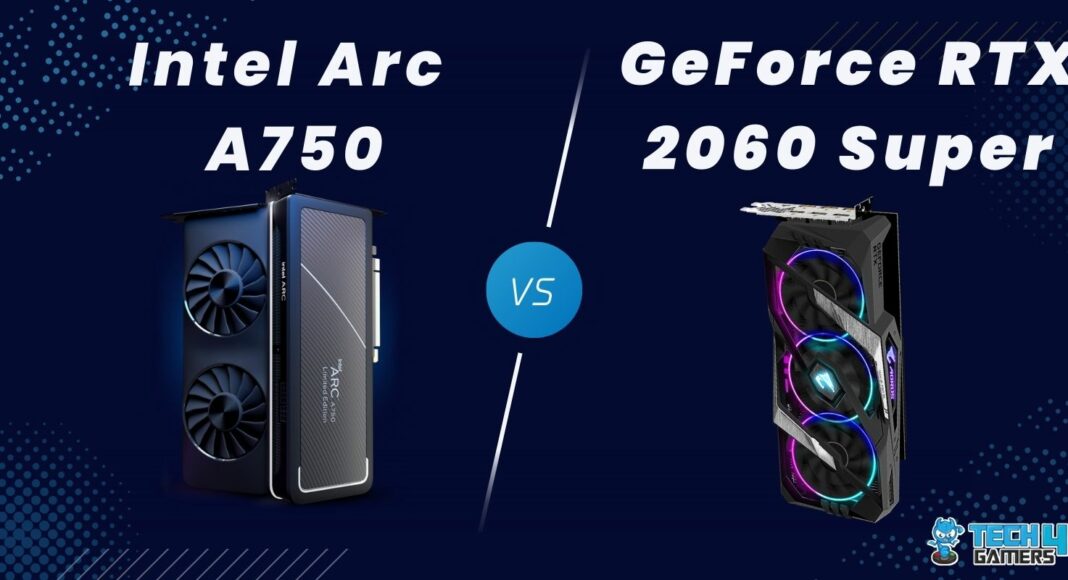
Intel Arc A750
Rated: 8.5/10
NVIDIA RTX 2060 Super
Rated: 8.4/10
Pros And Cons
| GPU | Pros | Cons |
|---|---|---|
| Intel Arc A750 | ✅Impressive 1080p performance ✅Sleek and minimalist design | ❌Only equipped with 8GB VRAM |
| GeForce RTX 2060 Super | ✅Exceptional value compared to other RTX cards ✅ DLSS technology for enhanced performance. | ❌Thermal solution causes extra heat |
- The Intel Arc A750 shows a 6% lead in average FPS across various benchmarks. It demonstrates significant advantages in titles like Red Dead Redemption 2, Hitman 3, and Cyberpunk 2077.
- The RTX 2060 Super consumes approximately 1.8% less power on average and boasts superior thermal management with an 8.2% lead in thermal efficiency.
- The difference in current prices between the two GPUs is 200%, showcasing a substantial increase in the price of the RTX 2060 Super compared to its initial MSRP.
- The Intel Arc A750 is recommended for gamers prioritizing raw gaming performance, benefiting from its higher clock speeds and VRAM capacity. While, the RTX 2060 Super offers better power efficiency, thermal management, and DLSS technology, making it a cost-effective option.
Comparison Table
| Technical Specs | Intel Arc A750 | RTX 2060 Super |
|---|---|---|
| GPU Name | DG2-512 | TU106 |
| Architecture | Generation 12.7 | Turing |
| CUDA Cores | 3584 | 2176 |
| Tensor Cores | NA | 272 |
| RT Cores | 28 | 34 |
| ROPs | 112 | 64 |
| TDP | 225W | 175W |
| Suggested PSU | 550W | 450W |
Architectural Difference
- Process Node: An important difference between the Arc A750 and the RTX 2060 Super lies in their process size: 6nm for the Arc A750 and 12nm for the RTX 2060 Super.
- Clock Speed: Moreover, Arc A750 boasts higher clock speeds (2050 MHz base, 2400 MHz boost) than the RTX 2060 Super (1470 MHz base, 1650 MHz boost), providing a performance edge.
- VRAM: Furthermore, both the Arc A750 and RTX 2060 Super are equipped with 8GB of GDDR6 VRAM.
- TDP: Moreover, the Arc A750 boasts a higher TDP of 225W, providing greater power for enhanced performance, while the RTX 2060 Super has a slightly lower TDP of 175W.
- Supported Technologies: Finally, the RTX 2060 Super harnesses DLSS for enhanced graphics. Meanwhile, the Arc A750 utilizes XeSS to elevate visual quality.
This article will explore the performance, specs, and feature differences between the ARC A750 and RTX 2060 Super. Let’s now dive into these two graphics cards and check what distinct things they have to offer.
Gaming Performance Benchmarks
Now, we’ll uncover these two graphics cards’ distinct capabilities and performance differences through rigorous benchmarking and analysis.
Testing Rig
- CPU: Intel Core i5-13600K
- Memory: Kingston Fury Renegade RGB DDR5 32GB 7200MHz
- Power Supply: ENERMAX REVOLUTION D.F. X 1050W
- Storage Drive: Sabrent Rocket 4 Plus G 2TB NVMe SSD
- Motherboard: MSI MEG Z790 ACE MAX Motherboard
- Operating System: Windows 10 Pro
Red Dead Redemption 2
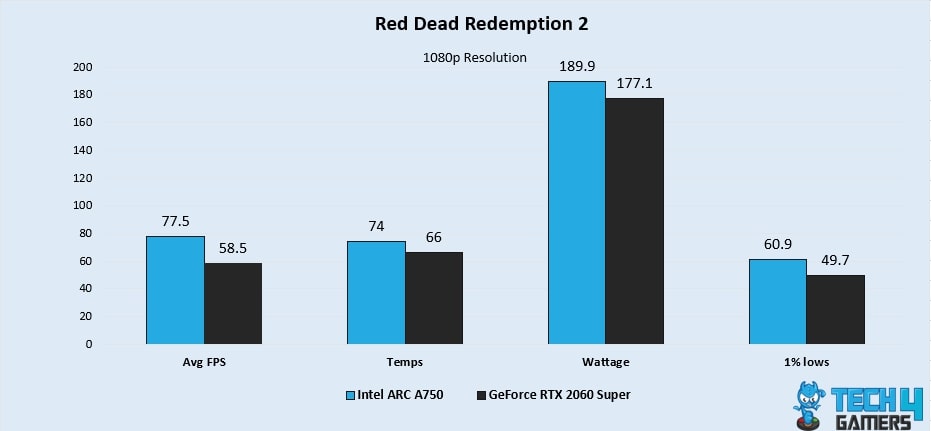
- In our first test, the ARC A750 demonstrates a significant 27.9% performance advantage, achieving a score of 77.5 compared to the RTX 2060 Super’s 58.5.
- Moreover, the Arc A750 demonstrates a remarkable 1% low performance with 60.9 FPS, surpassing the RTX 2060% Super’s 49.7 FPS by a significant margin of 20.2%.
Returnal
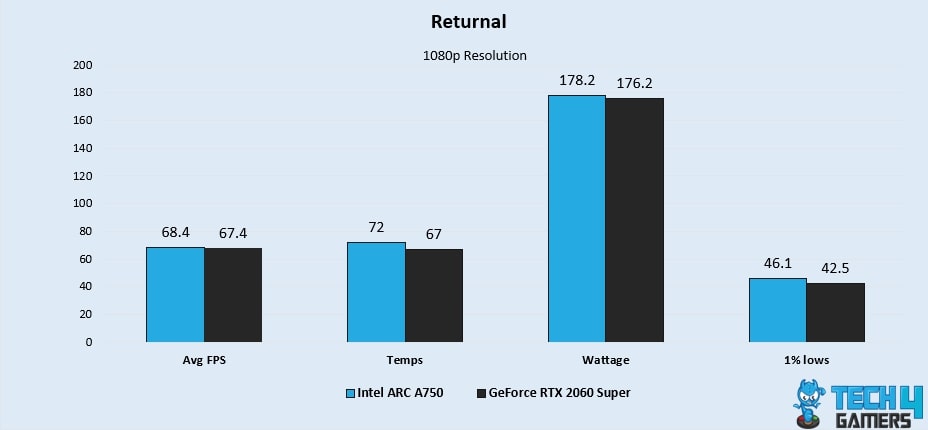
- Starting off, as we transition to average FPS, the ARC A750 narrowly surpasses the RTX 2060 Super by a mere 1.4%, with scores of 68.4 and 67.4, respectively.
- Furthermore, achieving excellent 1% low performance, the Arc A750 outperforms the RTX 2060 Super by 8.1% with 46.1 FPS compared to 42.5 FPS.
Forza Horizon 5
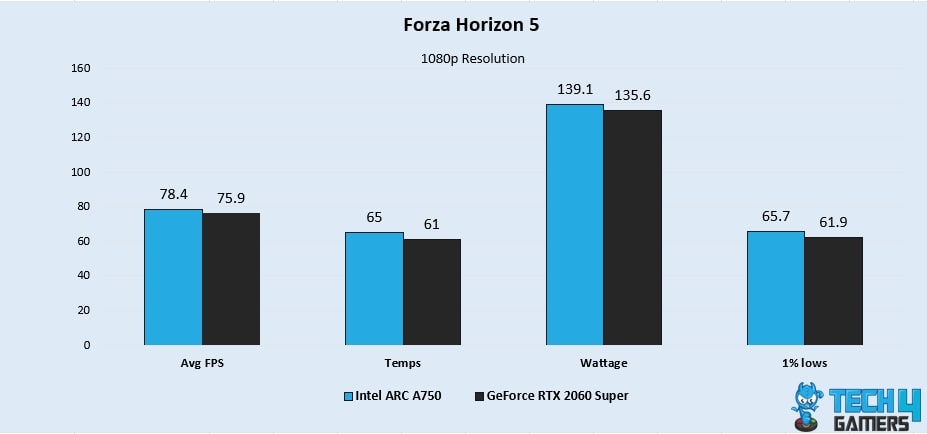
- The ARC A750’s 3.2% lead in average FPS is notable, achieving a score of 78.4 compared to the RTX 2060 Super’s 75.9 performance, in our testing.
- In addition, the Arc A750 showcases an impressive 1% low performance, achieving 65.7 FPS, surpassing the RTX 2060 Super’s 61.9 FPS by 5.9%.
Far Cry 5
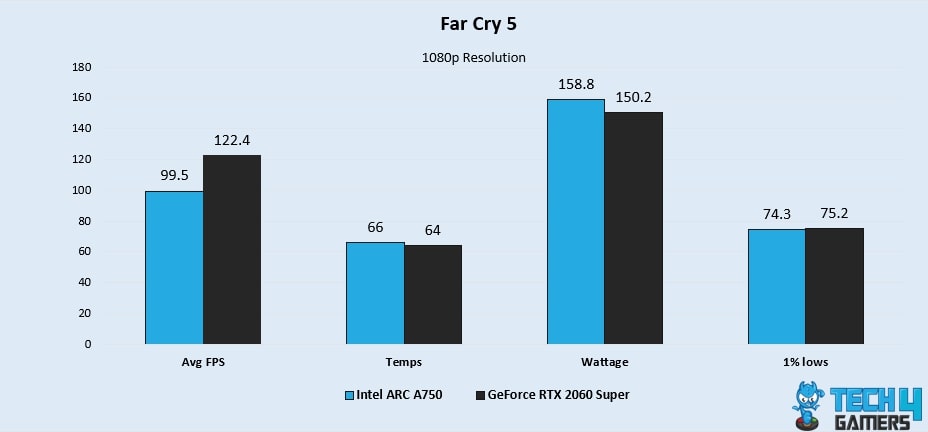
- When playing Far Cry 6, the RTX 2060 Super establishes an impressive 20.6% advantage, with a score of 122.4 FPS, while the Arc A750 trails at 99.5 FPS.
- Furthermore, with a consistent 1% low performance, the RTX 2060 Super maintains 1.2% advantage over the Arc A750, achieving 75.2 FPS compared to 74.3 FPS.
Hitman 3
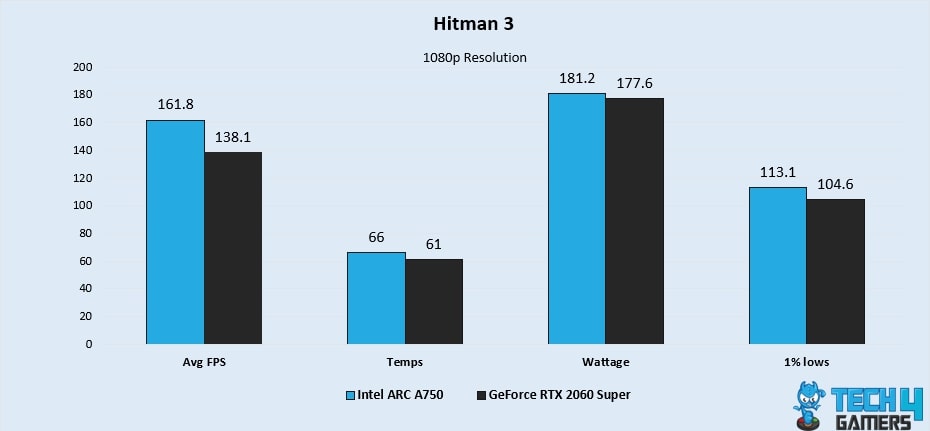
- Starting with a remarkable 15.8% lead in average FPS, the ARC A750 outperforms the RTX 2060 Super, scoring 161.8 FPS compared to 138.1 FPS.
- Surpassing the RTX 2060 Super by 7.8%, the Arc A750 delivers exceptional 1% low performance with 113.1 FPS, while the RTX 2060 Super achieves 104.6 FPS.
Cyberpunk 2077
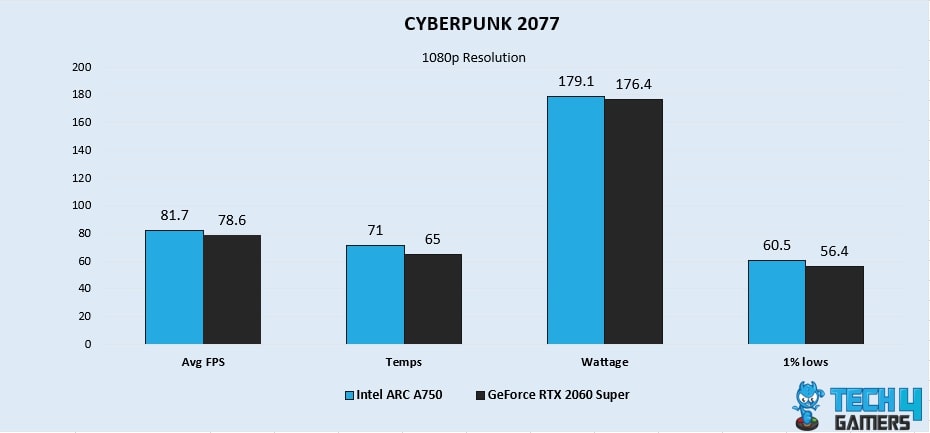
- While playing Cyberpunk 2077, the ARC A750 exhibits a 3.8% lead in average FPS, delivering a score of 81.7 FPS, surpassing the RTX 2060 Super’s 78.6 FPS.
- Furthermore, the Arc A750 demonstrates a commendable 1% low performance with 60.5 FPS, surpassing the RTX 2060 Super’s 56.4 FPS by 7%.
Shadow Of The Tomb Raider
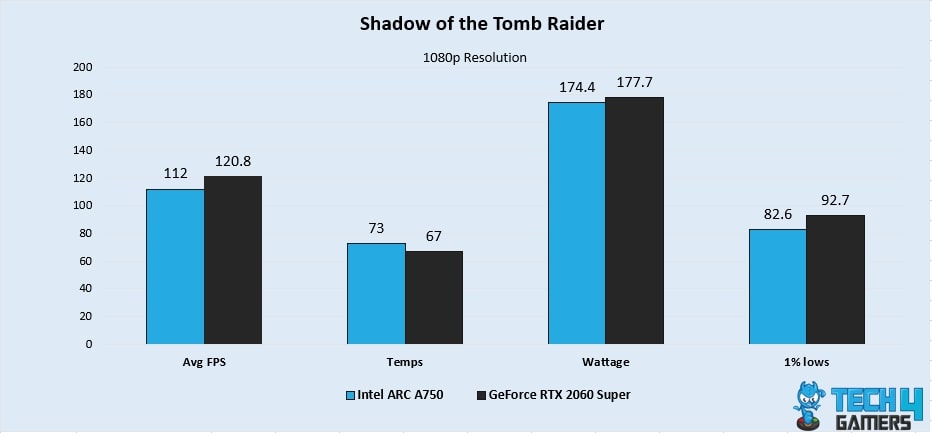
- Regarding average FPS, the RTX 2060 Super holds a slight advantage of 7.5%, achieving a score of 120.8 FPS compared to the Arc A750’s 112 FPS.
- Moreover, the RTX 2060 Super exhibits an impressive 1% low performance, achieving 92.7 FPS, surpassing the Arc A750’s 82.6 FPS by 11.5%.
Horizon Zero Dawn
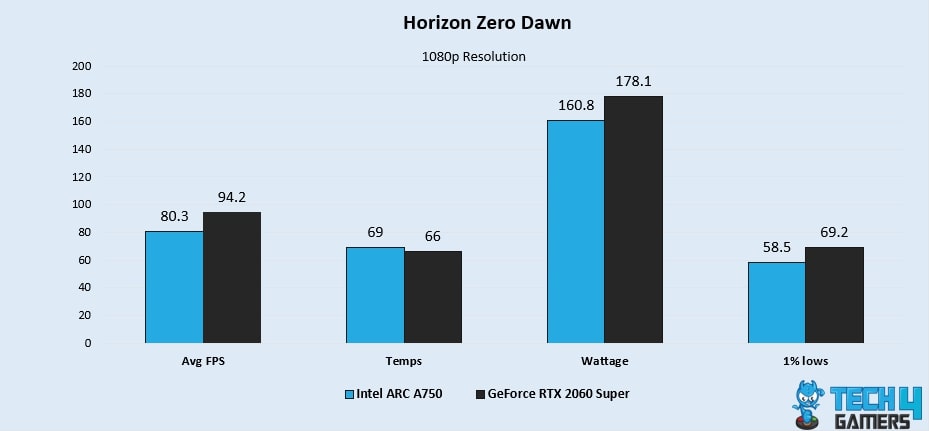
- In my Horizon Zero Dawn, the RTX 2060 Super showcases a 15.9% higher average FPS, achieving a score of 94.2 FPS, while the Arc A750 trails behind at 80.3 FPS.
- Moreover, with exceptional 1% low performance, the RTX 2060 Super outshines the Arc A750 by 16.7%, achieving 69.2 FPS compared to 58.5 FPS.
Unigine Superposition
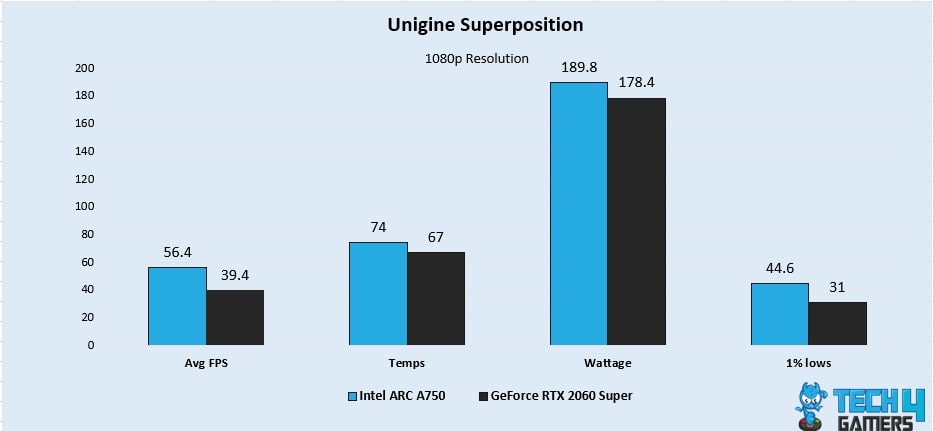
- Firstly, the ARC A750’s significant 35.4% lead in average FPS is noteworthy, scoring 56.4 FPS compared to the RTX 2060 Super’s 39.4 FPS.
- Furthermore, the Arc A750 showcases outstanding 1% low performance with 44.6 FPS, surpassing the RTX 2060 Super’s 31 FPS by an impressive 35.9%.
Fire Strike
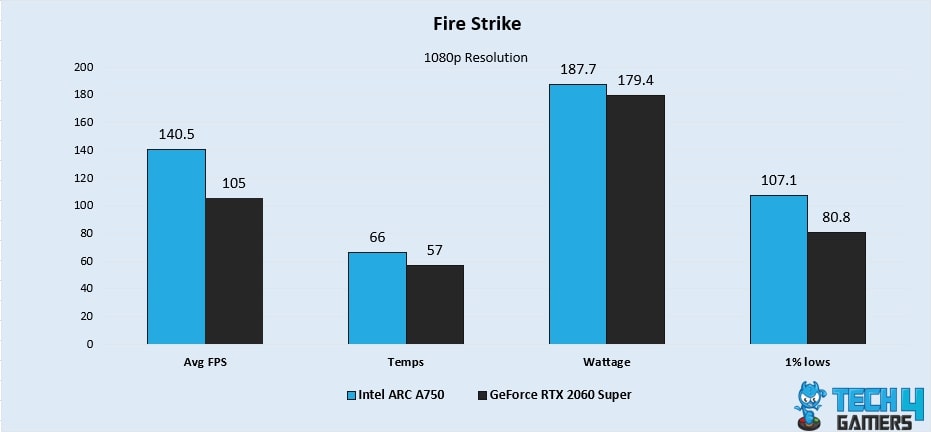
- Firstly, with a substantial 28.9% advantage in average FPS, the ARC A750 outperforms the RTX 2060 Super with a score of 140.5 FPS, leaving the latter at 105 FPS.
- Moreover, the Arc A750 demonstrates a remarkable 1% low performance with 107.1 FPS, surpassing the RTX 2060 Super’s 80.8 FPS by a significant 27.9%.
Overall Gaming Performance
| Featured | Arc A750 | RTX 2060 Super |
|---|---|---|
| Average FPS | 95.6📈 | 90📈 |
| %1 lows | 57.3 📉 | 56 📉 |
| Winner: Intel's Arc A750 | ||
Remarkably, the Arc A750 exhibits a slight edge in average FPS performance, achieving an impressive score of 95.6, surpassing the RTX 2060 Super’s commendable 90. In addition, the Arc A750 demonstrates a modest 6% advantage in terms of FPS performance over the RTX 2060 Super.
Average Power Consumption
| Featured | Arc A750 | RTX 2060 Super |
|---|---|---|
| Average Power Consumption | 173.9⚡️ | 170.6⚡️ |
| Winner: Nvidia's RTX 2060 Super | ||
Our benchmark tests revealed that the RTX 2060 Super consumed slightly less power than the Arc A750, with an average power consumption of 170.6W versus 173.9W for the Arc A750. The RTX 2060 Super demonstrates a slight advantage by consuming approximately 1.8% less power on average.
Average Thermal Statistics
| Featured | Arc A750 | RTX 2060 Super |
|---|---|---|
| Average Temperature | 69.9🌡️ | 64.1🌡️ |
| Winner: Nvidia's RTX 2060 Super | ||
The RTX 2060 Super exhibits better thermal management with significantly lower average temperatures of 64.1°C, surpassing the Arc A750’s average temperature of 69.6°C. In summary, the RTX 2060 Super demonstrates superior thermal management compared to the Arc A750, with a notable 8.2% lead in thermal efficiency.
Pricing And Availability
| GPU | MSRP | Current Price |
|---|---|---|
| Intel Arc A750 | 💲289 | 💲194 |
| RTX 2060 Super | 💲399 | 💲590 |
| Difference | 38% | 200% |
Final Verdict: Which One To Go For?
Intel Arc A750: The Arc A750 impresses with its strong gaming performance, boasting a 6% lead in average FPS over the RTX 2060 Super. Its higher clock speeds and VRAM capacity give it an edge in gaming. However, it’s worth noting that it consumes slightly more power and runs a bit hotter than the RTX 2060 Super.
RTX 2060 Super: While it trails slightly in average FPS, the RTX 2060 Super makes up for it with better power efficiency and temperature management. Its DLSS technology enhances graphics, giving gamers an extra boost. Overall, it’s a good choice for those who prioritize efficiency and temperature control.
If you’re after top gaming performance, the Intel Arc A750 might be the way to go. But if you value efficiency and cost-effectiveness, the RTX 2060 Super could be the better fit.
More From the Intel Arc A750
More From the RTX 2060 Super
Thank you! Please share your positive feedback. 🔋
How could we improve this post? Please Help us. 😔
[Comparisons Expert]
Abdemanaf is a skilled creative writer who has been honing his craft since 2011. While initially working in different fields, he found a passion for technology and has been exploring the tech world since early 2015. Over the years, he has developed an in-depth knowledge of the latest tech trends and product offerings by various companies.
Abdemanaf’s writing reflects his analytical mindset and ability to think critically. He has a knack for breaking down complex technical information into easily digestible pieces, making his articles engaging and accessible to readers from all backgrounds. In February 2022, he joined Tech4Gamers as a blog and product comparison writer, where he has been able to hone his skills further.
As a writer, Abdemanaf is dedicated to staying up-to-date with the latest technological advancements and trends, enabling him to provide readers with the most relevant and accurate information. He is always eager to learn more and is constantly seeking new challenges to improve his skills.
Get In Touch: manaf@tech4gamers.com


