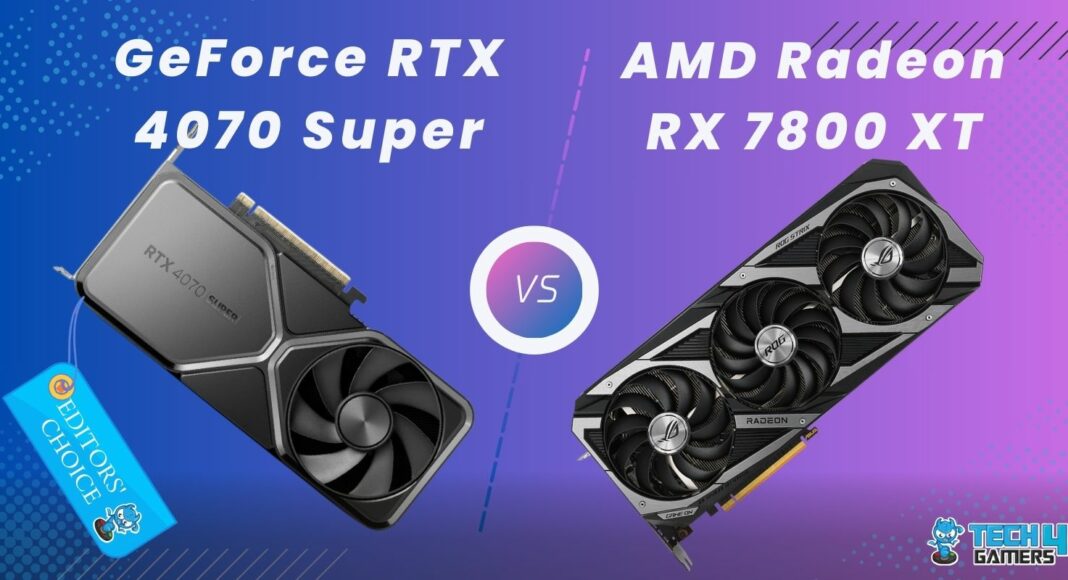
Nvidia GeForce RTX 4070 Super
Rated: 9.5/10
AMD Radeon RX 7800 XT
Rated: 9.3/10
Pros And Cons
| GPU | Pros | Cons |
|---|---|---|
| Nvidia RTX 4070 Super | ✅ Huge performance gains over standard RTX 4070 ✅ Fantastic DLSS 3.5 and ray tracing performance ✅ Highly Power Efficient | ❌ VRAM could be increased to 16GB ❌ 12VHPWR Adapter |
| AMD Radeon RX 7800 XT | ✅ Reasonable performance in budget ✅ Effective thermal management ✅ 16GB memory with high bandwidth | ❌ Lags in ray tracing and upscaling ❌ High power draw in terms of performance |
- In my 1440p gaming tests, the RTX 4070 Super outperformed the RX 7800 XT, providing an edge of about 10% and reaching up to 30% superiority in ray tracing capabilities.
- The RX 7800 XT uses roughly 20% more power than the RTX 4070 Super, whereas the RTX 4070 Super shows a 22.1% enhanced thermal efficiency.
- The current market prices of the RTX 4070 Super and the RX 7800 XT nearly correspond to their original MSRPs.
- I suggest considering the RTX 4070 Super for top-tier gaming performance and the RX 7800 XT with 16GB VRAM for budget-friendly gaming.
Comparison Table
| Feature | Nvidia GeForce RTX 4070 Super | AMD Radeon RX 7800 XT |
|---|---|---|
| Shading Units | 7168 CUDA Cores (CUDA Capability: 8.9) | 3840 (Stream Processors), 120 (AI accelerators) |
| Ray Tracing Cores | 56 | 60 |
| Base Clock | 1.98 GHz | 1.295 GHz |
| Boost Clock | Up to 2.48 GHz | Up to 2.43 GHz |
| Memory Bandwidth | Up to 504.2 GB/s | Up to 624.1 GB/s |
| TDP | 220W | 263W |
| Maximum GPU Temperature | 90°C | 92°C |
| Best CPU | Best CPU For RTX 4070 Super | Best CPU For RX 7800 XT |
| Best Variants | Best RTX 4070 Super Graphics Cards | Best RX 7800 XT Graphics Cards |
Architectural Difference
- Architecture: The RX 7800 XT features AMD’s latest RDNA 3.0 architecture, enhancing performance with AI acceleration and a Radiance Display Engine. In contrast, the RTX 4070 Super offers Nvidia’s avant-garde Ada Lovelace architecture.
- GPU Chip: AMD uses a Navi 32 chip in manufacturing the RX 7800 XT, while Nvidia deploys AD104 (AD104-350-A1) chip in the RTX 4070 Super. Both of these chips are crafted in an advanced 5nm fabrication technology at TSMC.
- VRAM: The RTX 4070 Super features a 192-bit 12GB GDDR6X memory with a 21.0 Gbps effective speed. In contrast, the RX 7800 XT boosts 256-bit 16GB GDDR6 memory with an effective speed of 19.5 Gbps.
- Clock Speed: Considering the clock frequencies, the RTX 4070 Super is more powerful, with a 52.9% faster base clock and a 2.1% better boost clock than the RX 7800 XT. Nonetheless, the RX 7800 XT boasts significantly better pixel and texture rates.
- Advanced Technologies: Regarding advanced technologies, the RTX 4070 Super brags NVIDIA DLSS 3.5 with Ray Reconstruction for superior ray-traced image quality. In contrast, the RX 7800 XT offers AMD’s avant-garde FSR 3.0 upscaling technology. To compare these upscaling technologies, read Nvidia DLSS vs AMD FSR.
The RTX 4070 Super is a mid-range GPU, showcasing the top of Nvidia’s innovative graphics technology with state-of-the-art features. In contrast, the RX 7800 XT is AMD’s premier graphics card, showcasing outstanding performance through cutting-edge technology and revolutionary features. Today, we will compare the RTX 4070 Super vs RX 7800 XT to determine the superior GPU for optimal performance.
Gaming Benchmarks
The gaming benchmarks are optimal metrics for evaluating graphics cards’ performance. To accurately compare the RTX 4070 Super vs RX 7800 XT, I conducted tests in ten graphically demanding games at 1440p resolution, playing 4 games with Ray Tracing enabled and 6 without enabling.
Test Bench
My gaming setup had the following specifications.
- OS: Windows 11
- CPU: Intel Core i7-13700K
- Motherboards: MSI MEG Z790 ACE MAX
- RAM: G.Skill Trident Z5 RGB 32GB DDR5-6600 CL34 Kit
- SSD: CORSAIR MP700 PRO 2TB Gen5 NVMe SSD Review
- PSU: Enermax Revolution D.F. X 1050W
- CPU Cooler: Corsair Hydro Series H150i Pro RGB Liquid CPU Cooler
Ray Tracing Off
Avatar: Frontiers of Pandora

- Kicking off my benchmarks with Avatar: Frontiers of Pandora, I saw that the RTX 4070 Super turned a 29.7% performance boost over the RX 7800 XT, averaging 96 FPS versus 74 FPS.
- Looking at the low 1% frame rates, the RTX 4070 Super again leads by delivering 66 FPS against the 55 FPS managed by the RX 7800 XT.
Microsoft Flight Simulator

- In Microsoft Flight Simulator, the RTX 4070 Super outperformed with 88 FPS, showcasing a notable 23.9% lead compared to the RX 7800 XT’s 71 FPS.
- At its lowest 1% performance, the RTX 4070 Super achieved 77 FPS, surpassing the RX 7800 XT, which managed 65 FPS.
Red Dead Redemption 2

- During my Red Dead Redemption 2 session, the RTX 4070 Super demonstrated a 6.4% performance advantage over the RX 7800 XT’s 110 FPS average by providing 117 FPS on average, showcasing its superiority.
- The RX 7800 XT outperformed the RTX 4070 Super at its lowest 1% performance in this gameplay, reaching 99 FPS compared to the latter’s 91 FPS.
Remnant 2

- While playing Remanat 2, the RTX 4070 Super demonstrated a 2.6% performance lead over the RX 7800 XT’s average of 77 FPS by achieving 79 FPS.
- At its worst 1% performance, the RX 7800 XT maintained 57 FPS, while the RTX 4070 Super lagged at 55 FPS.
Starfield

- In Starfield, the RTX 4070 Super showcased superior performance, achieving 72 FPS, a 4.3% advantage over the RX 7800 XT’s 69 FPS average.
- The RTX 4070 Super maintained an equivalent performance during the lowest 1%, providing 51 FPS, compared to the RX 7800 XT’s 50 FPS.
The Last of Us Part I

- During my The Last of Us Part I gameplay, the RTX 4070 Super outperformed the RX 7800 XT with a 2.3% lead, hitting 89 FPS compared to the RX 7800 XT’s 87 FPS average.
- At its lowest 1% performance, the RX 7800 XT achieved 70 FPS, showcasing its superiority over the RTX 4070 Super, which managed 60 FPS.
Ray Tracing On
Alan Wake 2

- Enabling the ray tracing in Alan Wake 2, the RTX 4070 Super outpaces the RX 7800 XT with a significant 28.9% lead, achieving 49 FPS compared to 38 FPS.
- During its low 1% performance moments, the RTX 4070 Super delivered 43 FPS, while the RX 7800 XT trailed behind at 32 FPS.
Cyberpunk 2077

- During Cyberpunk 2077, the RTX 4070 Super scored 73 FPS, showcasing a fantastic 52.1% boost over the RX 7800 XT’s 48 FPS.
- The RTX 4070 Super exhibited superior performance, maintaining 55 FPS during the lowest 1% gameplay, while the RX 7800 XT managed 39 FPS.
Forza Horizon 5

- While playing Remanat 2, the RTX 4070 Super demonstrated a substantial 16.8% lead over the RX 7800 XT’s performance of 137 FPS by achieving a beautiful average of 160 FPS.
- At its poorest 1% performance, the RTX 4070 Super maintained 140 FPS, overreaching the RX 7800 XT’s performance of 121 FPS.
Hogwarts Legacy

- In my last session of Hogwarts Legacy, the RTX 4070 Super surpassed the RX 7800 XT with a great margin of 57.1%. The RTX 4070 Super supplied a splendid 55 FPS on average, while the RX 7800 XT produced 35 FPS on average.
- During the worst 1% performance time of this game, the RX 7800 XT managed 27 FPS, whereas the RTX 4070 Super delivered an amazing 44 FPS.
I favour the RTX 4070 Super for its superb gaming performance at both 1440p and 4K, surpassing the RX 7800 XT by a wide margin in ray tracing capabilities. In contrast, the RX 7800 XT is a $100 cheaper GPU than the RTX 4070 Super. Check out the comparison of the RX 7800 XT with the RXT 4070.
– Shehryar Khan
Overall Gaming Performance
Here, we’ll make a separate analysis of the gaming experience, focusing on the overall performance difference of the RTX 4070 Super vs RX 7800 XT utilizing ray tracing and not.
Without Ray Tracing

Average Frame Rate
In my evaluations of the gaming performance of the RTX 4070 Super vs RX 7800 XT without ray tracing, the RTX 4070 Super demonstrated better performance, exhibiting an approximately 10.9% advantage over the RX 7800 XT. The RTX 4070 Super demonstrated its superiority with an average frame rate of 90.2 FPS, outperforming the RX 7800 XT, which processed a lower frame rate of roughly 81.3 FPS.
Low 1% Frame Rate
During periods of lowest performance, the RX 7800 XT delivered a frame rate of 66.0 FPS, while the RTX 4070 Super averaged a frame rate of 66.7 FPS. Therefore, both graphics cards’ low 1% performance was comparable in games without ray tracing.
With Ray Tracing

Average Frame Rate
During my gaming sessions where I used ray tracing technology, I noticed a considerable difference in performance between the RTX 4070 Super and the RX 7800 XT. The RTX 4070 Super defeated the RX 7800 XT by a significant lead of 30.5%. The RX 7800 XT achieved an average frame rate of around 64.5 FPS, while the RTX 4070 Super consistently maintained a higher average of 84.2 FPS.
Low 1% Frame Rate
During my gaming tests with ray tracing enabled, I found that the RTX 4070 Super surpassed the RX 7800 XT by around 28.6% in the worst 1% performance times. The RX 7800 XT managed 54.8 FPS on average in the low 1%, whereas the RTX 4070 Super maintained a more impressive average of 70.5 FPS.
After analysis of my gaming test results, it is evident that the RTX 4070 Super has much better ray tracing skills than the RX 7800 XT. So, using Nvidia graphics cards for ray tracing games and applications is particularly advisable.
Gaming Power Consumption
Game Nvidia RTX 4070 S (W) AMD RX 7800 XT (W)
Avatar: Frontiers of Pandora 221 254
Microsoft Flight Simulator 218 273
Red Dead Redemption 2 216 245
Remnant 2 215 258
Starfield 198 254
The Last of Us Part I 207 249
Alan Wake 2 223 247
Cyberpunk 2077 212 244
Forza Horizon 5 185 223
Hogwarts Legacy 204 271
Average Power Draw 209.9 251.8
Winner: Nvidia RTX 4070 Super
Gaming Temperatures
Game Nvidia RTX 4070 S (°C) AMD RX 7800 XT (°C)
Avatar: Frontiers of Pandora 60 49
Microsoft Flight Simulator 61 51
Red Dead Redemption 2 57 48
Remnant 2 61 48
Starfield 59 47
The Last of Us Part I 62 49
Alan Wake 2 58 50
Cyberpunk 2077 60 47
Forza Horizon 5 59 48
Hogwarts Legacy 60 52
Average Temperature 59.7 48.9
Winner: AMD Radeon RX 7800 XT
Price And Availability
| Graphics Card | MSRP | Current Price |
|---|---|---|
| GeForce RTX 4070 Super | 💲599 | 💲599 |
| Radeon RX 7800 XT | 💲499 | 💲499 |
| Price Difference | 20.0% | 20.0% |
Final Verdict – What Do I Recommend?
Nvidia GeForce RTX 4070 Super: The RTX 4070 Super shines in gaming and ray tracing, boasting remarkable performance. With the latest DLSS 3.5 upgrade, it offers outstanding speed and efficiency. Moreover, its enhanced power efficiency translates to reduced electricity expenses, making it an economical choice for long-term use.
AMD Radeon RX 7800 XT: The RX 7800 XT is a premier graphics card by AMD, boasting exceptional performance tailored for gaming at 1080p and 1440p resolutions. Additionally, its substantial 16GB GDDR6 memory significantly enhances its overall worth.
Finally, when it comes to GPU selection, the most important factors you should consider are performance, price and running cost in terms of power usage. If affordable, the RTX 4070 Super offers great value. Otherwise, you have an option of the RX 7800 XT.
More From RX 7800 XT:
Thank you! Please share your positive feedback. 🔋
How could we improve this post? Please Help us. 😔
[Comparisons Expert]
Shehryar Khan, a seasoned PC hardware expert, brings over three years of extensive experience and a deep passion for the world of technology. With a love for building PCs and a genuine enthusiasm for exploring the latest advancements in components, his expertise shines through his work and dedication towards this field. Currently, Shehryar is rocking a custom loop setup for his built.
Get In Touch: shehryar@tech4gamers.com


![AIO Vs Custom Loop Liquid Cooling [Explained] AIO vs Custom Loop Liquid Cooling](https://tech4gamers.com/wp-content/uploads/2022/11/AIO-vs-Custom-Loop-Liquid-Cooling-218x150.jpg)
Feedback By:
Ava
James