 Threads
Strong Value Contender!
Review Summary
The AMD Ryzen 5 3600 is a commendable mid-range CPU with 6 cores and 12 threads, excelling in budget gaming and multitasking with its 3.6 GHz base and 4.2 GHz boost clock. It competes well against Intel’s i7 8700k and i5 9600k in gaming benchmarks, though 16 PCIe lanes limit it, and it comes with a sufficient yet basic Wraith Stealth Cooler. It’s a strong choice for those seeking performance and value, especially in gaming, but with some considerations for expansion and cooling needs.

Overall
-
Performance - 8/10
8/10
-
Value - 9/10
9/10
-
Efficiency - 8/10
8/10
-
Design - 8/10
8/10
Pros
- Excellent Price-to-Performance Ratio
- Strong Multi-Core Performance
- High Clock Speeds
- Advanced Zen 2 Architecture
- Support for PCIe 4.0
- Good Overclocking Potential
- Includes Wraith Stealth Cooler
Cons
- No Integrated Graphics
- Limited PCIe Lanes
- Basic Bundled Cooler for Overclocking
- Requires X570 Motherboard for Full PCIe 4.0 Support
- May Require Additional Cooling for Intensive Tasks


We got our hands on the AMD Ryzen 5 3600 reviewed CPU and will be taking a spin on it to evaluate its performance. Regarding the budget segment of the market, AMD always brings more juice to the fruit than it can produce. They have been doing that quite well and did not disappoint this time. Under $199, they have brought an interesting proposition for budget gamers and users: AMD Ryzen 5 3600 CPU. Let’s test it out!
Key Takeaways
- The AMD Ryzen 5 3600 is a 6-core, 12-thread mid-range desktop CPU with a base clock of 3.6 GHz and a boost up to 4.2 GHz, using AMD’s Zen 2 architecture.
- This processor is designed for users looking for a distinct design, more powerful cores and threads, improved DRAM scalability, and a dedicated cooler.
- This processor is not meant for users who want to avoid limited PCIe lanes, want an IGPU, and wish to buy a powerful cooler bundled with the processor.
- Why you can trust Tech4Gamers: Our reviews are based on dedicated hands-on testing by our team of experienced hardware experts. Find out more about how we test.
Specifications
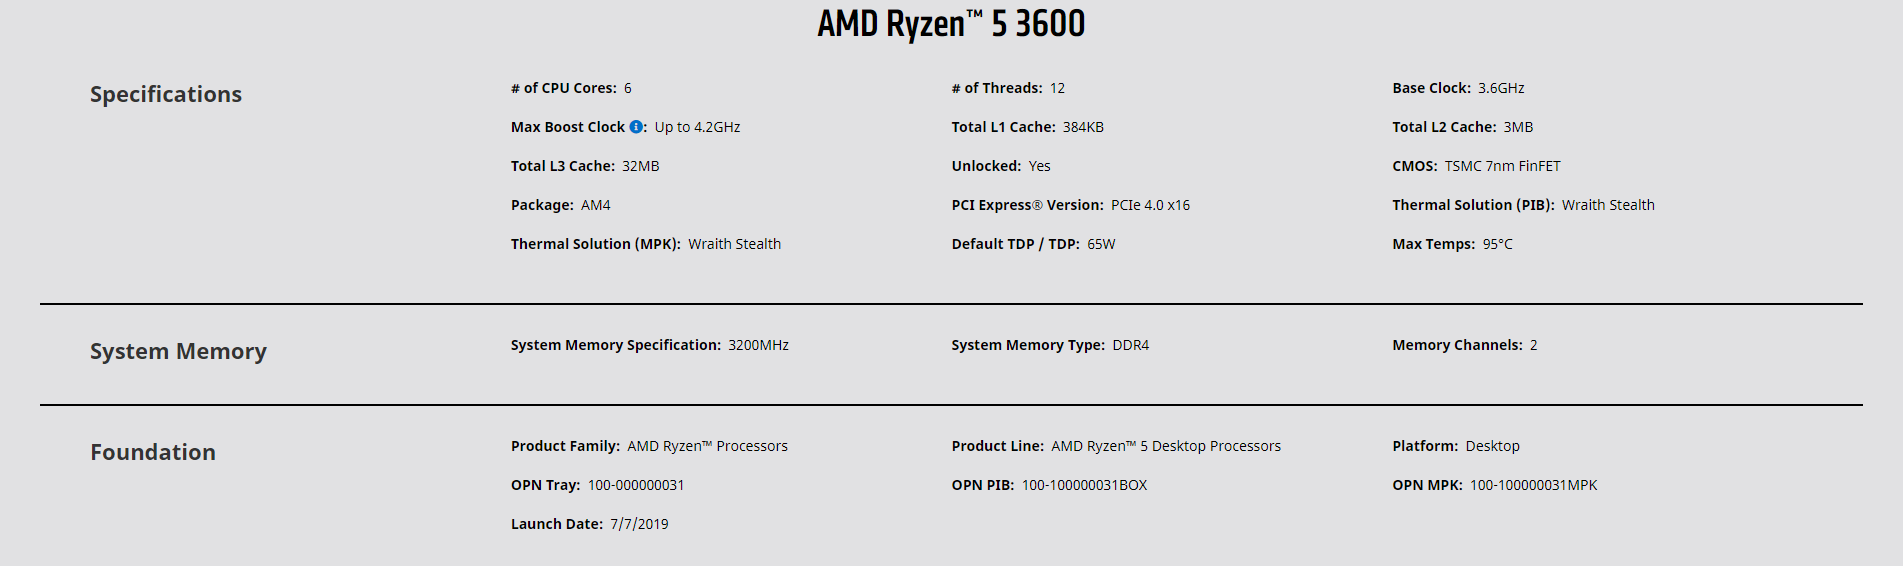
As the name indicates, this chip is a scaled-down version of their mid-range powerful chip 3600X. The AMD Ryzen 5 3600 review packs 6 cores and 12 threads. There is more to it than meets the eye regarding $200 CPU.
Here is a quick rundown of the comparison of these chips:
| AMD Ryzen 5 3600 | Intel i5 9500 | Intel i5 9400 | |
| Base Clock (MHz) | 3600 | 3000 | 2900 |
| Boost Clock (MHz) | 4200 (only one core) | 4400 (single-core) | 4100 (single-core) |
| Memory Channel | Dual | Dual | Dual |
| Memory Support | DDR4-3200 | DDR4-2666 | DDR4-2666 |
| Fabrication | 7nm | 14nm | 14nm |
| Socket | AM4 | LGA-1151 | LGA-1151 |
| TDP | 65W | 95W | 65W |
| No of Cores | 6 | 6 | 6 |
| No of Threads | 12 | 6 | 6 |
| Integrated Graphics | No | Intel UHD Graphics 630 | Intel UHD Graphics 630 |
| L2 Cache | 3MB (Total) | 6x256KB | 6x256KB |
| L3 Cache | 32MB (Total) | 9 MB | 9MB |
| PCIe Version | Gen 4.0 | Gen 3.0 | Gen 3.0 |
| Thermal Junction | 95°C | 100°C | 100°C |
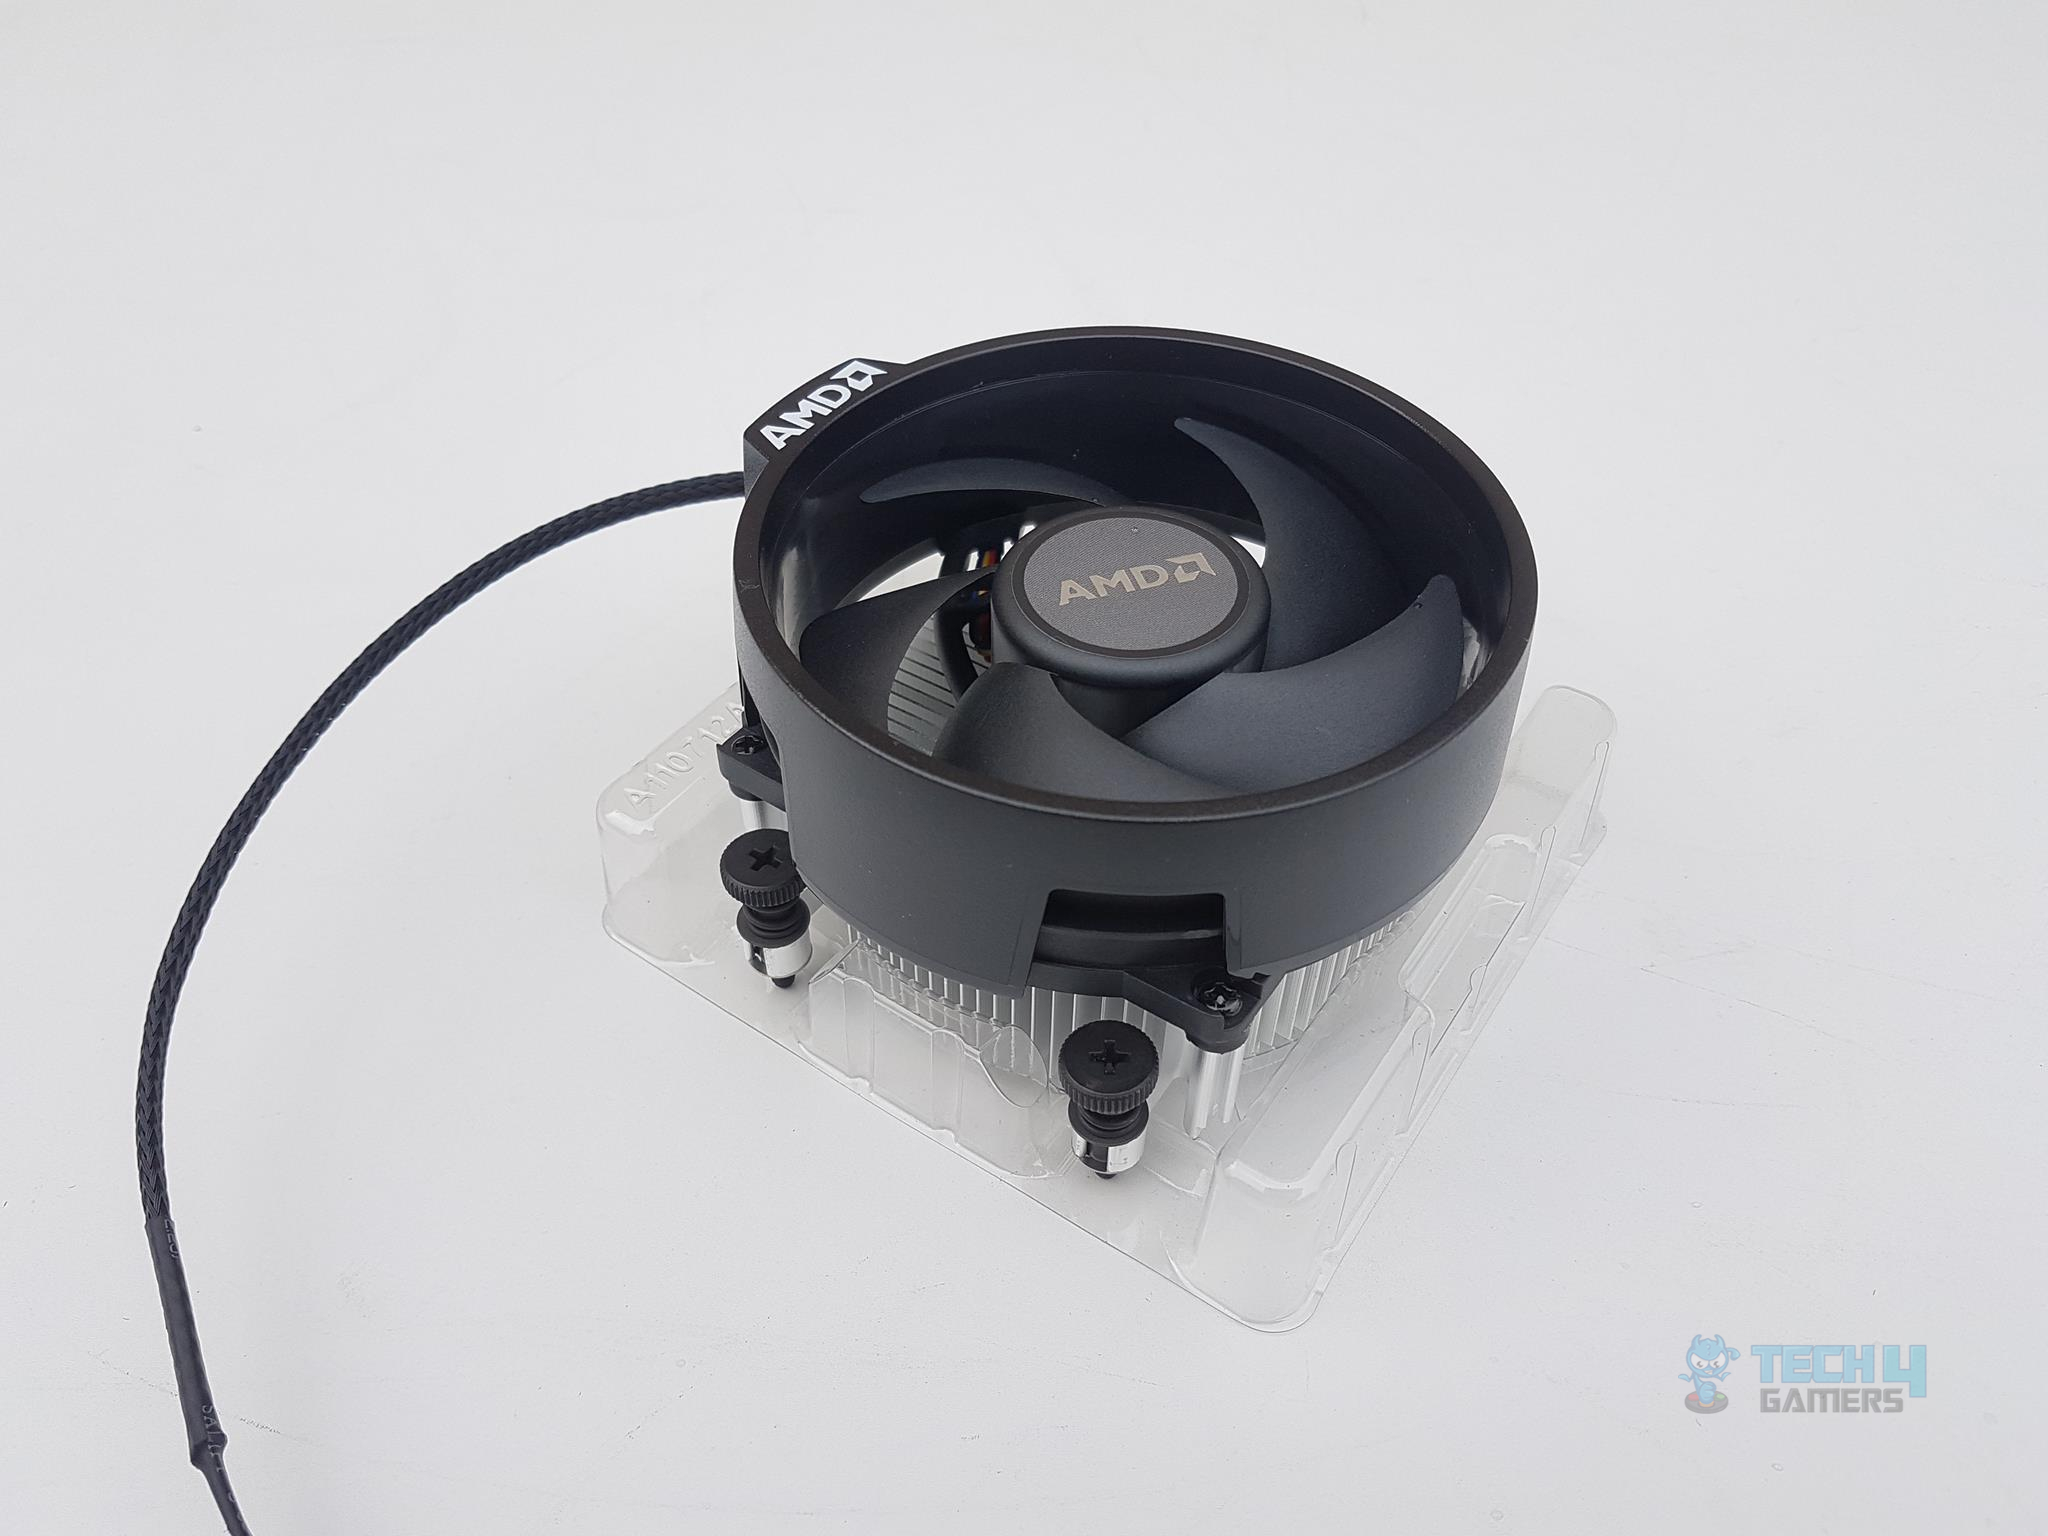
| Thermal Solution | Wraith Stealth | Intel Stock Cooler | Intel Stock Cooler |
| Price US$ | $199.99 | $204 | $182 |
The AMD Ryzen 5 3600, with SMT enabled, boasts a higher base clock than its Intel counterparts, larger cache capacities, and DDR4 3200MHz support. Its included Wraith Stealth cooler outperforms Intel’s stock coolers. With access to 24 PCIe 4.0 lanes, overclocking capability, and Precision Boost Overdrive recommended, it excels in daily use. For PCIe Gen 4.0 support, pair it with an AMD X570 motherboard for extensive I/O connectivity.
Here is a table showing the supported DDR4 speeds based on the populated DIMM slots configuration:
| No of DIMM | Rank | Supported Speed |
| 2×2 | Single | 3200 |
| 2×4 | Single | 3200 |
| 4×4 | Single | 2933 |
| 2×2 | Dual | 3200 |
| 2×4 | Dual | 3200 |
| 4×4 | Dual | 2667 |
We have seen the specifications and the proposition. It is time to test the CPU to evaluate its performance caliber.
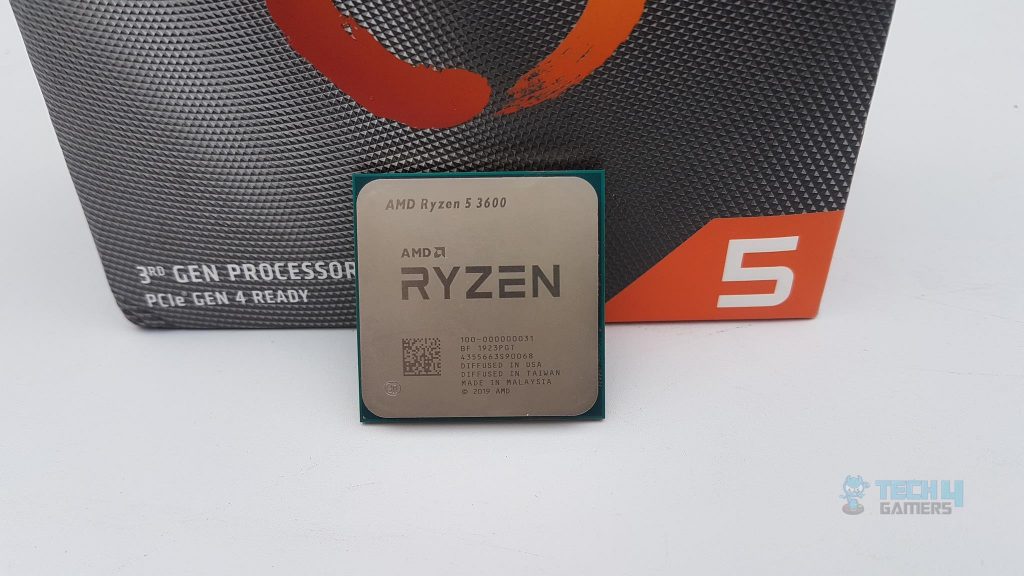
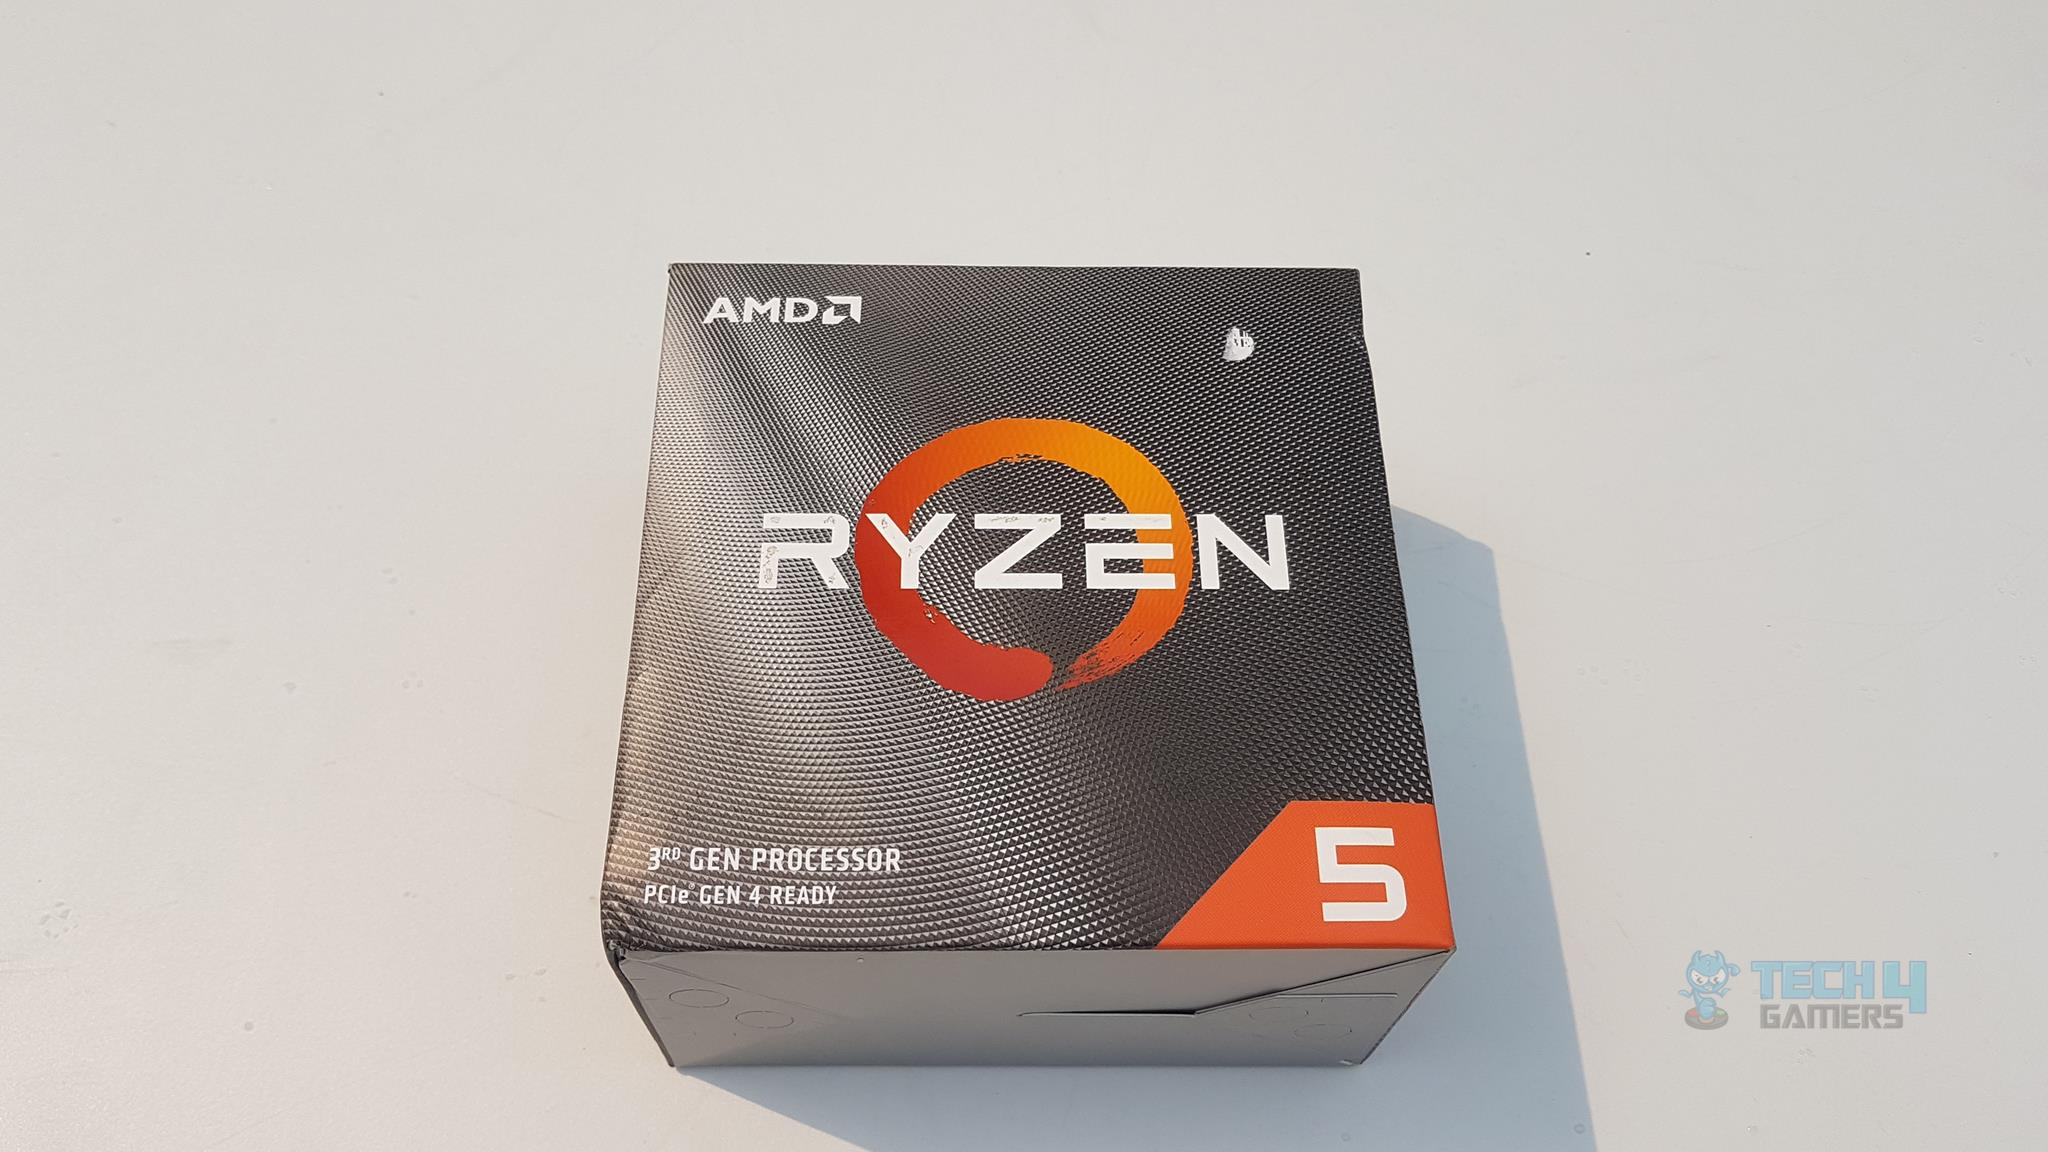
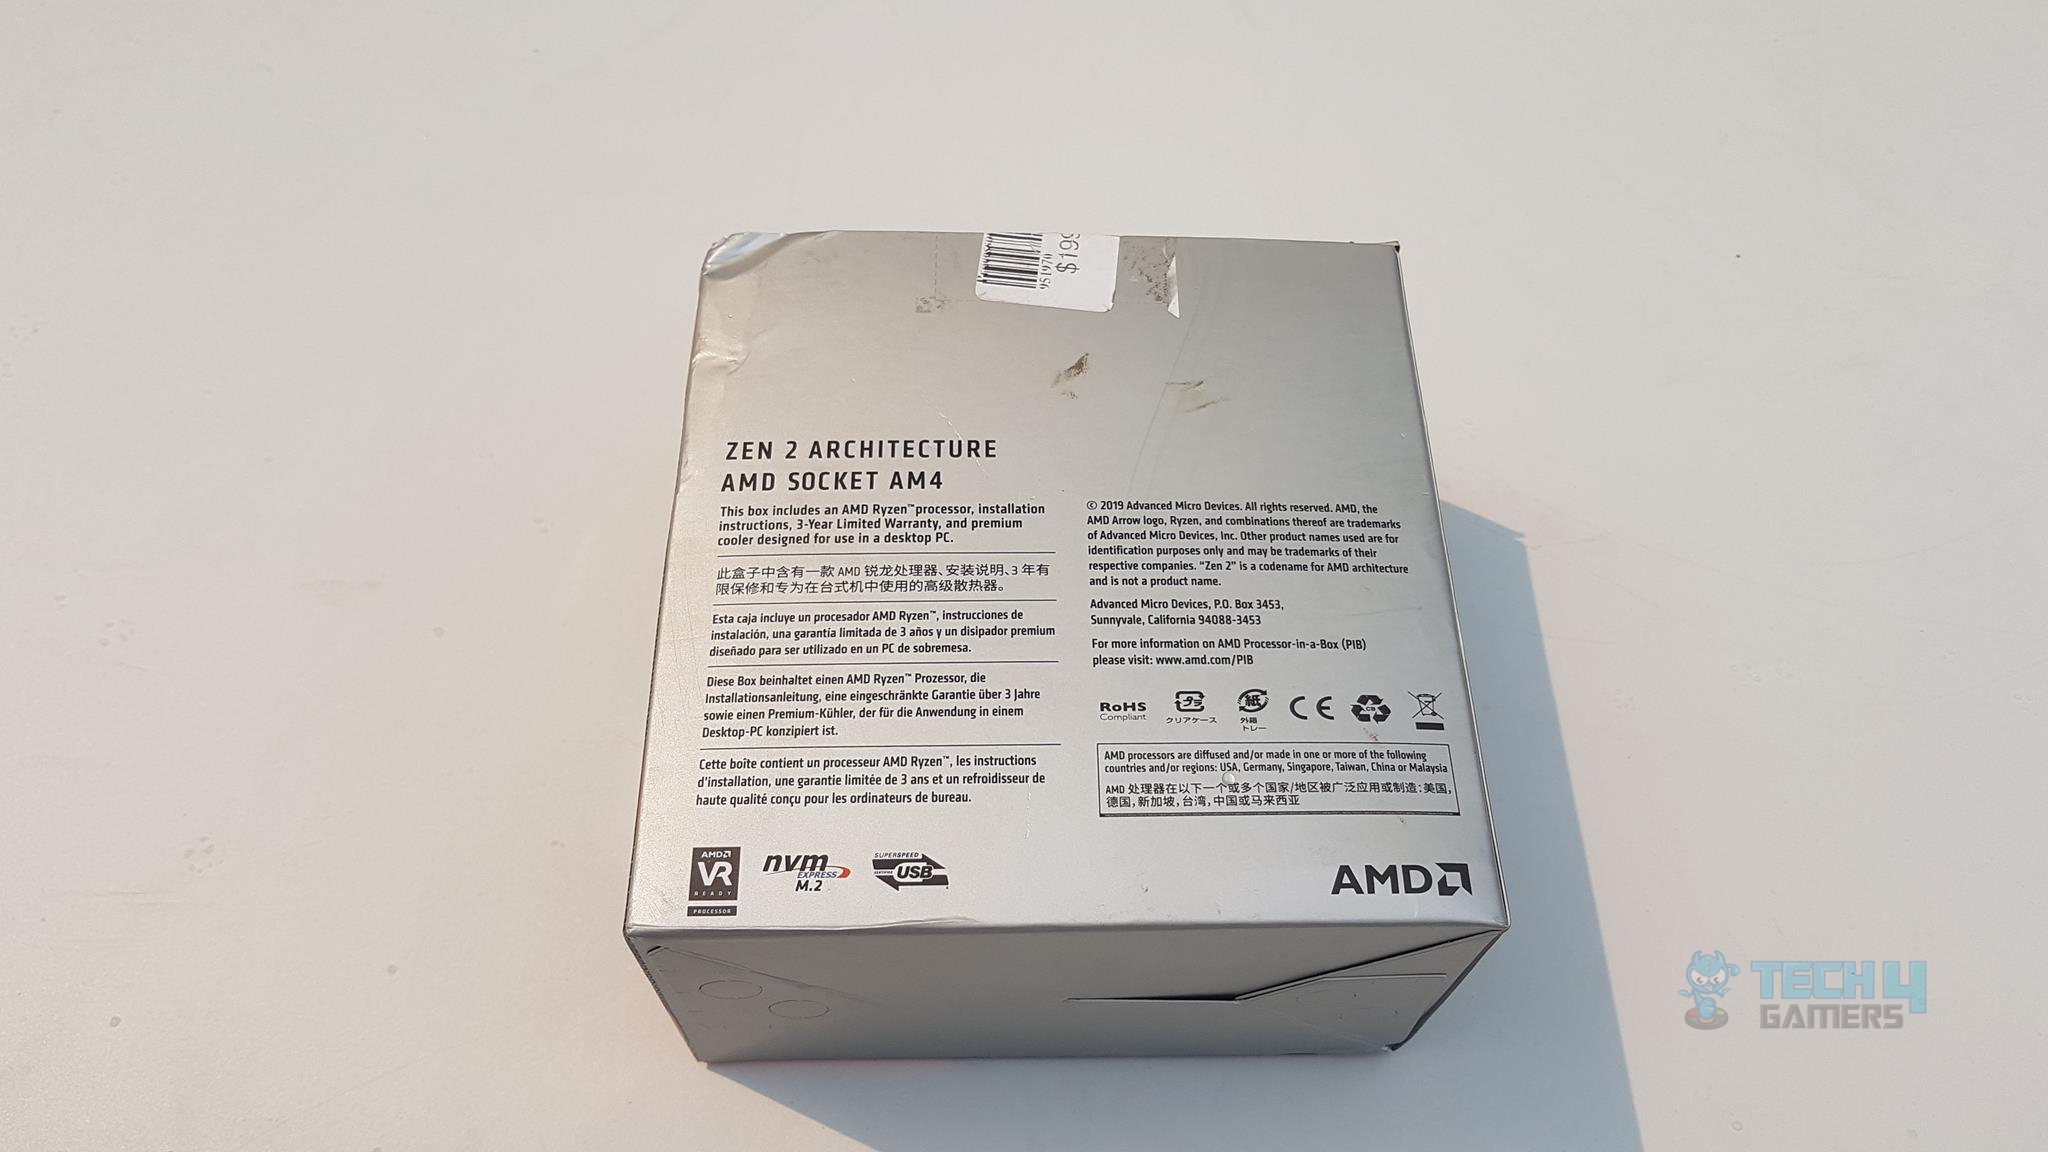
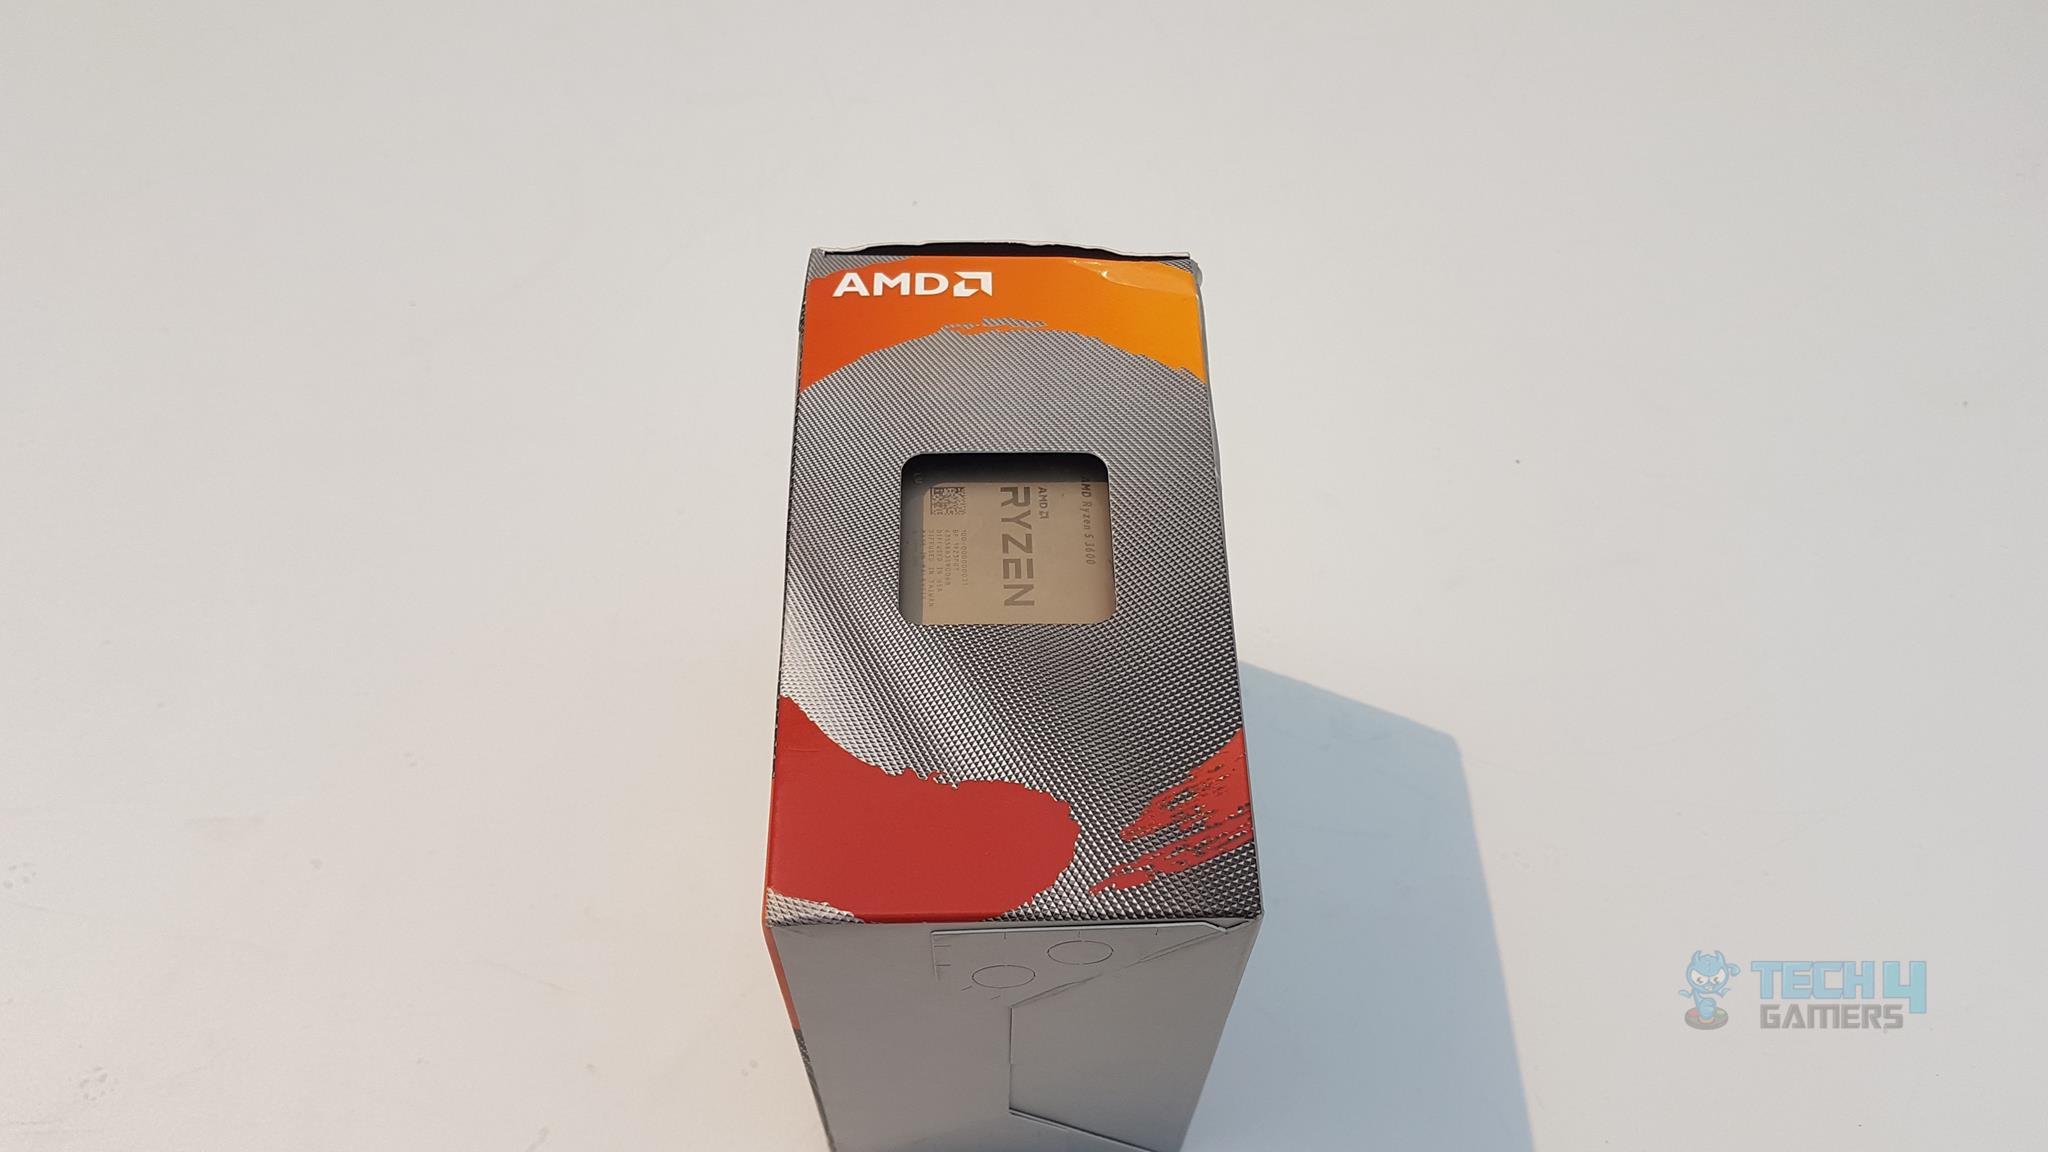
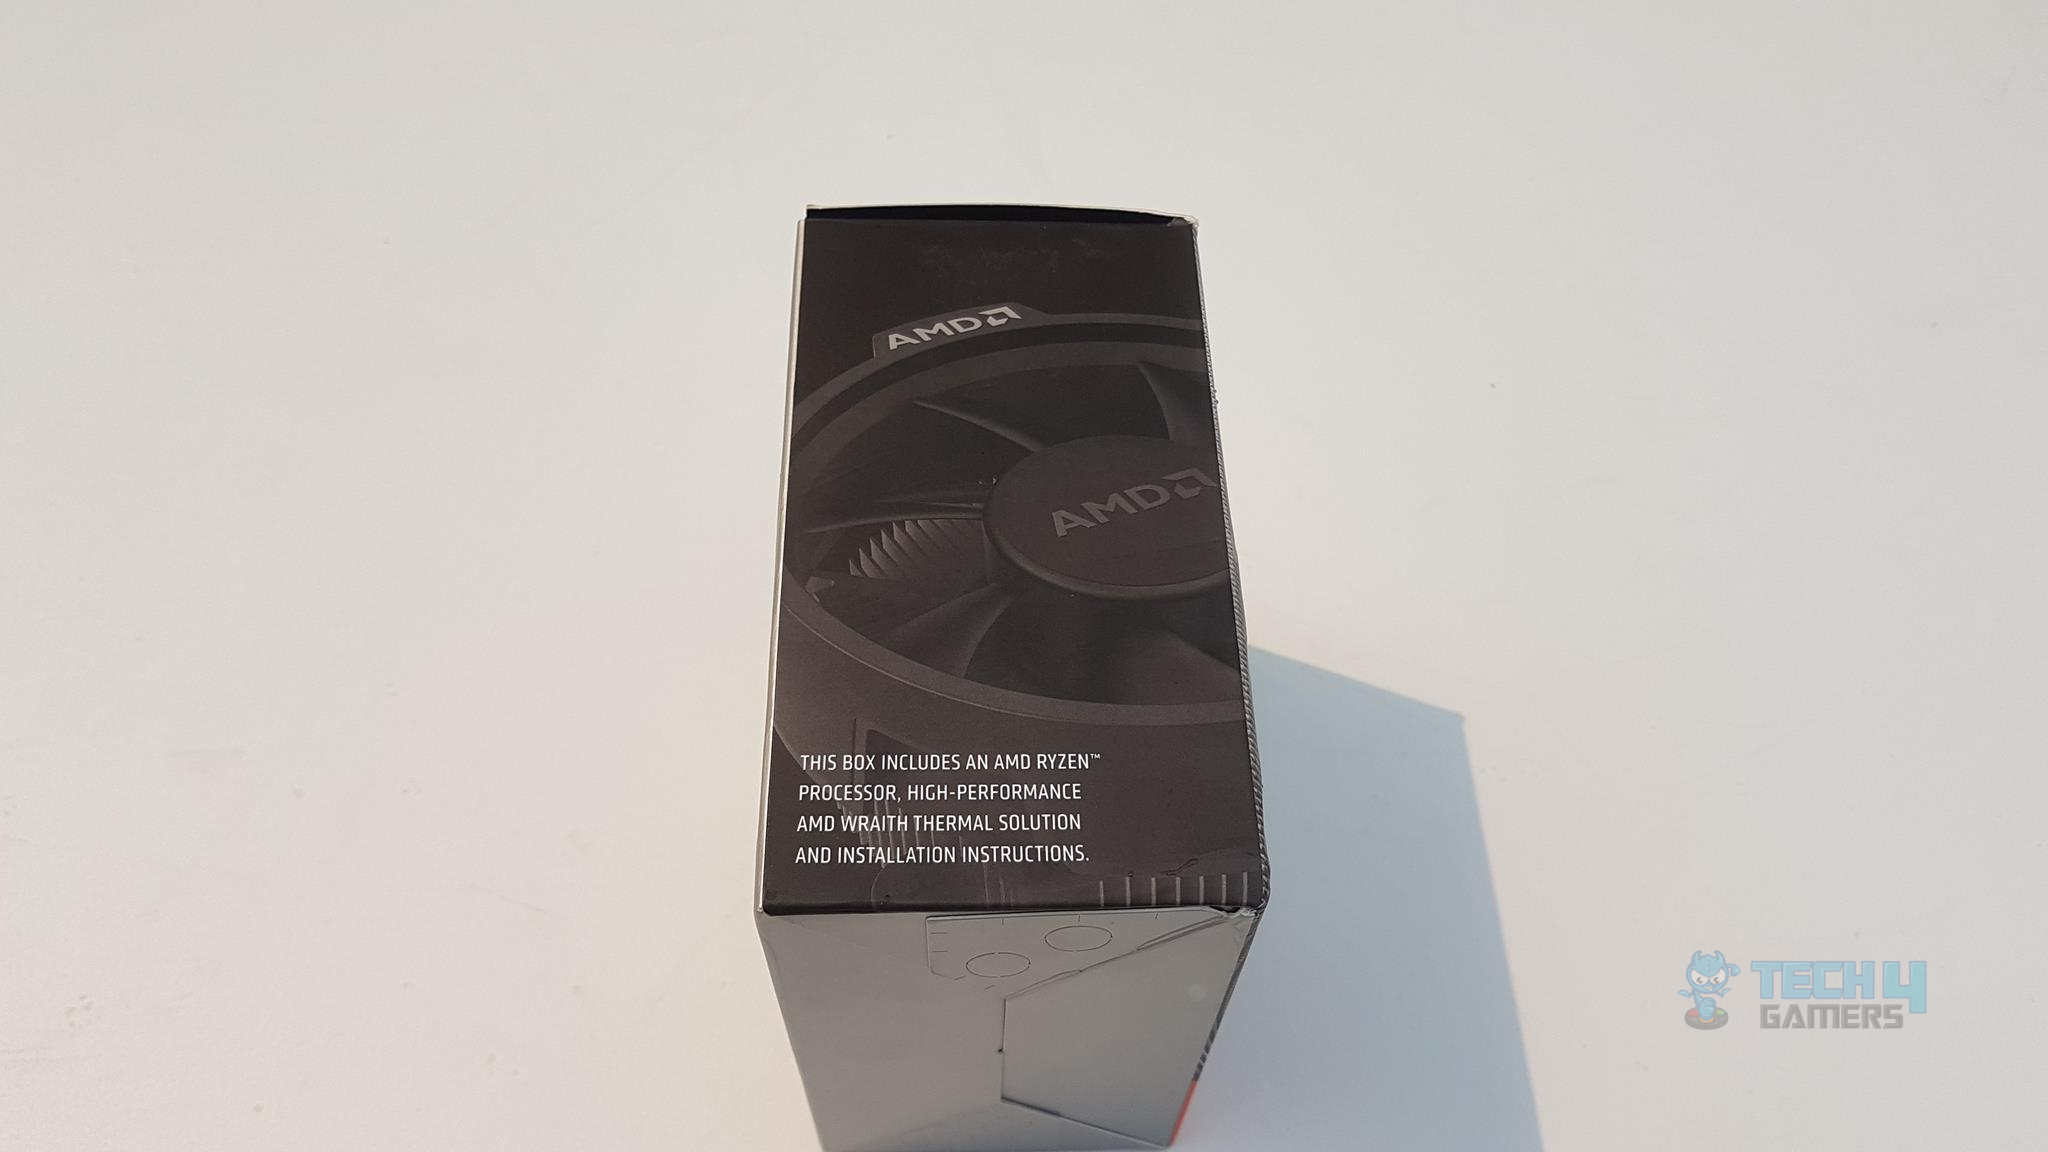
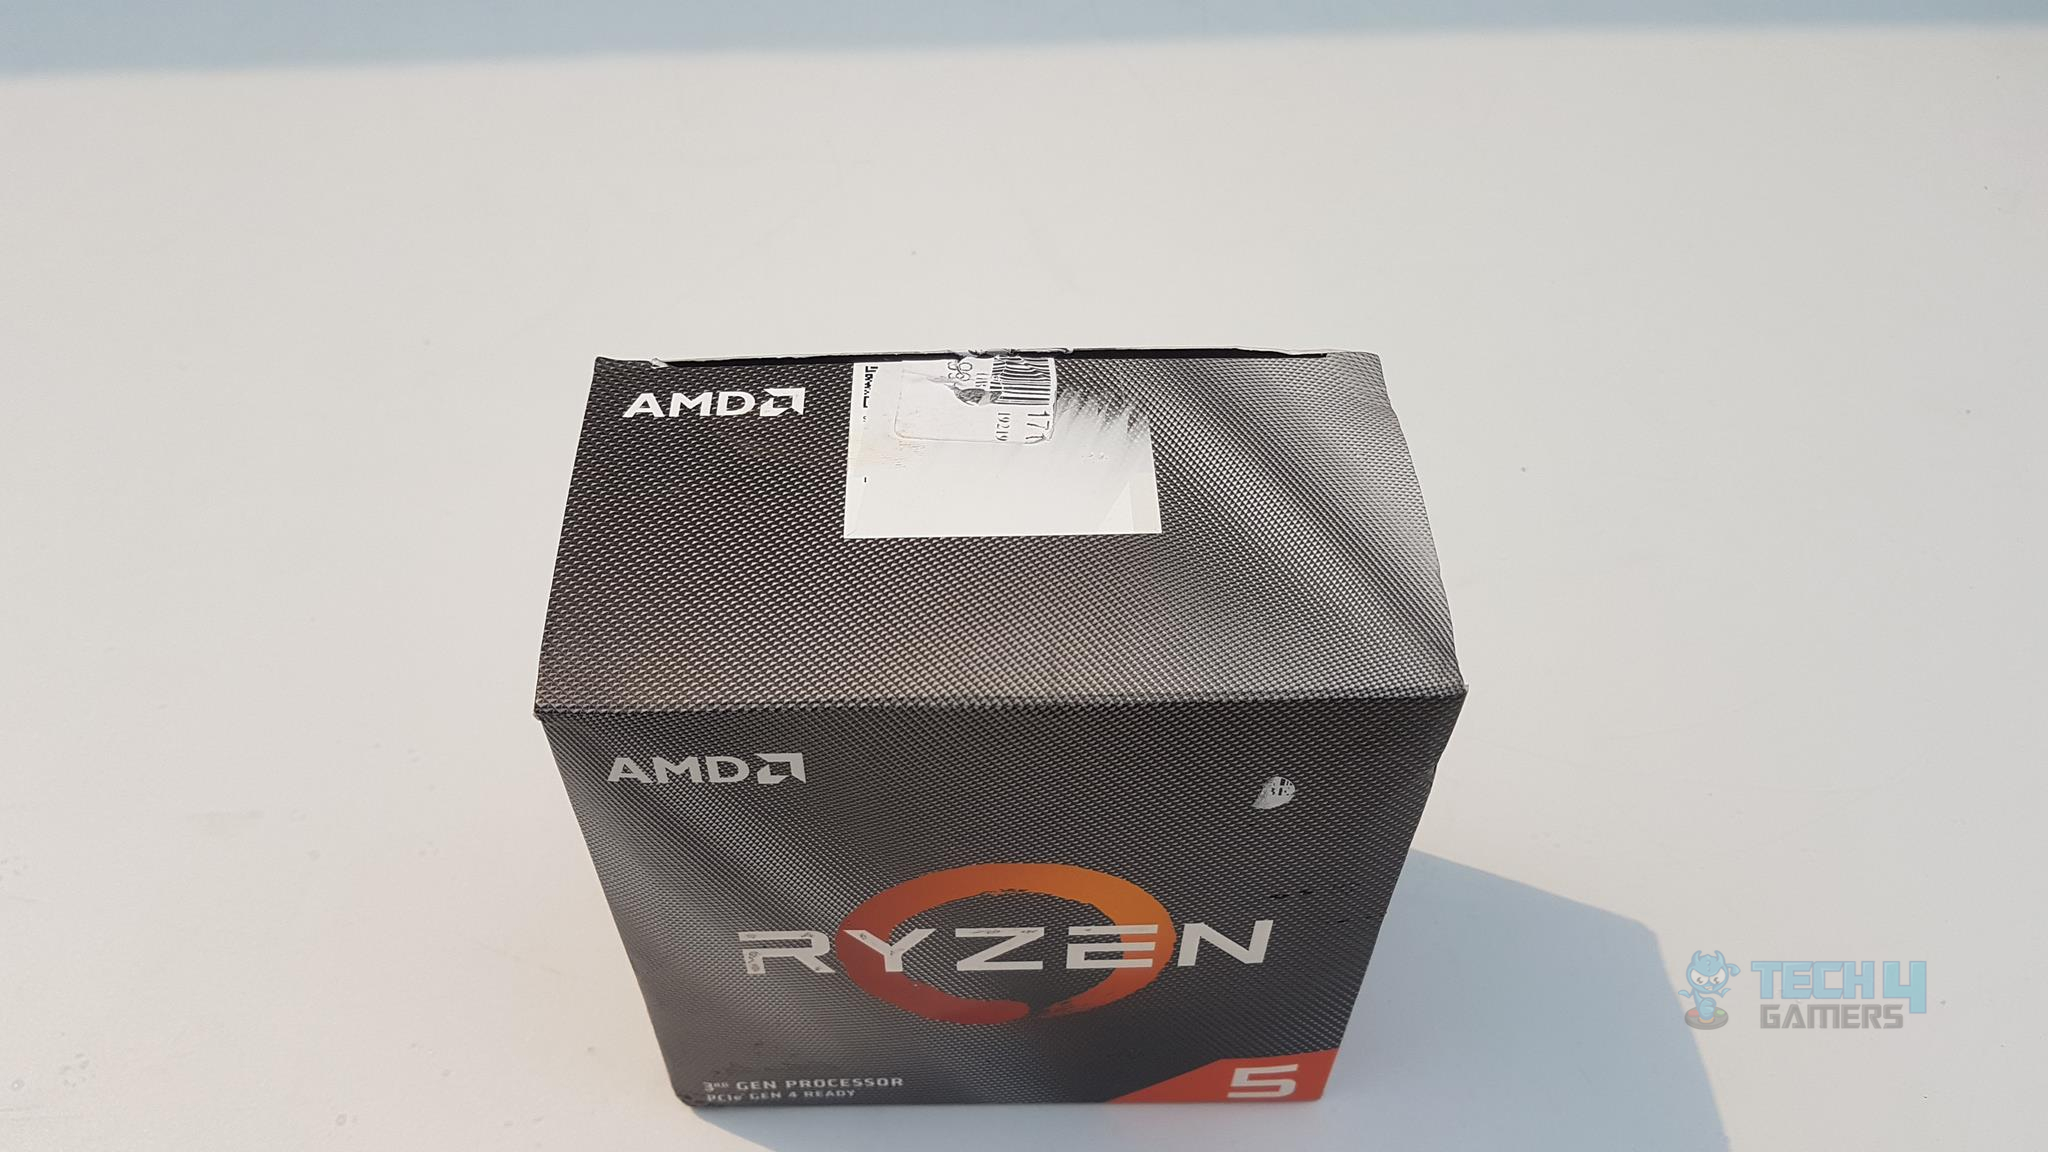
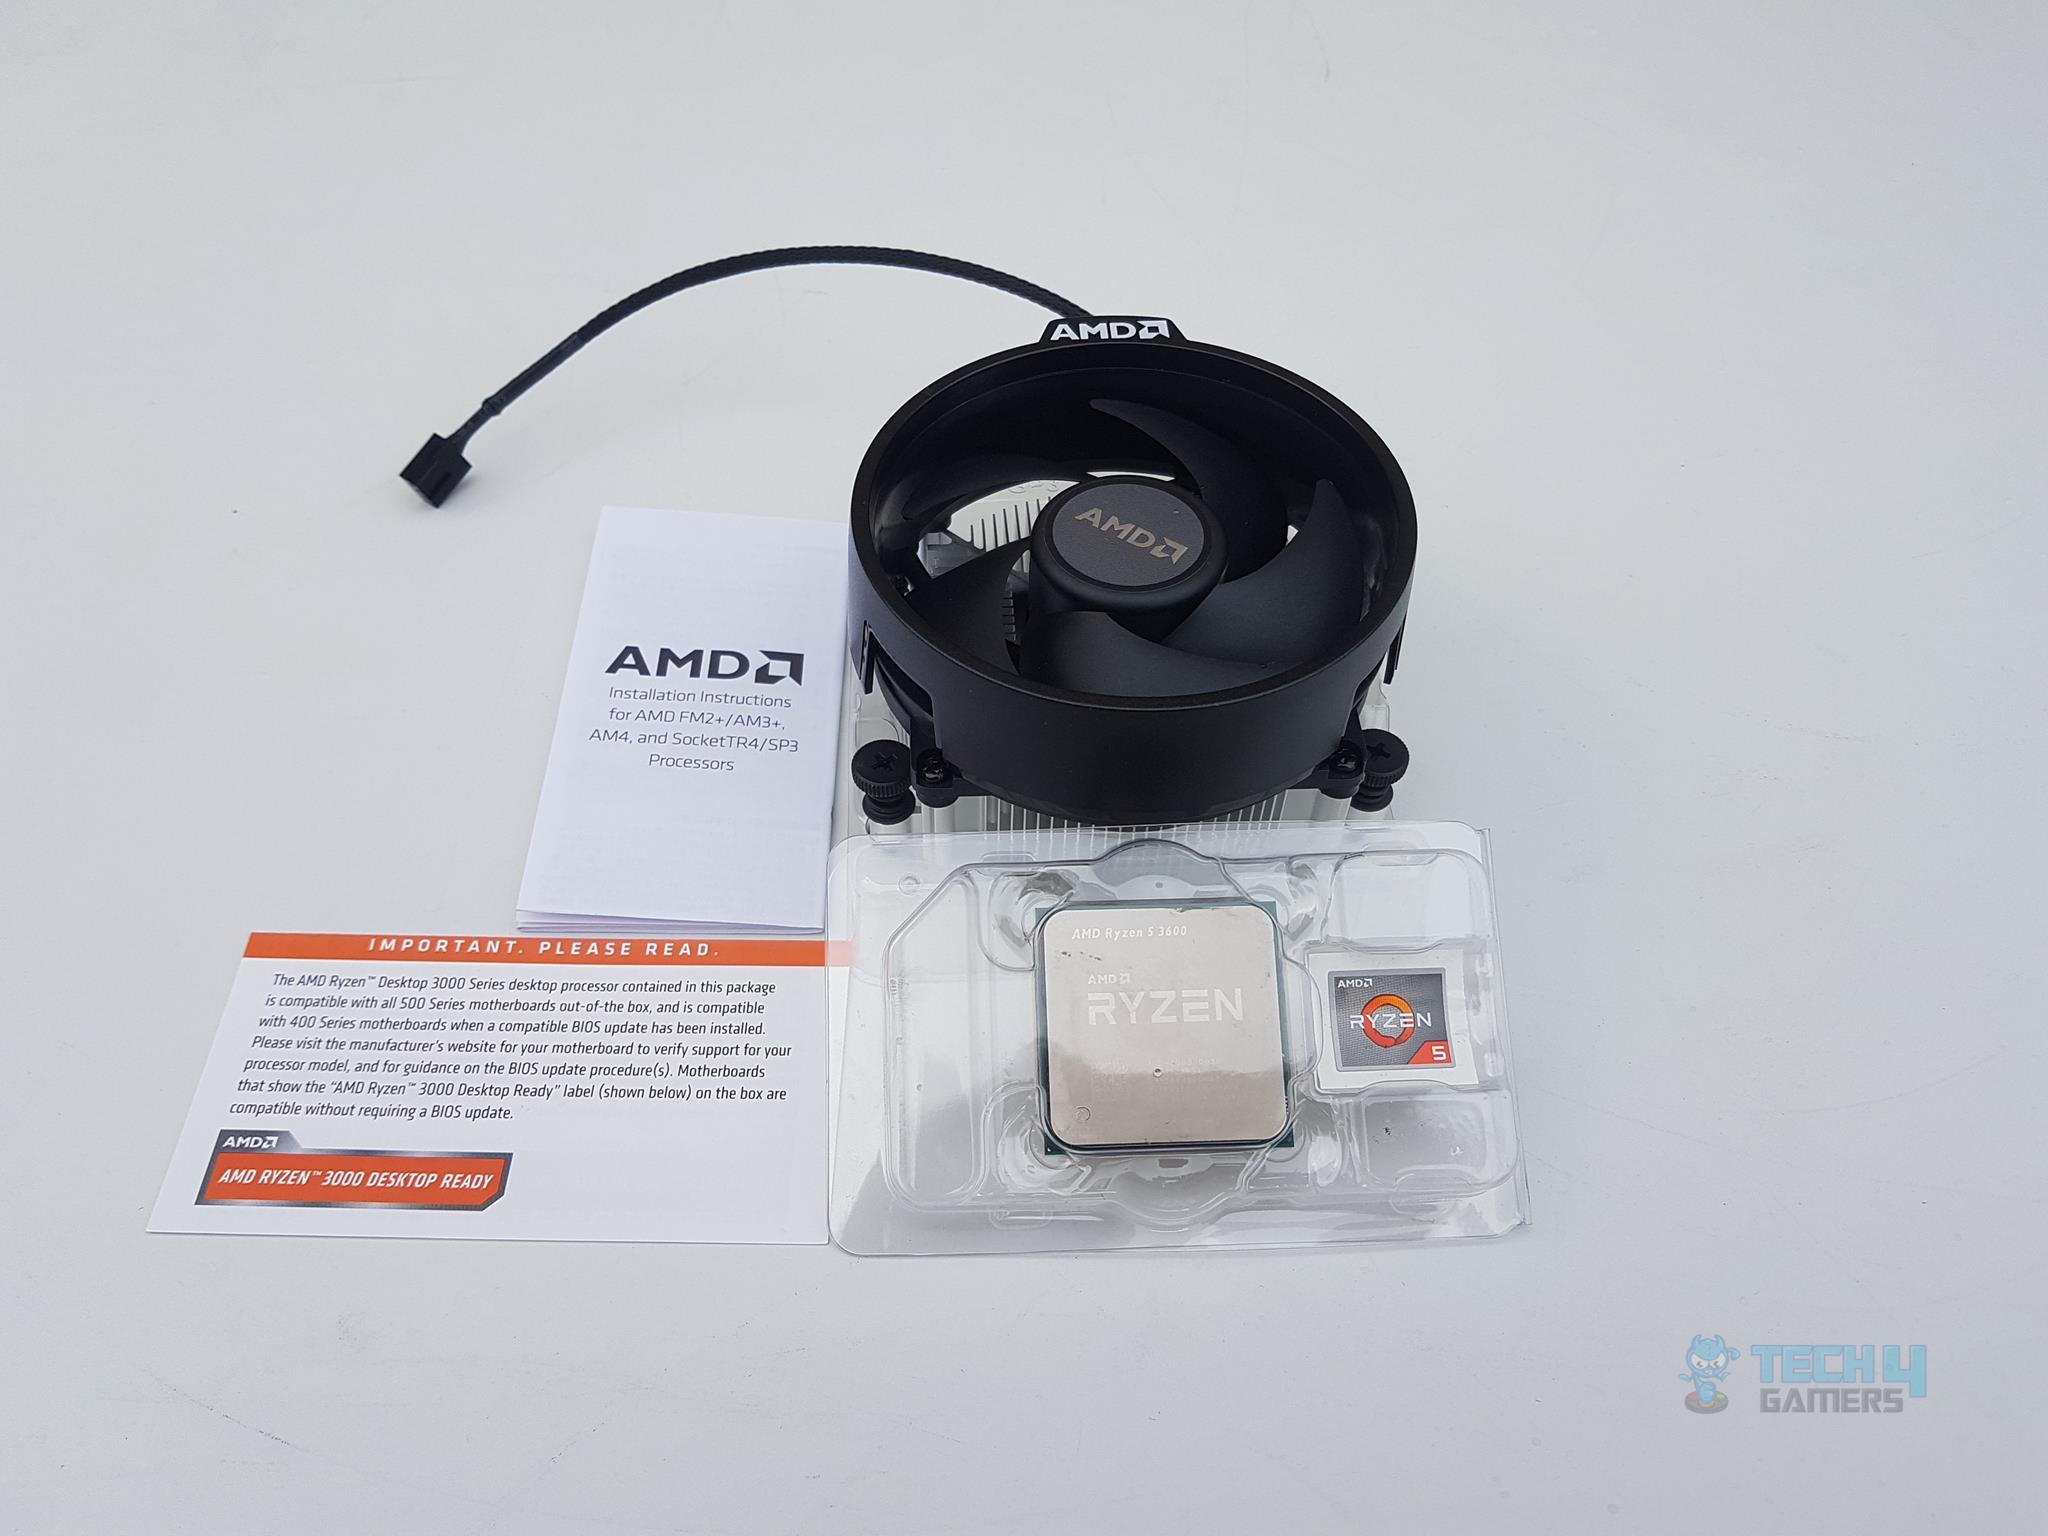
Packaging and Unboxing
The CPU is shipped inside the paperboard box along with the cooler.
Testing
Following is the configuration of the test benches used for this content.
Intel Z390
- Intel i5 9600k
- Ballistix Elite 16GB @ 3000MHz
- Asus Strix Z390-E Gaming Motherboard
- Asus Ryujin 360 CPU Cooler
- Asus GeForce RTX 2080 O8G
- HyperX 120GB SSD
- Seagate Barracuda 2TB
- Thermaltake ToughPower RGB 750 Gold-rated PSU
Intel Z370
- Intel i7 8700k
- Ballistix Elite 16GB @ 3000MHz
- Gigabyte Ultra Durable Z370-HD3
- Asus Ryujin 360 CPU Cooler
- Asus GeForce RTX 2080 O8G
- HyperX 120GB SSD
- Seagate Barracuda 2TB
- Thermaltake ToughPower RGB 750 Gold-rated PSU
AMD X470
- Ballistix Elite 16GB @ 3000MHz
- Corsair Vengeance RGB 16GB @ 3200MHz
- Asus Ryujin 360 CPU Cooler
- Asus GeForce RTX 2080 O8G
- HyperX 120GB SSD
- Seagate Barracuda 2TB
- Antec HCP1300 PSU
- Primochill Praxis Wetbench
I have tried to use the same components for all three test setups where possible. An exception is from the motherboards, which is obvious, and the PSUs.
Special note to thank our sponsors for the AMD test bench setup: AMD, Asus, Antec, Corsair, PCFanatics, and Easetec Pakistan.
Methodology
The following was ensured for each test:
- Tests on stock settings, default BIOS options, and Auto settings
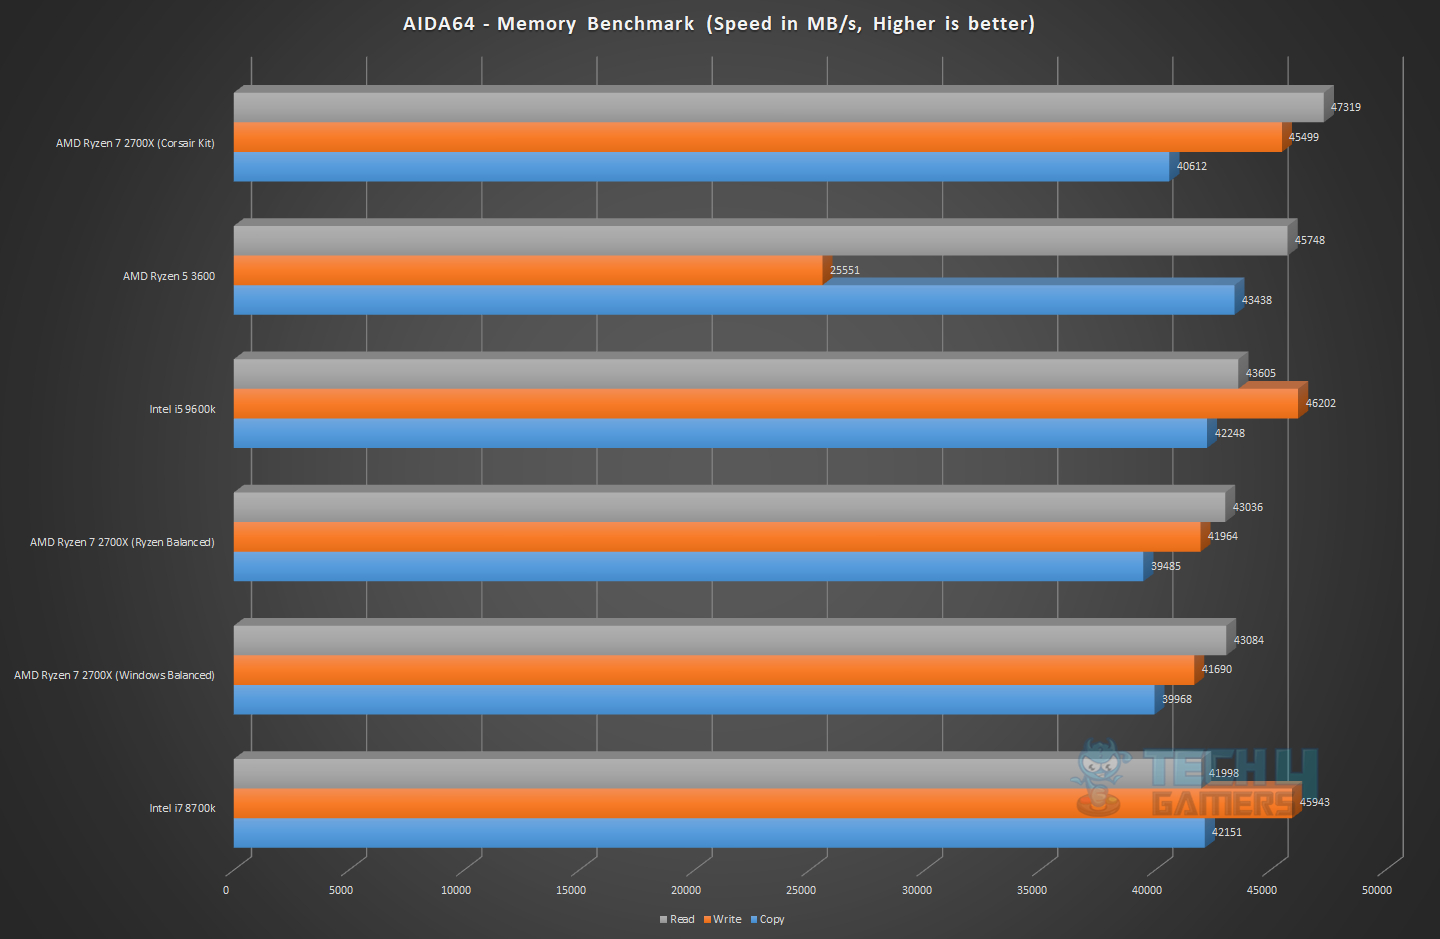
- Ballistix Elite DDR4 kit for all platforms, Corsair kit for AMD (used with AIDA64 Memory benchmark)
- Voltages left at Auto, AIO pump, and fans at 100%
- Games benchmarked at stock clocks
- Overclocking: i5 9600k and i7 8700k at 5.0GHz, Ryzen 7 2700x at 4.2GHz, Ryzen 5 3600 with PBO and 4.05GHz manual overclock
- The graphics card malfunctioned, so I used GTX 1080 for gaming performance tests.
- Windows x64 version 1903, BIOS updated, Nvidia drivers 417.71 (Ryzen 7 2700, i5 9600k, i7 8700k) and 431.60 (Ryzen 5 3600)
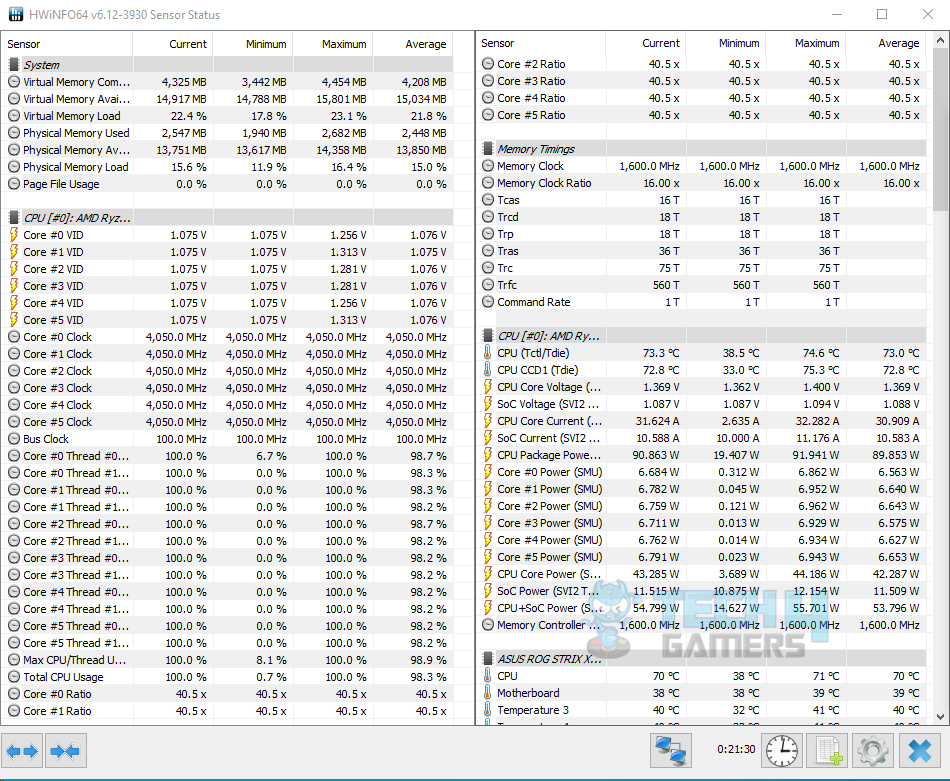
- HWinfo64 for monitoring
- AMD test bench used Windows Balanced profile, Cool n Quiet disabled during manual overclocking on AMD
- Games tested at max settings and 720p for CPU-bound performance estimation
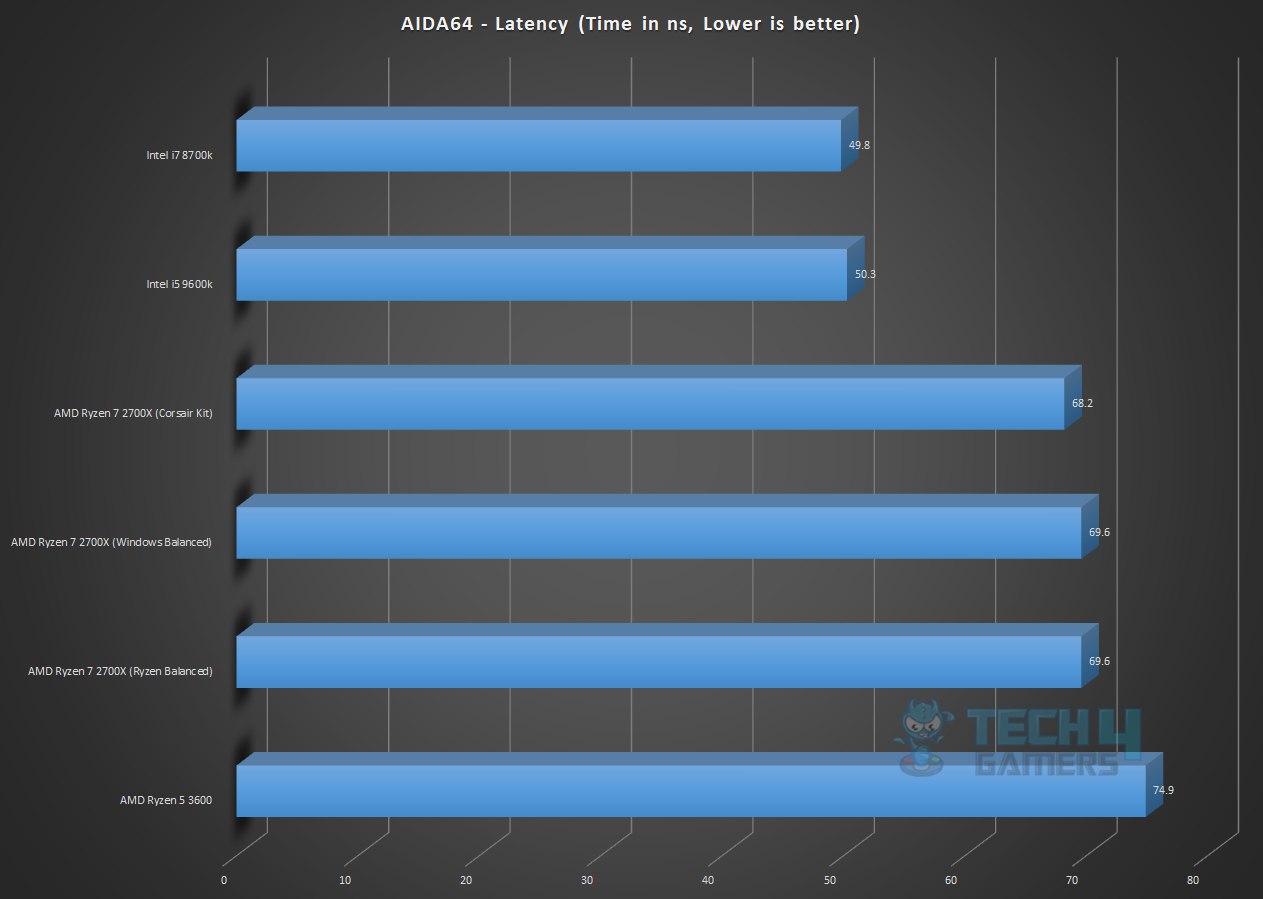
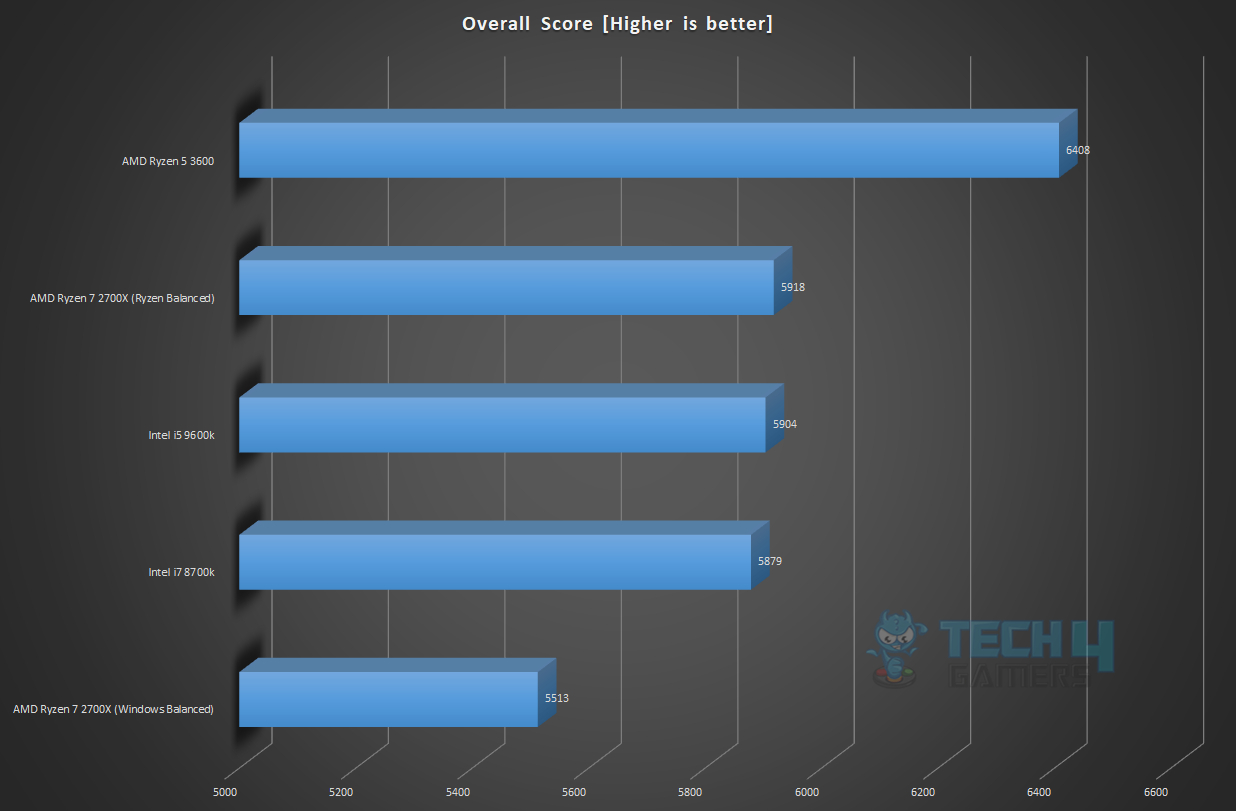
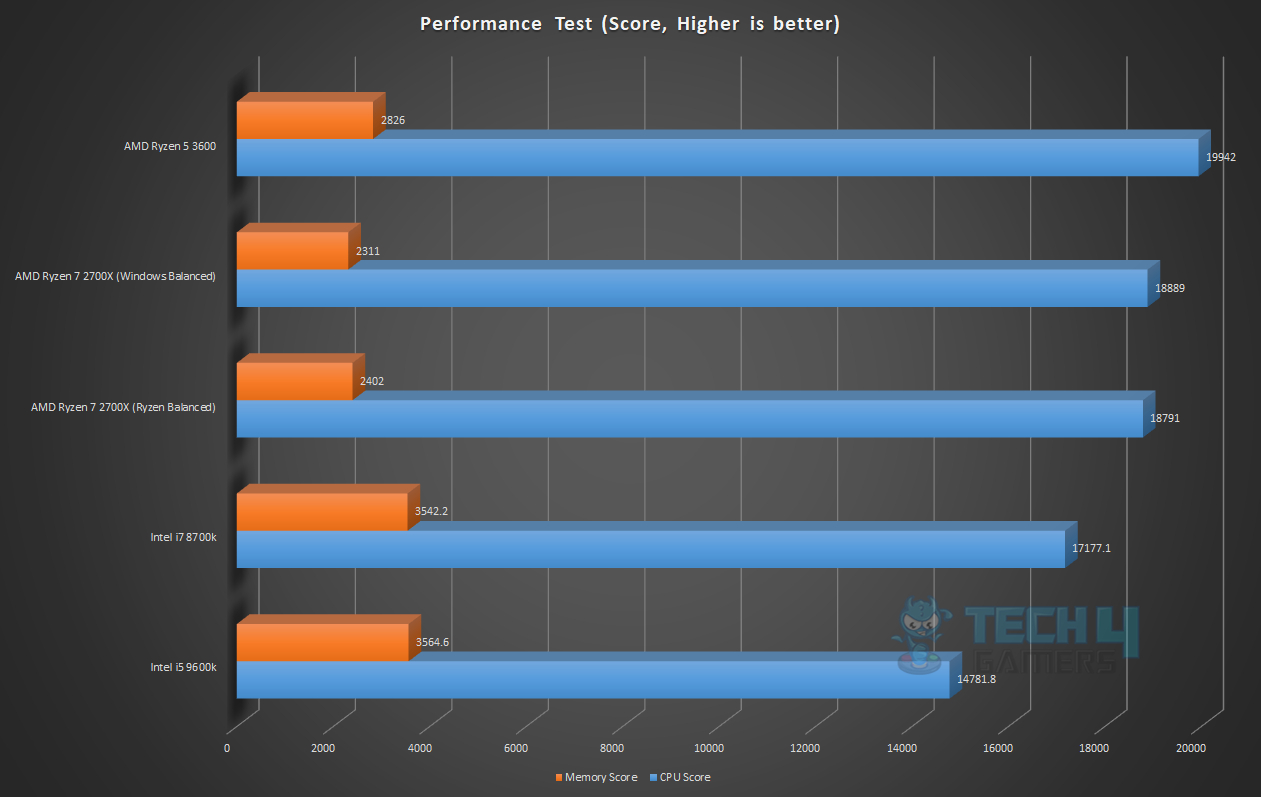
CPU & Memory Benchmarks
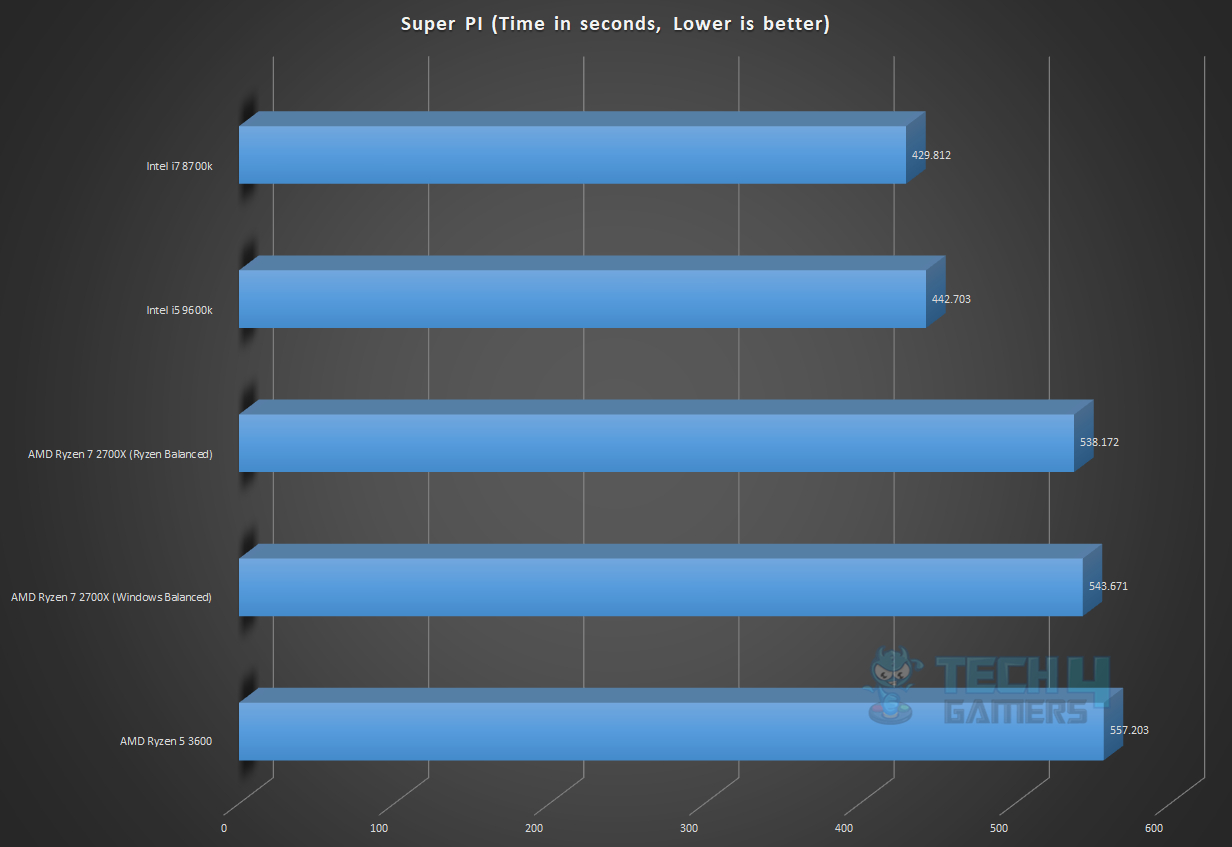
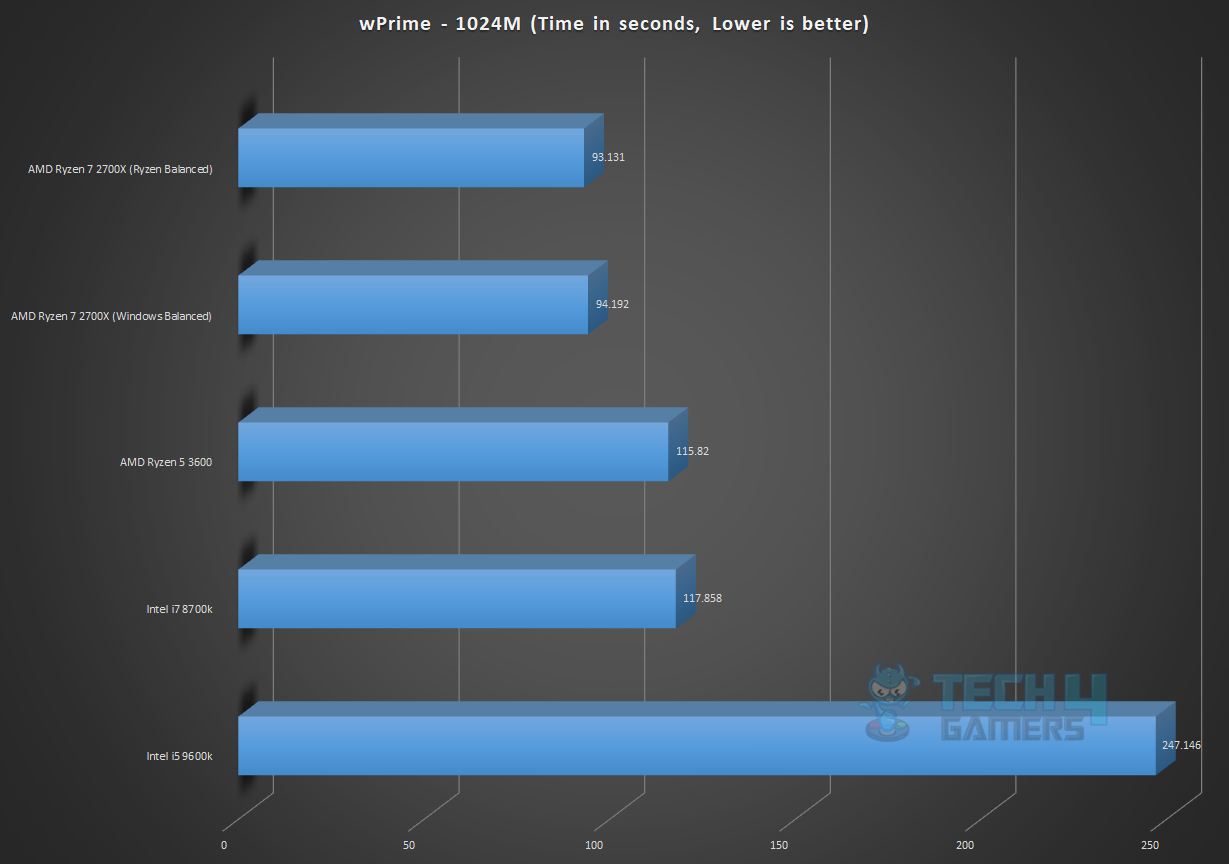
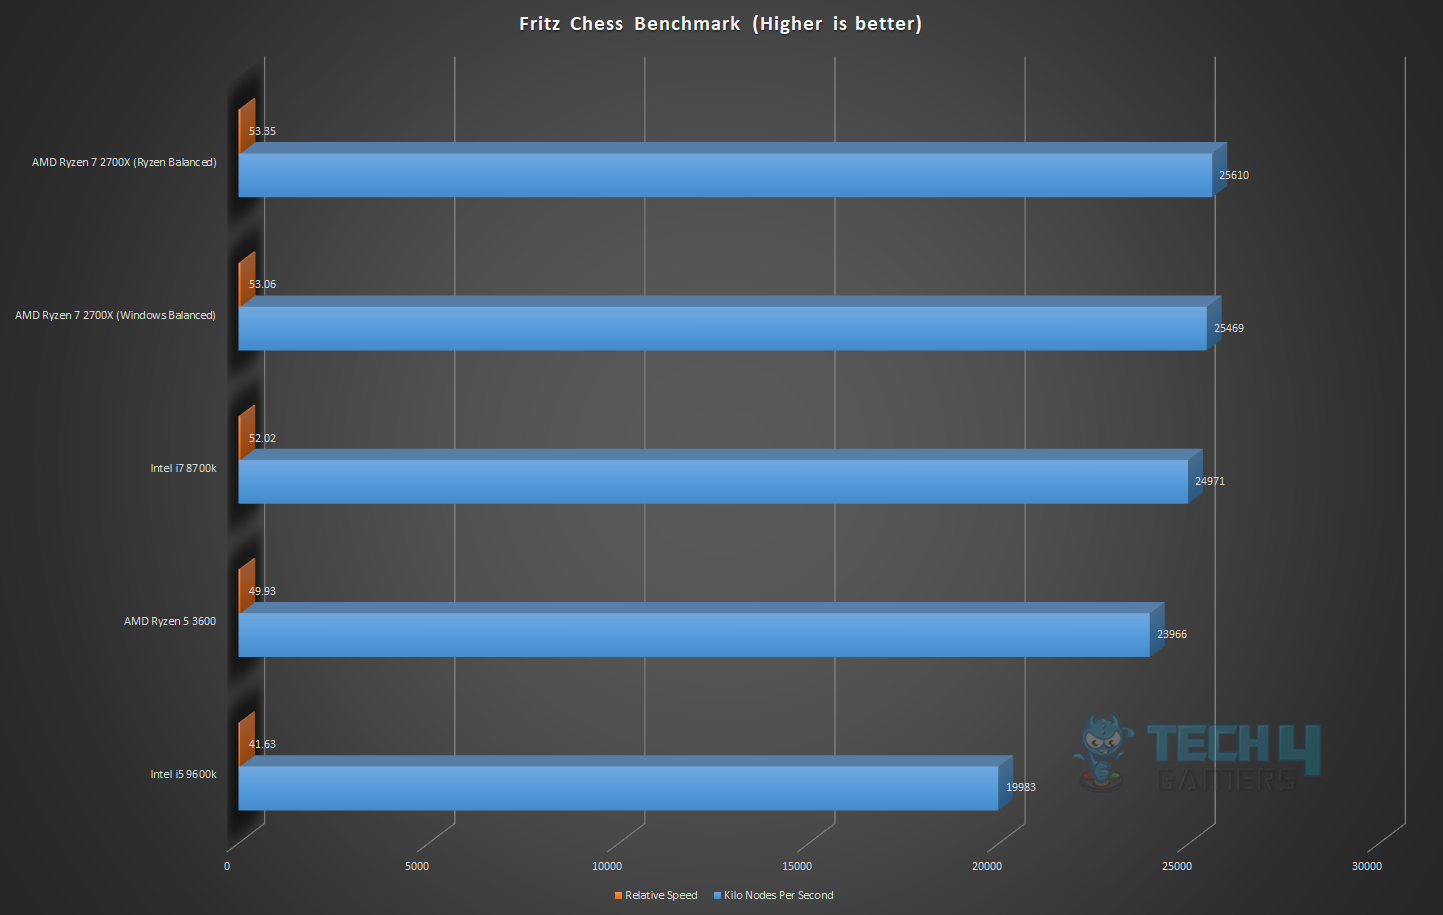
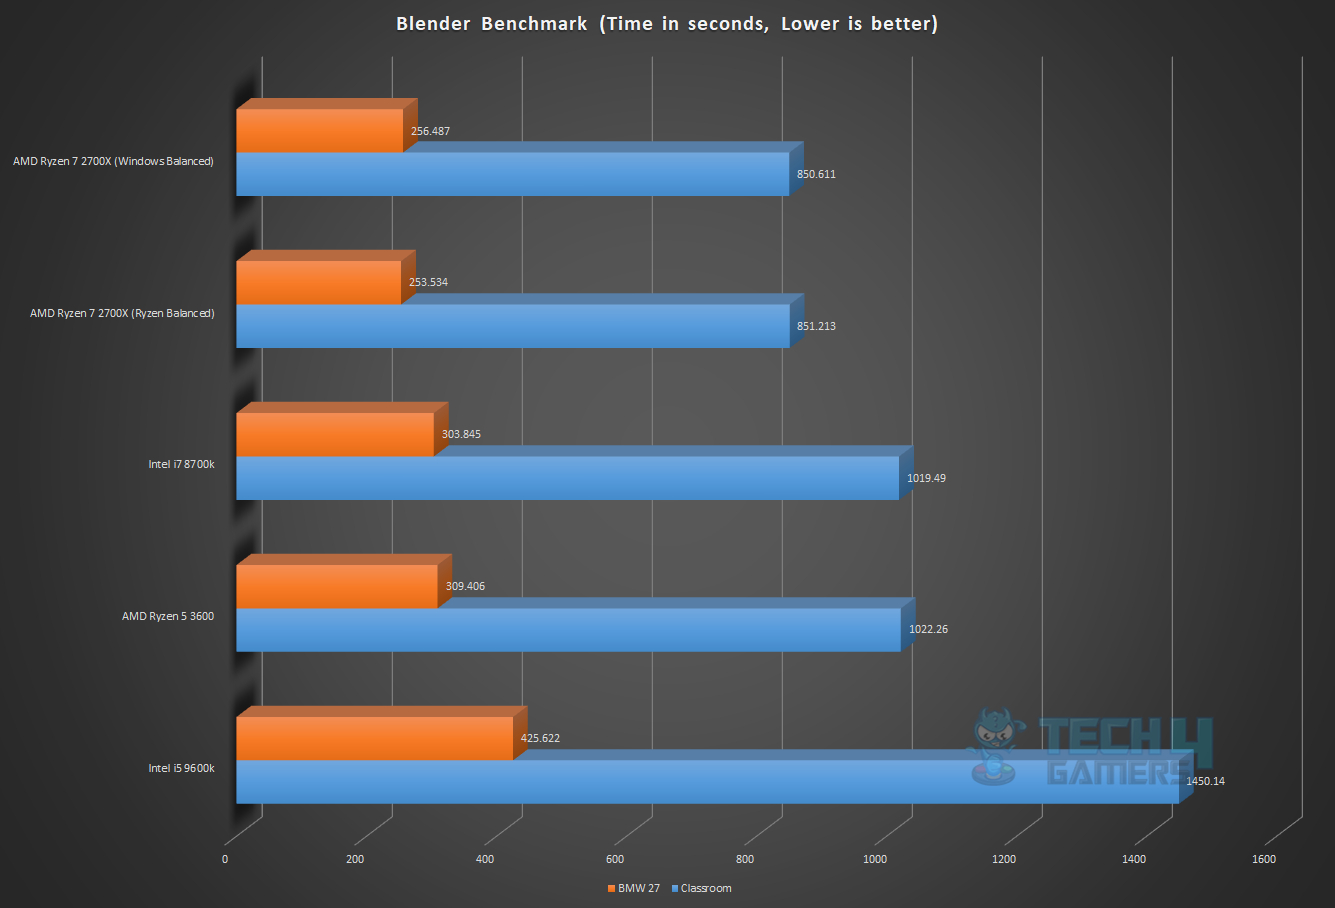
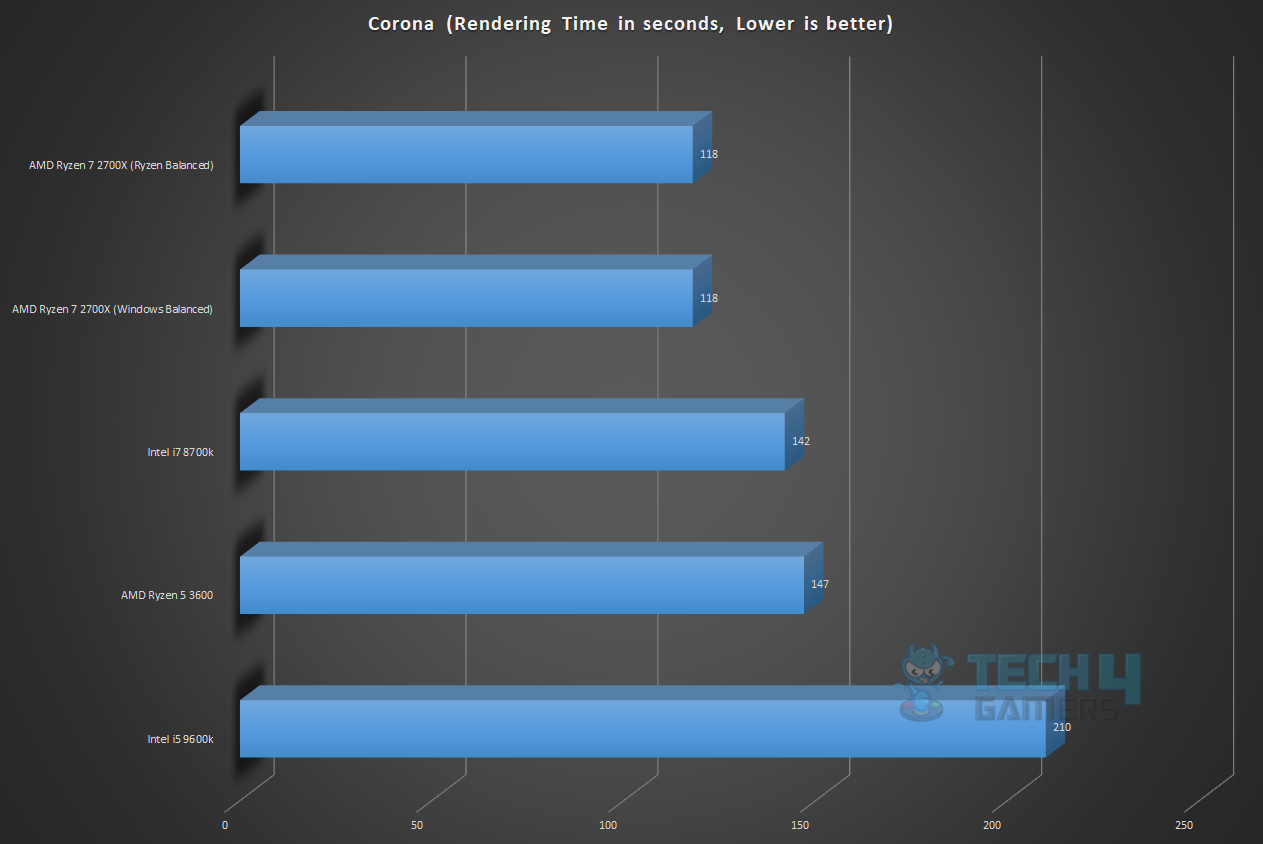
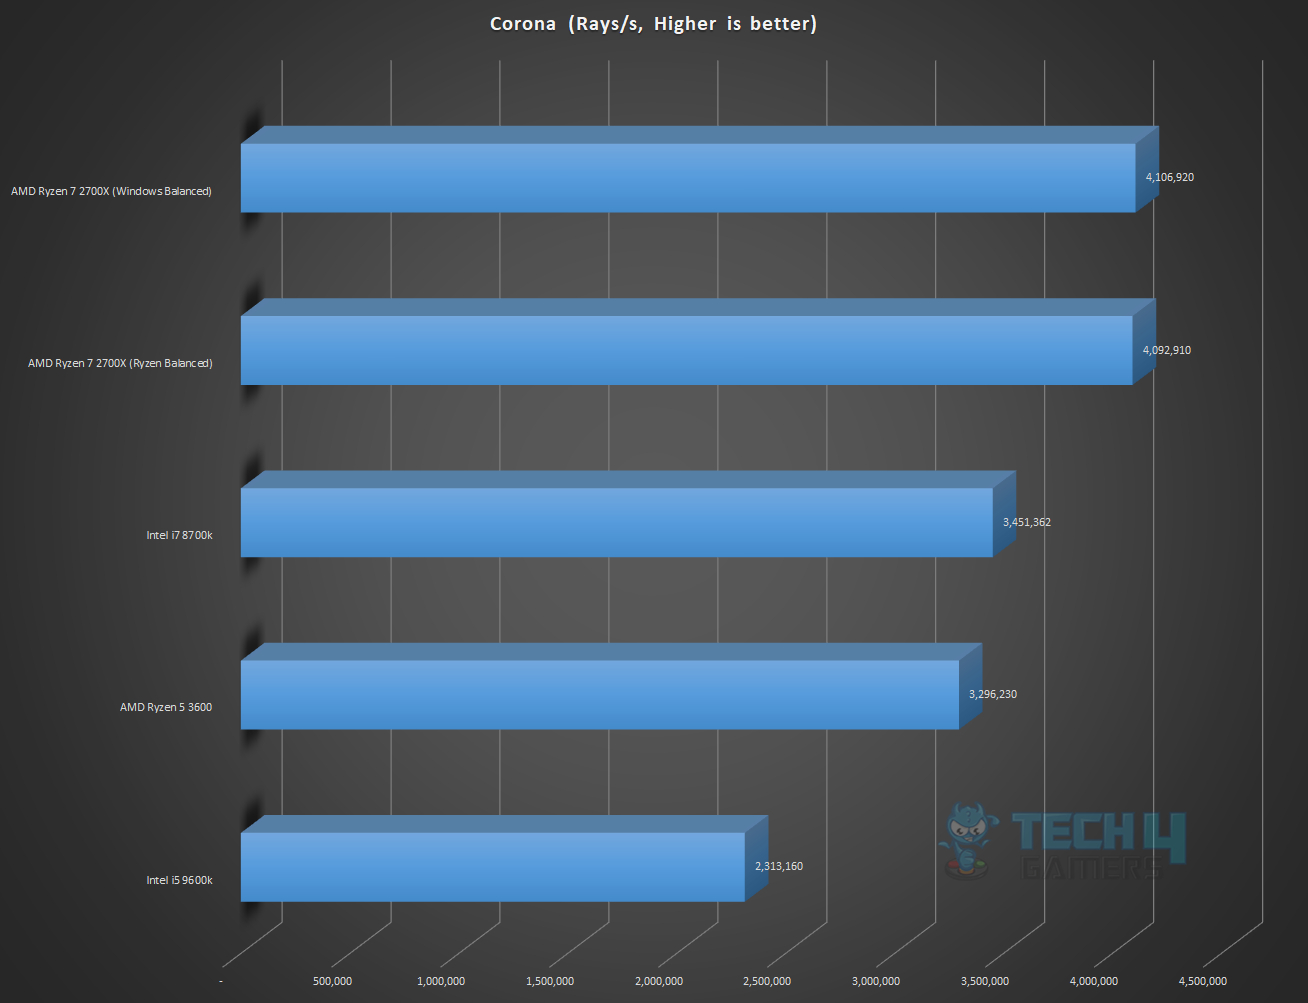
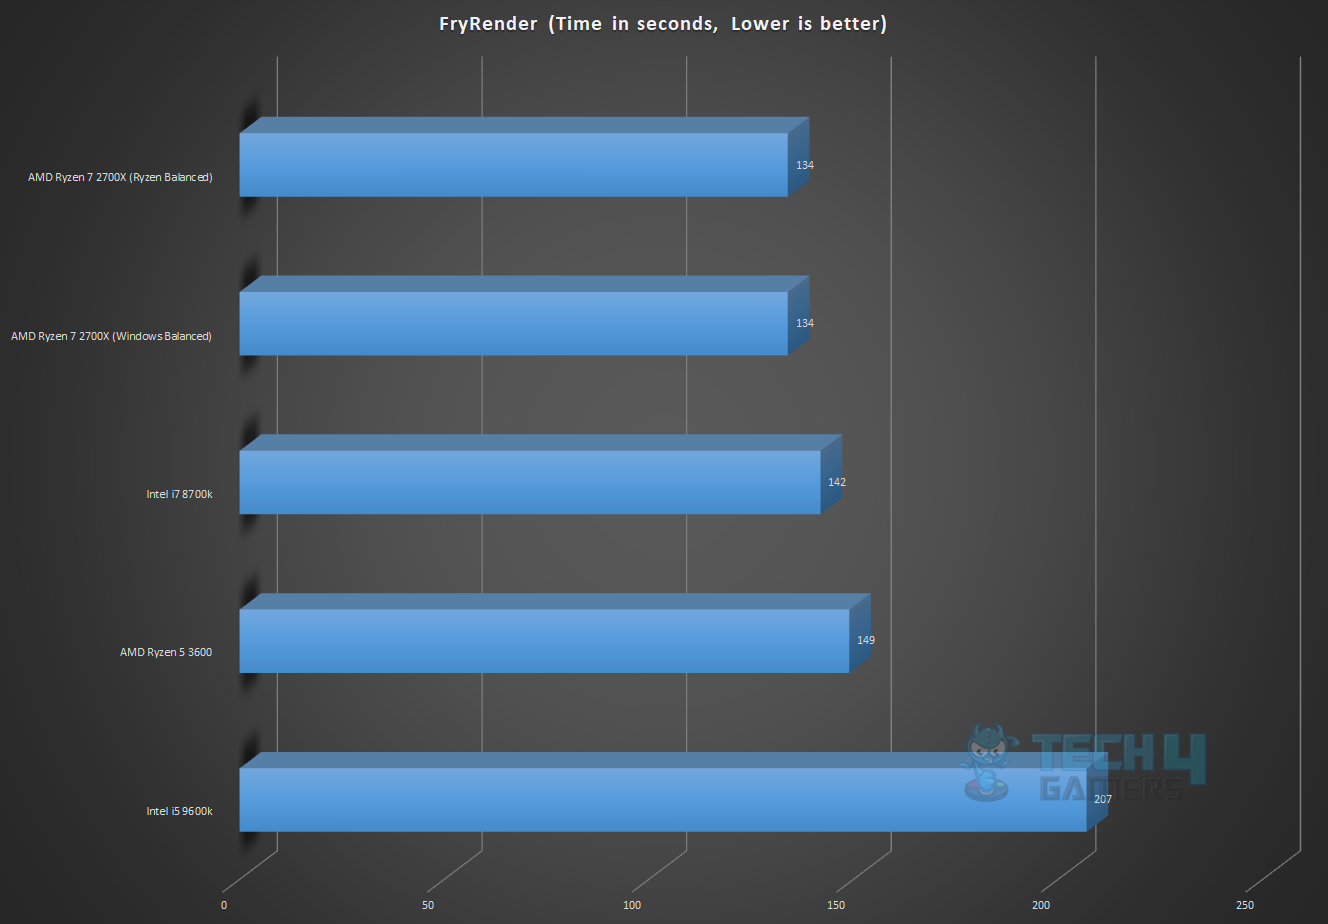
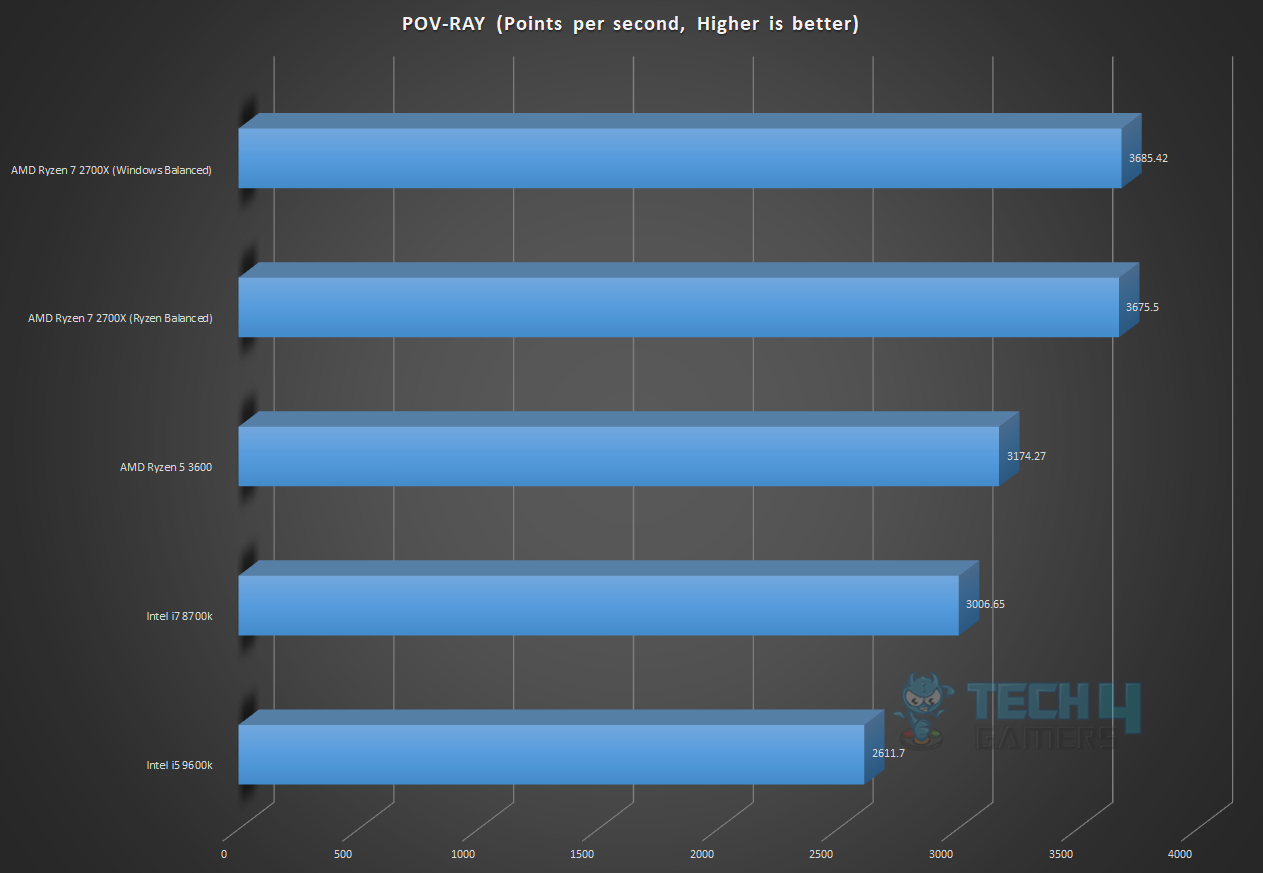
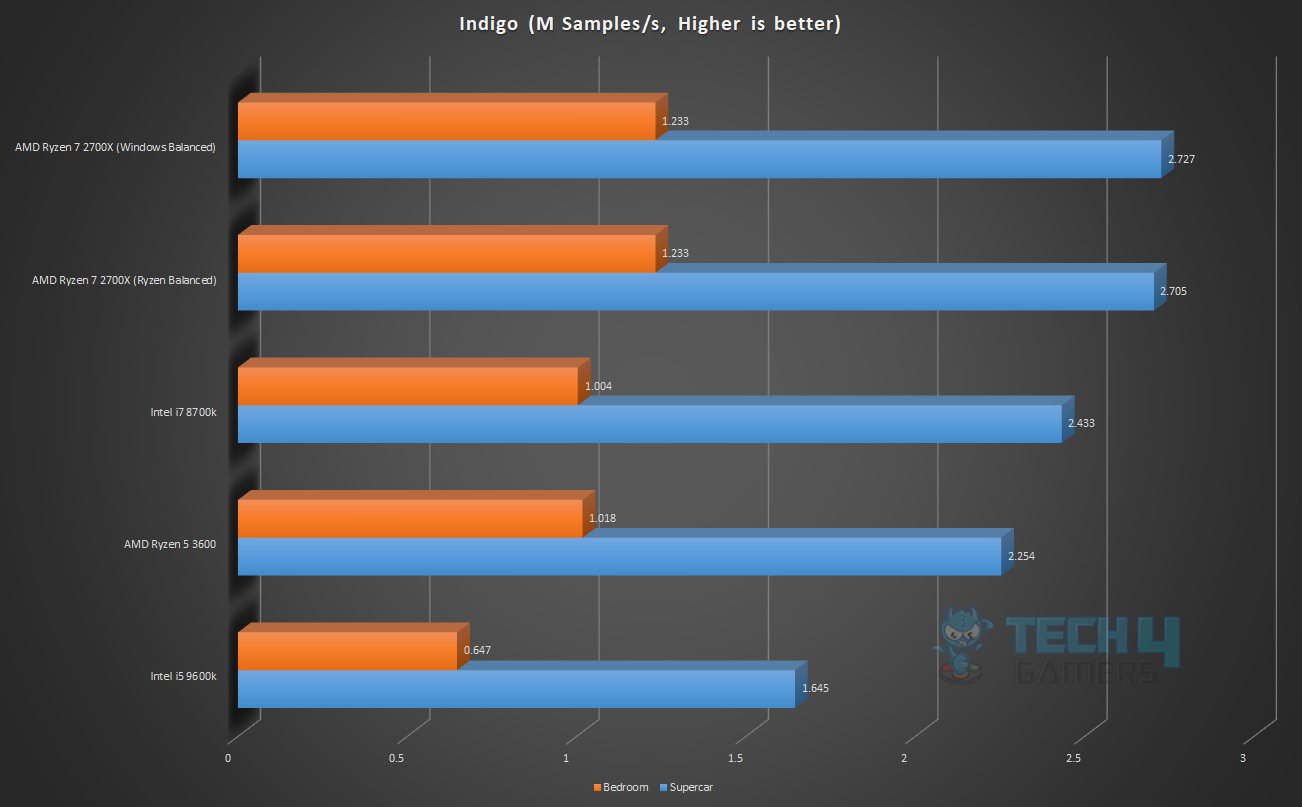
Let’s start with the results. I have run multiple rendering tests for evaluation. The results of these tests are mostly the rendering time and frames per second unless stated otherwise. Lower time and higher FPS are what we are looking for.
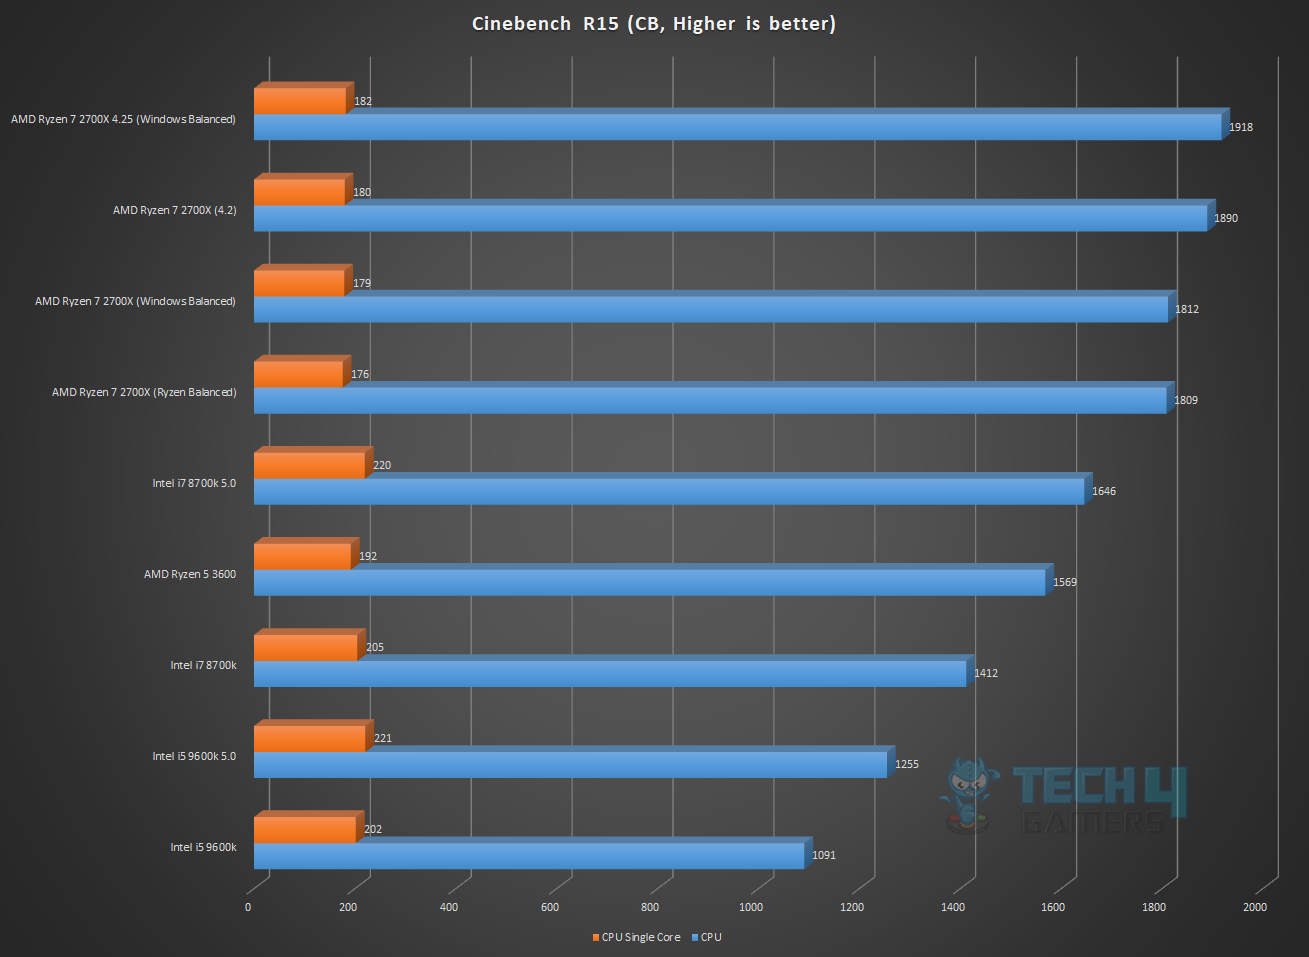
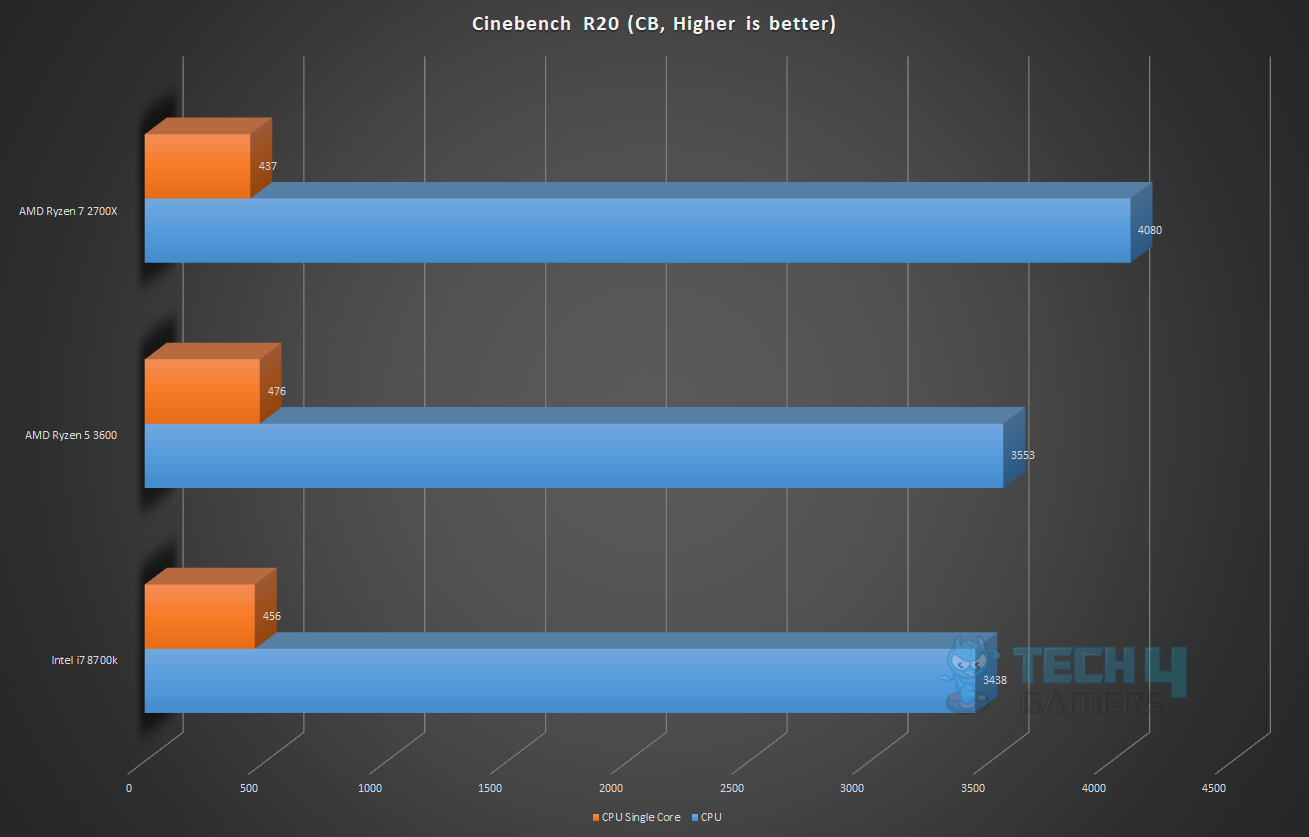
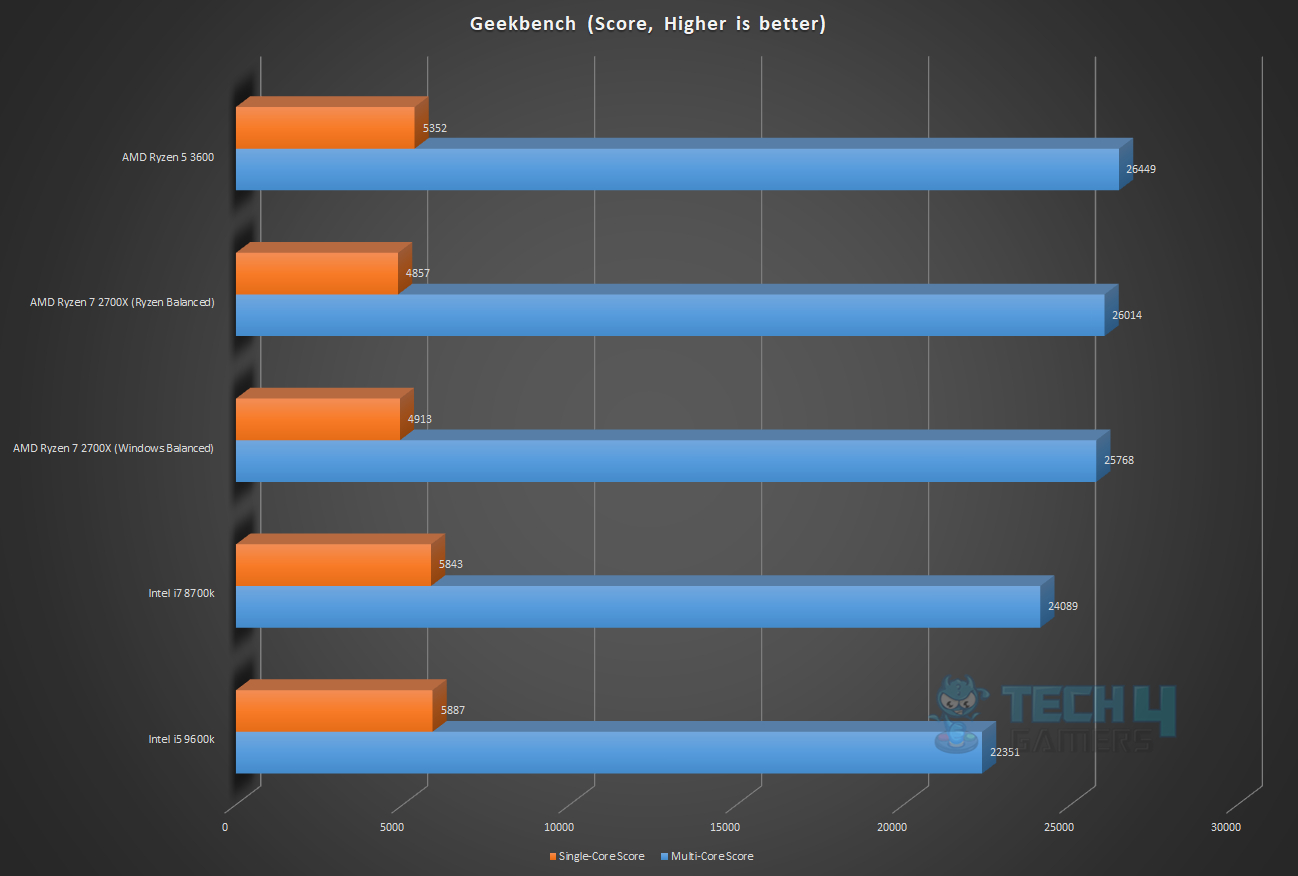
Rendering Benchmarks

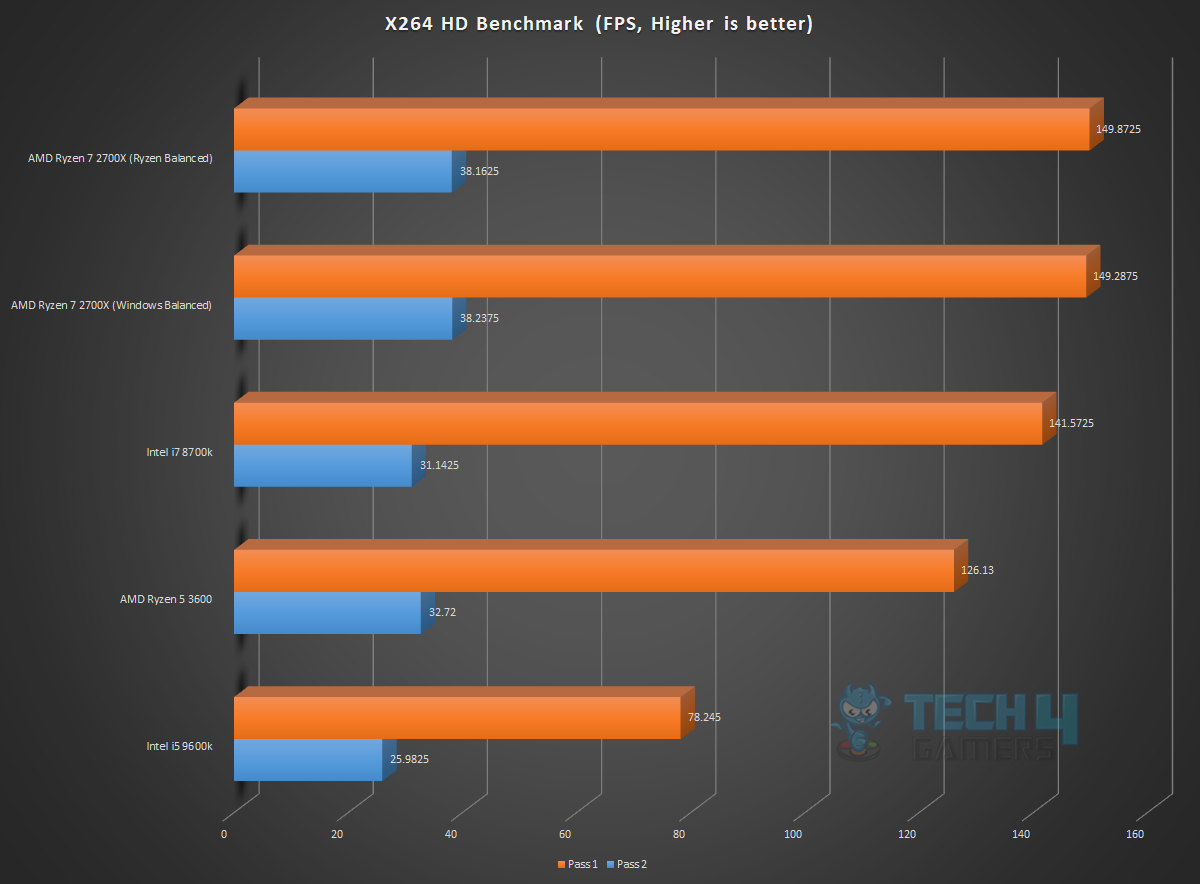
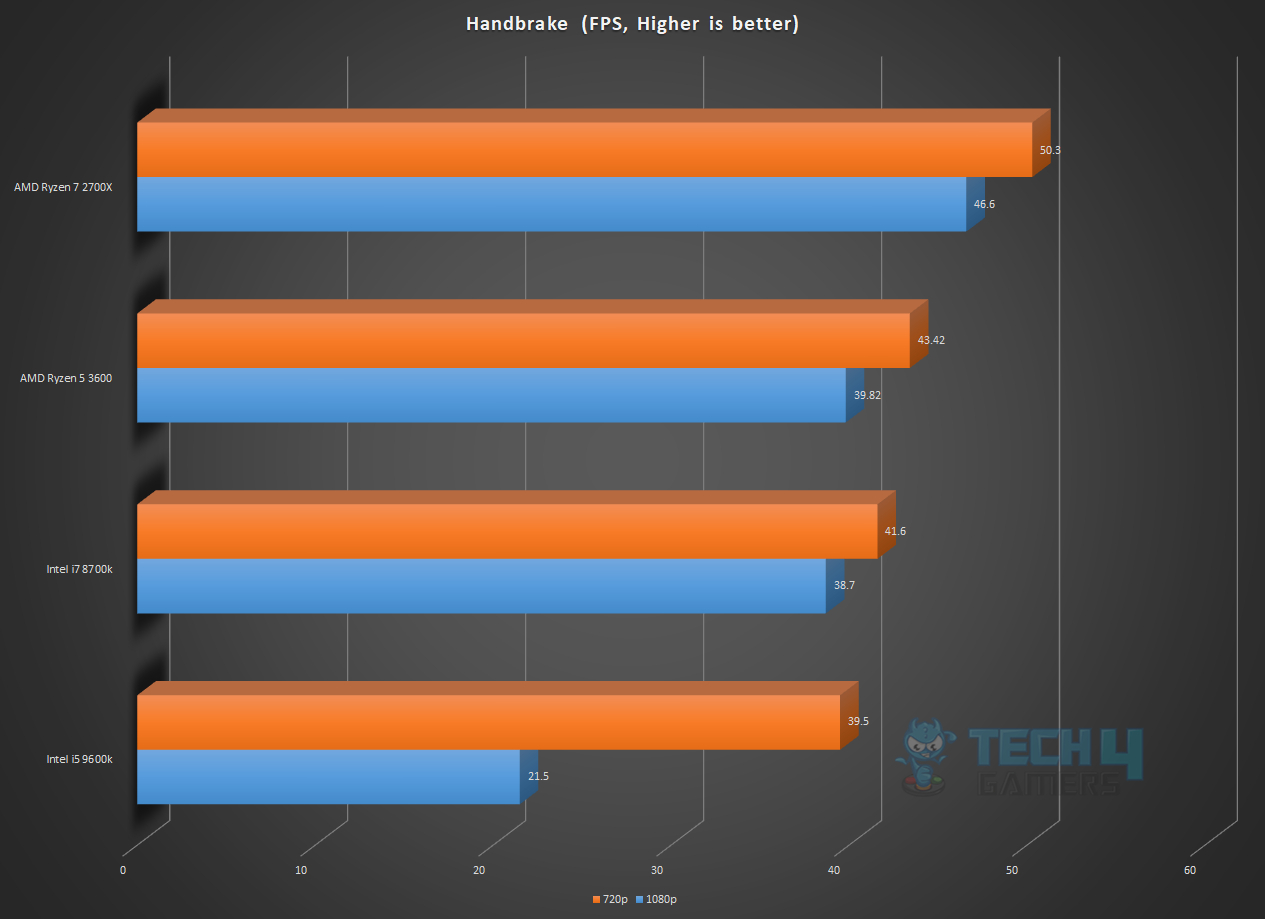
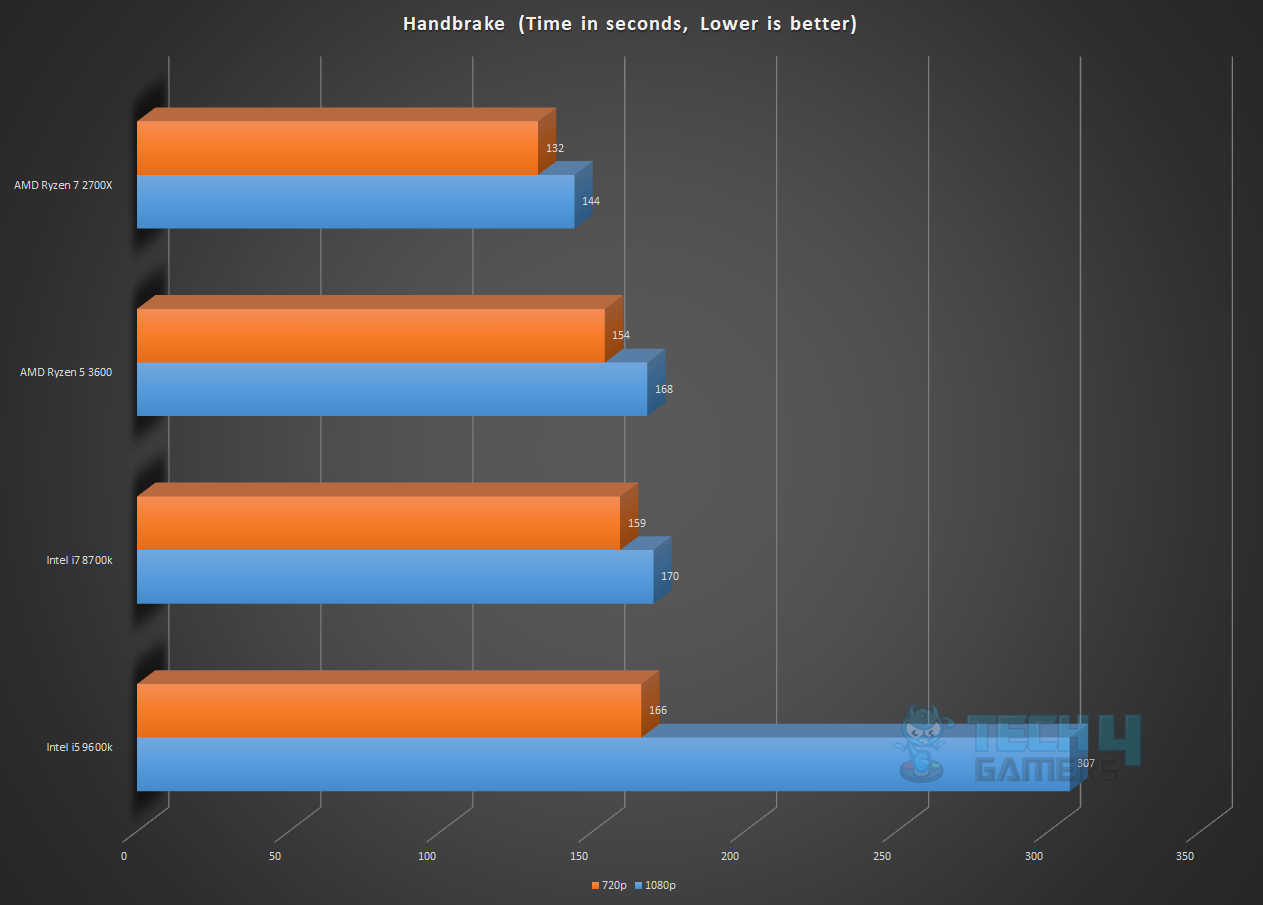
Transcoding Benchmarks
I have used two software, Handbrake, and X264 HD Benchmark, to measure the transcoding performance of the CPU.
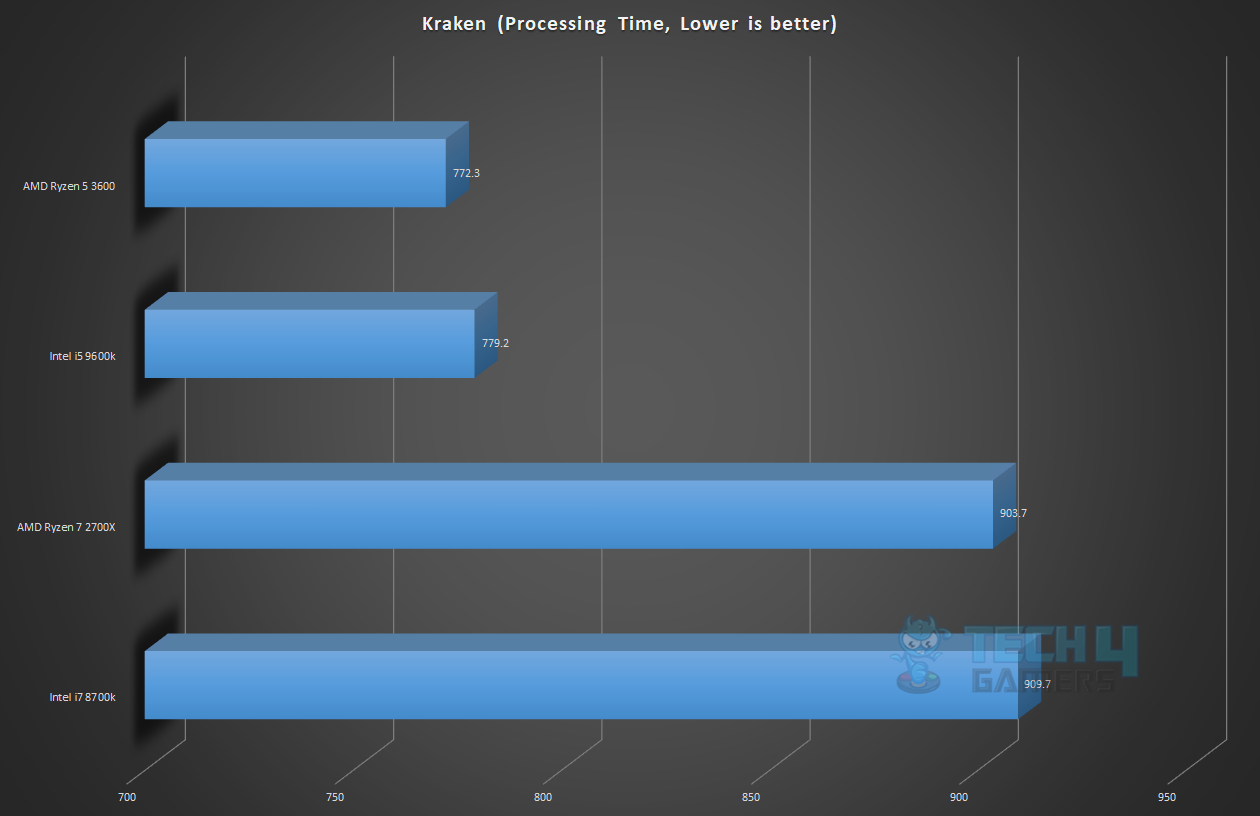
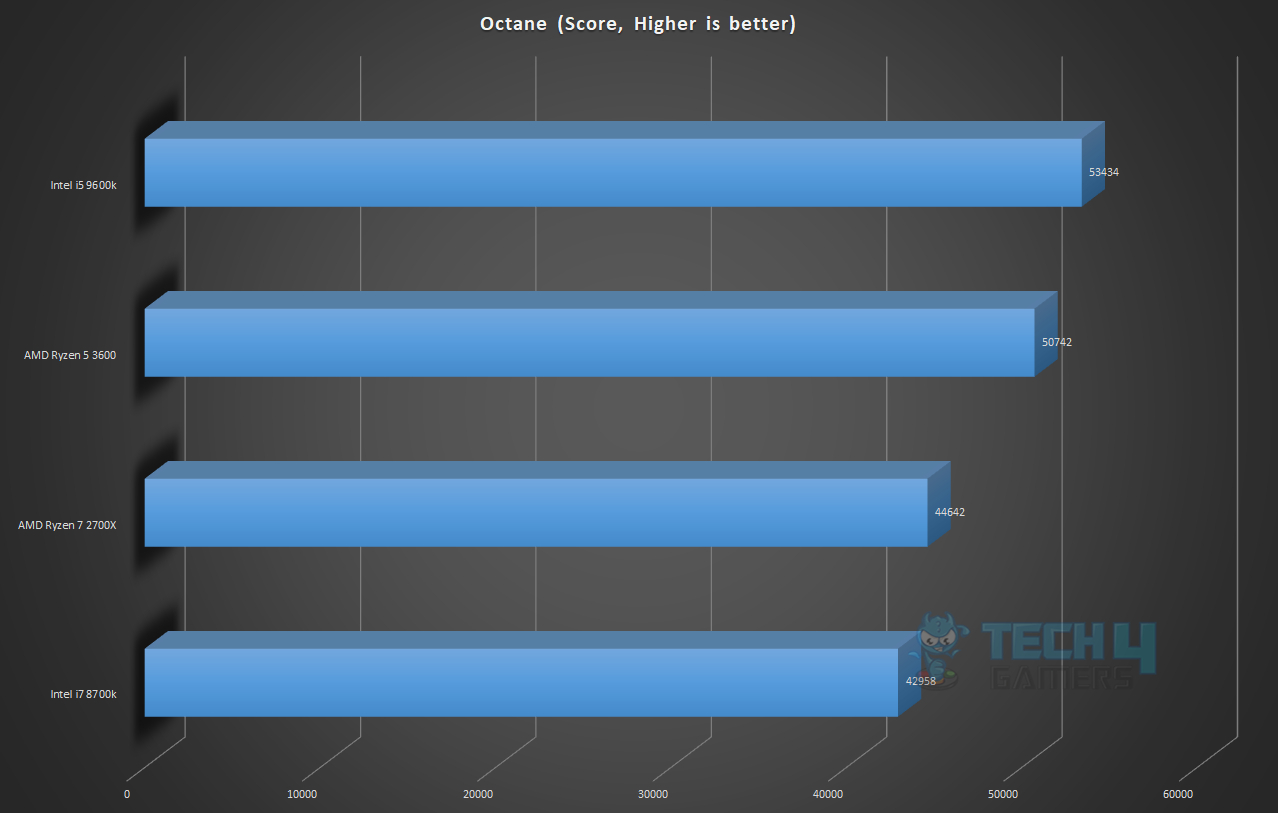
Web Based Benchmarks
I have used two JavaScript-based benchmarks to give you an idea of how CPUs impact general web browsing.
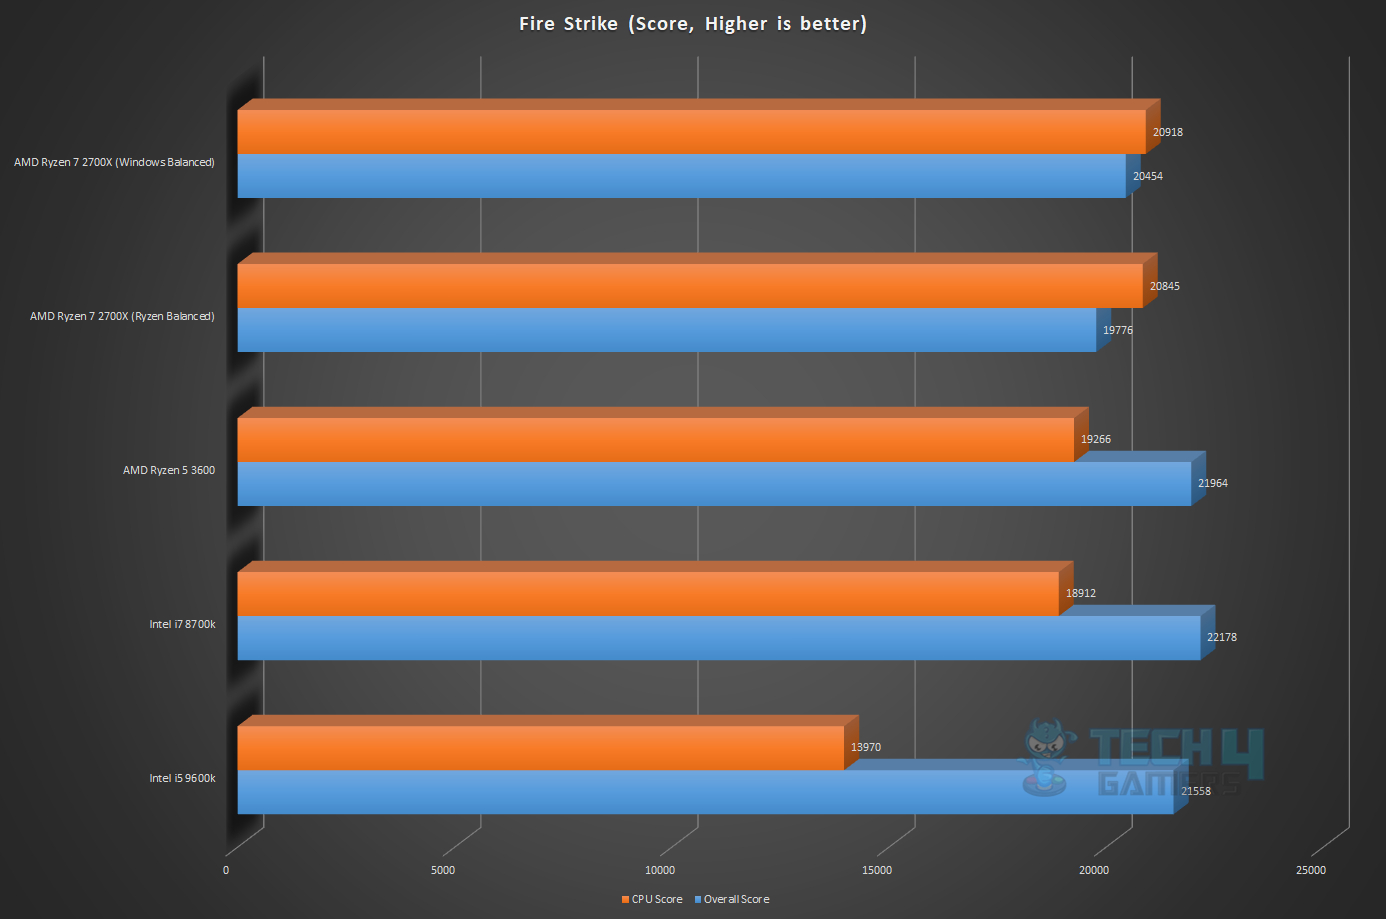
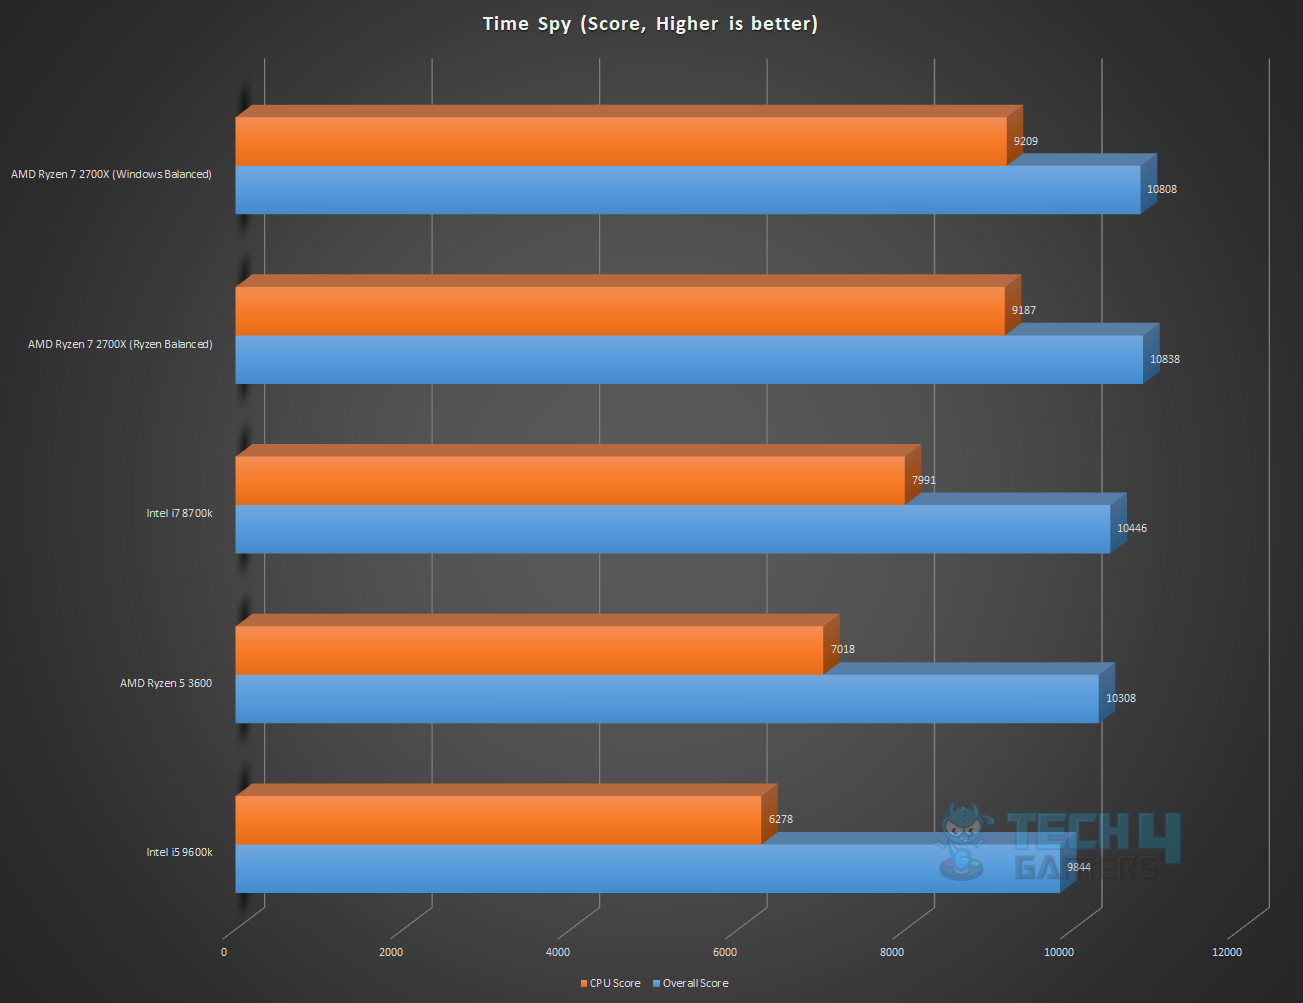
Gaming Benchmarks
Let’s start with the synthetic benchmarks. For this purpose, I have used 3DMark Fire Strike and Time Spy benchmarks.
The following games have been tested:
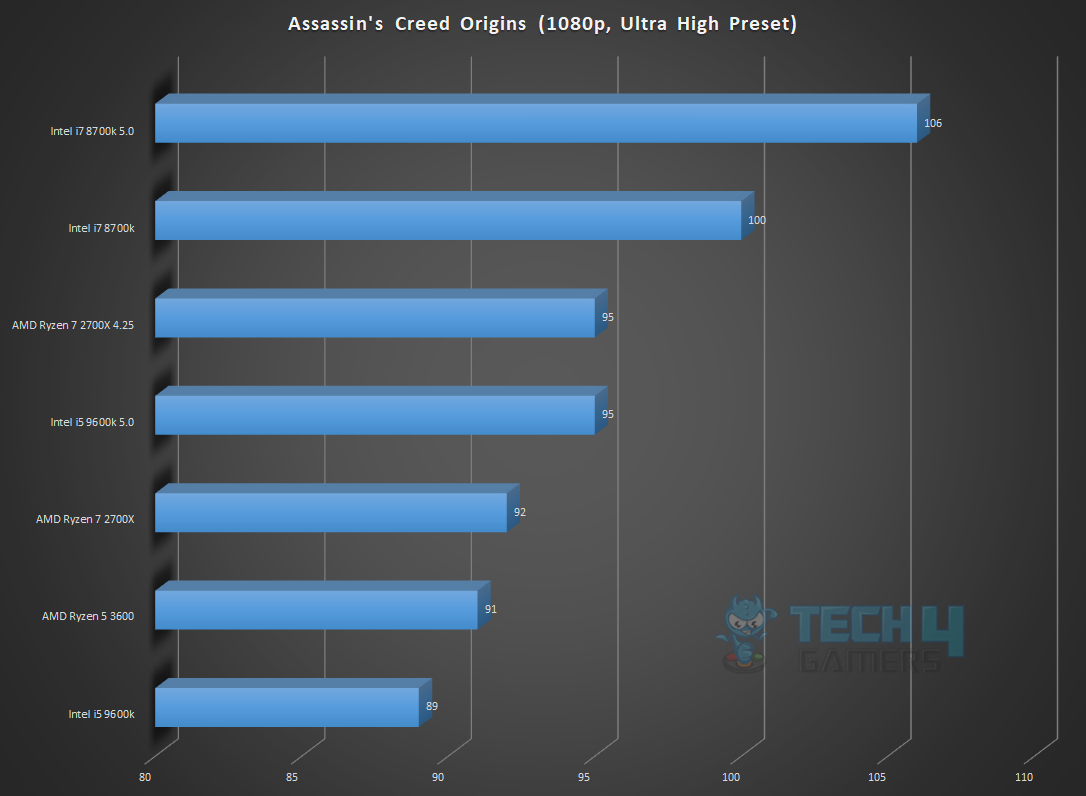
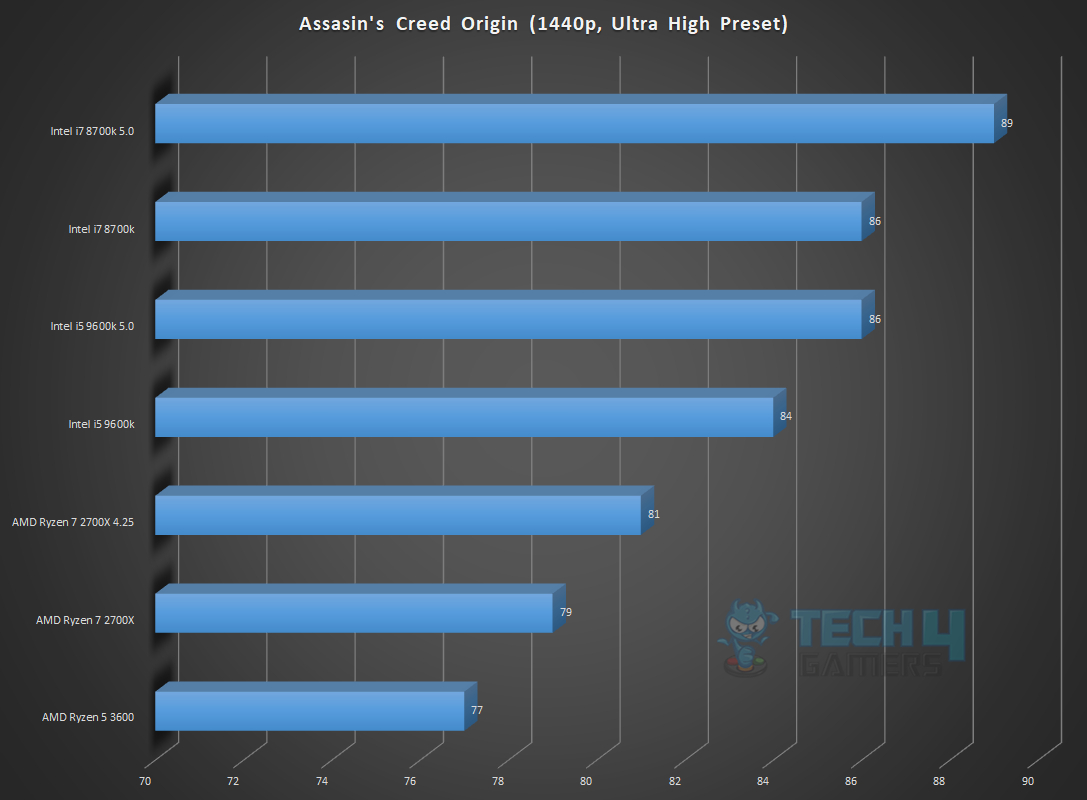
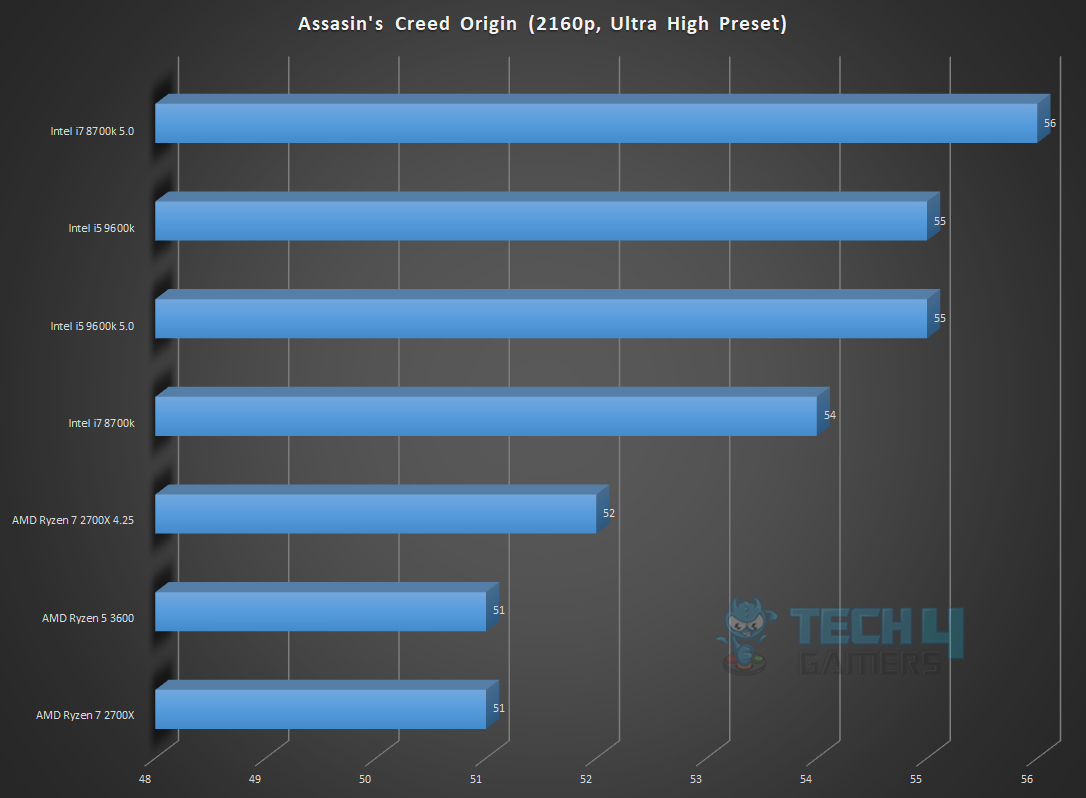
- Assassin’s Creed Origins
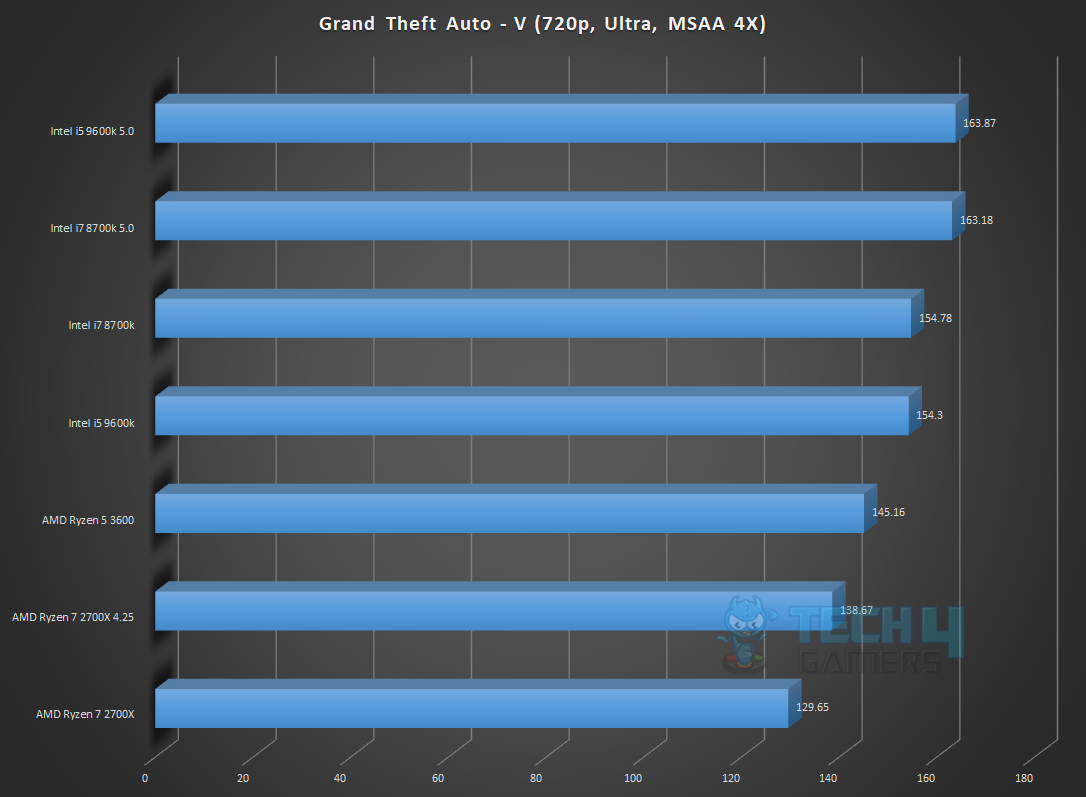
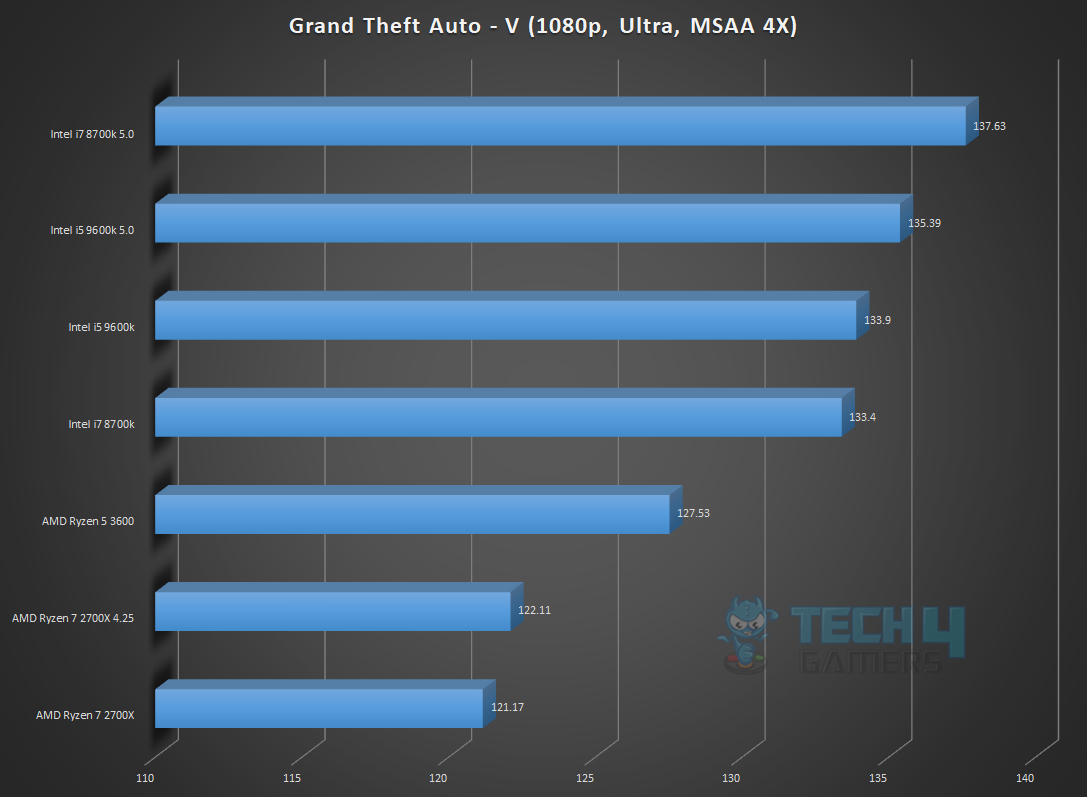
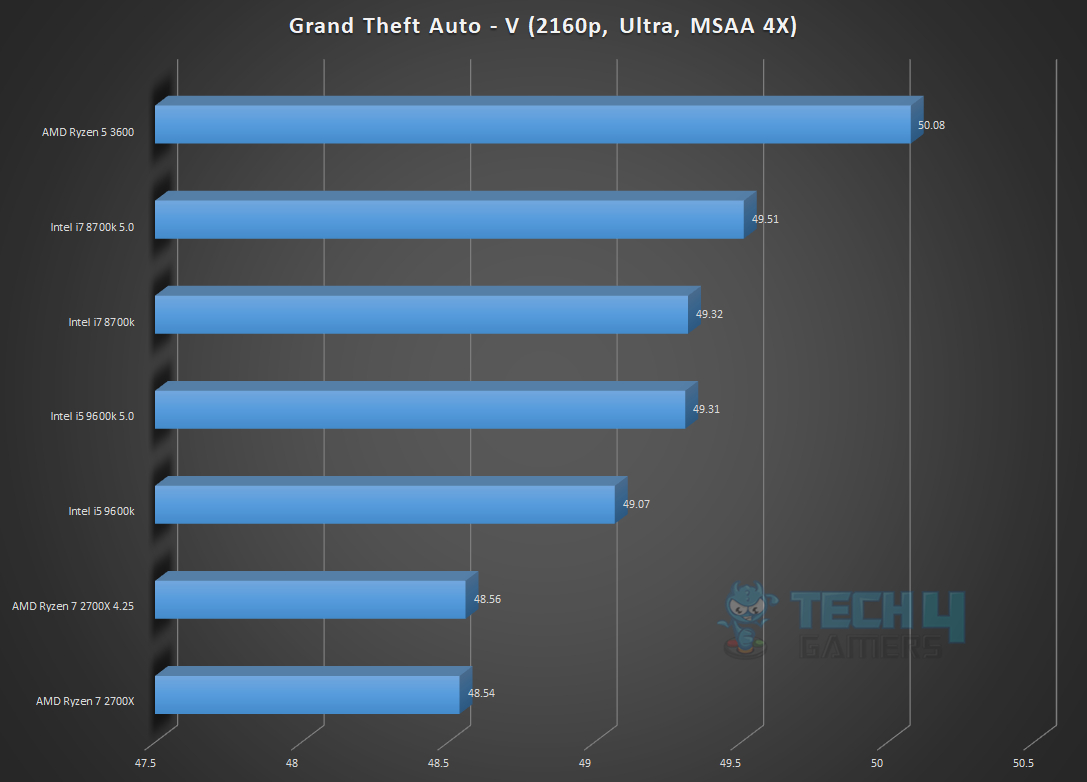
- Grand Theft Auto – V
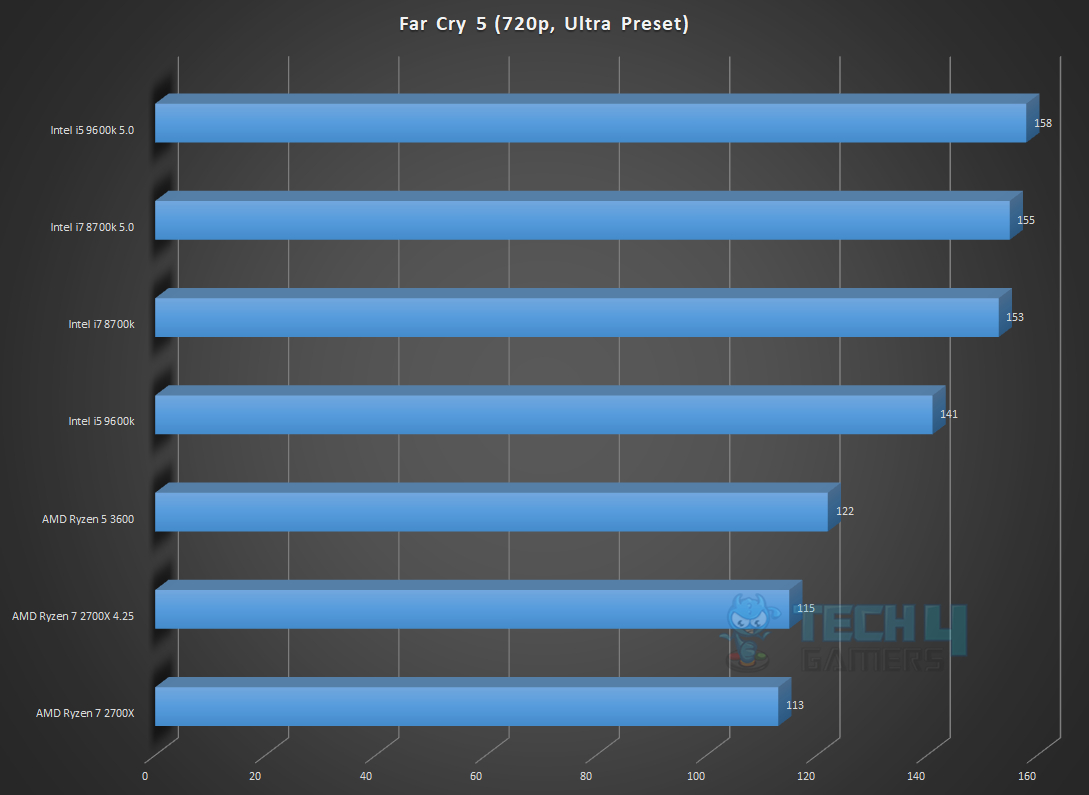
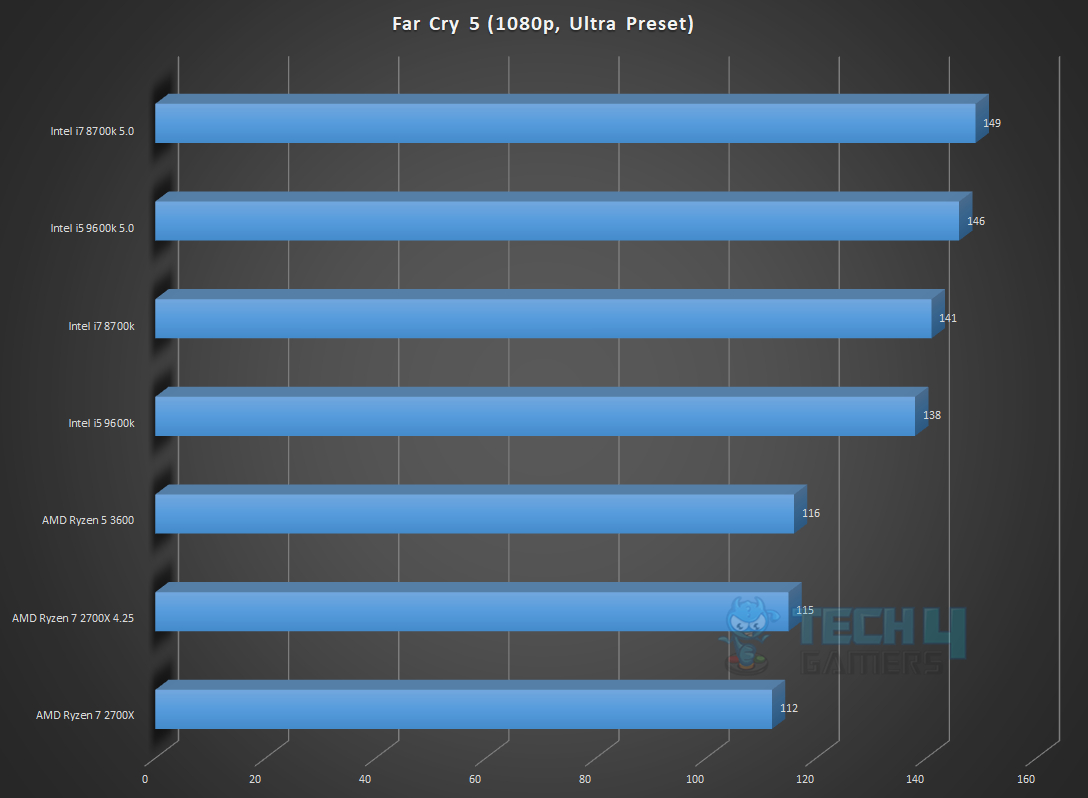
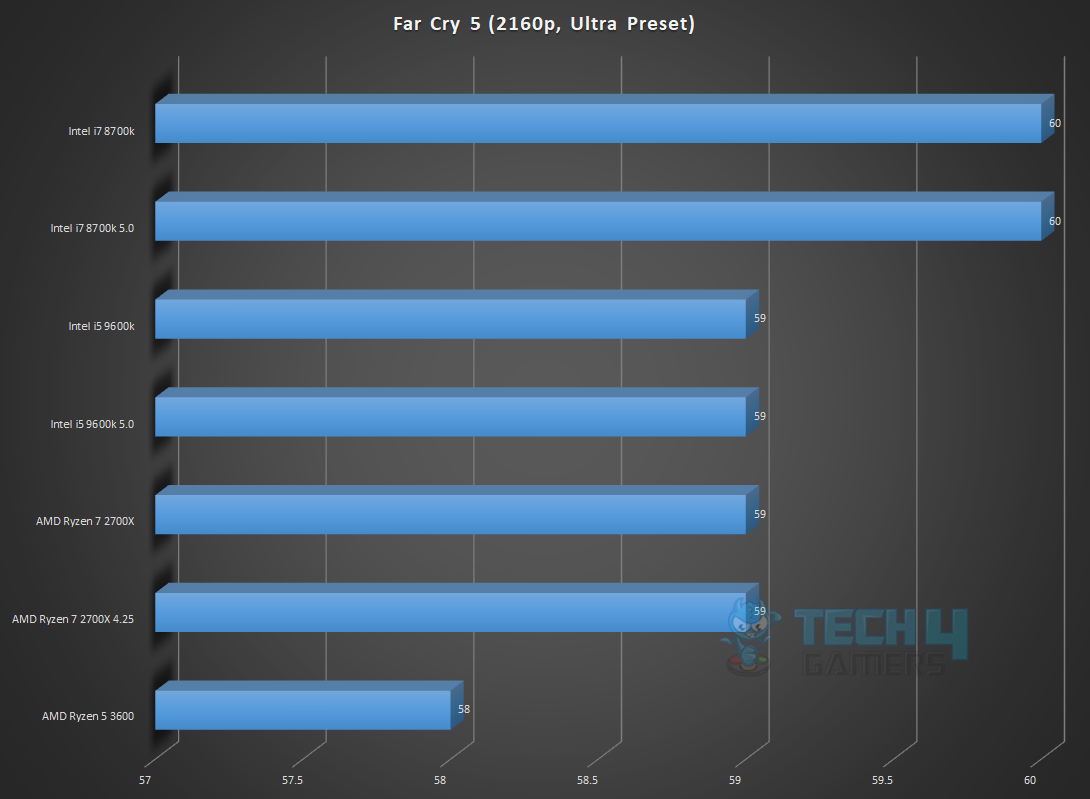
- Far Cry 5
- Shadow of the Tomb Raider (DX12)
- DOOM (Vulkan)
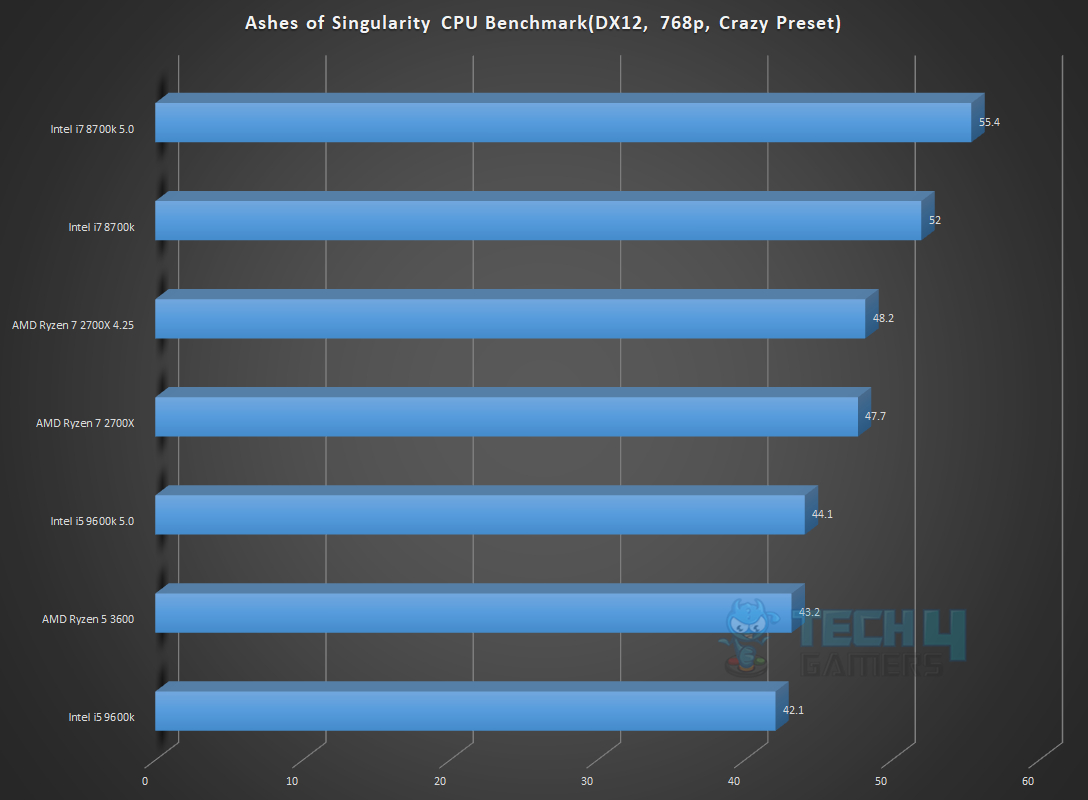
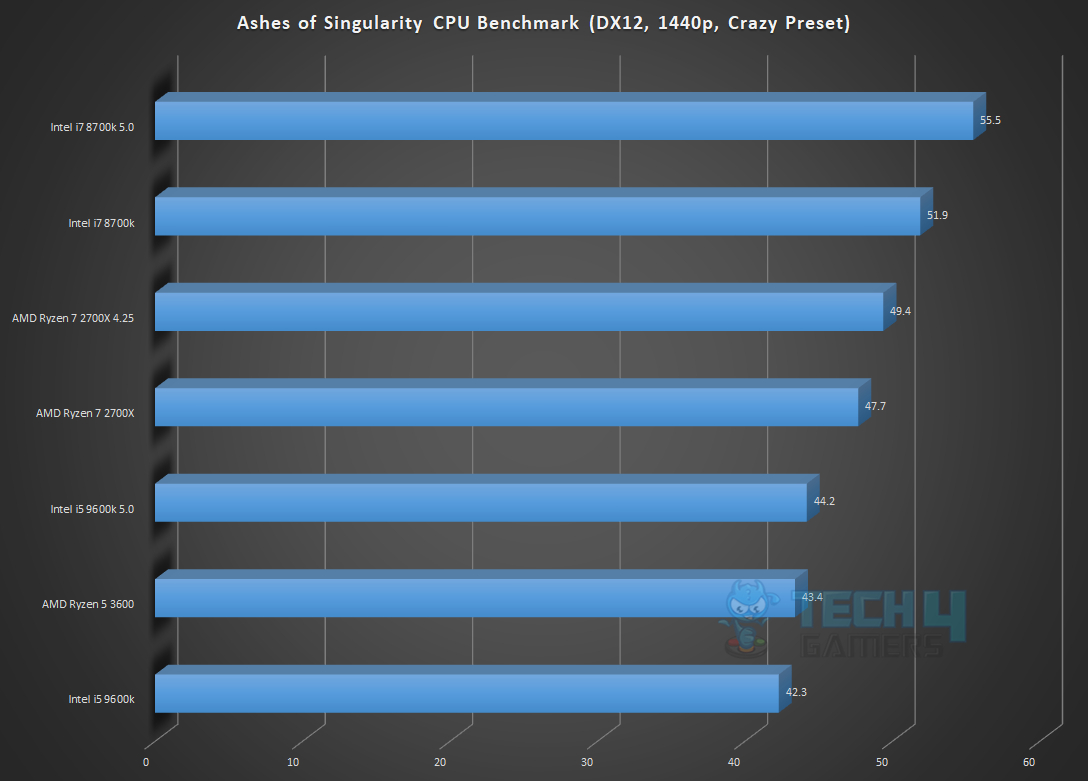
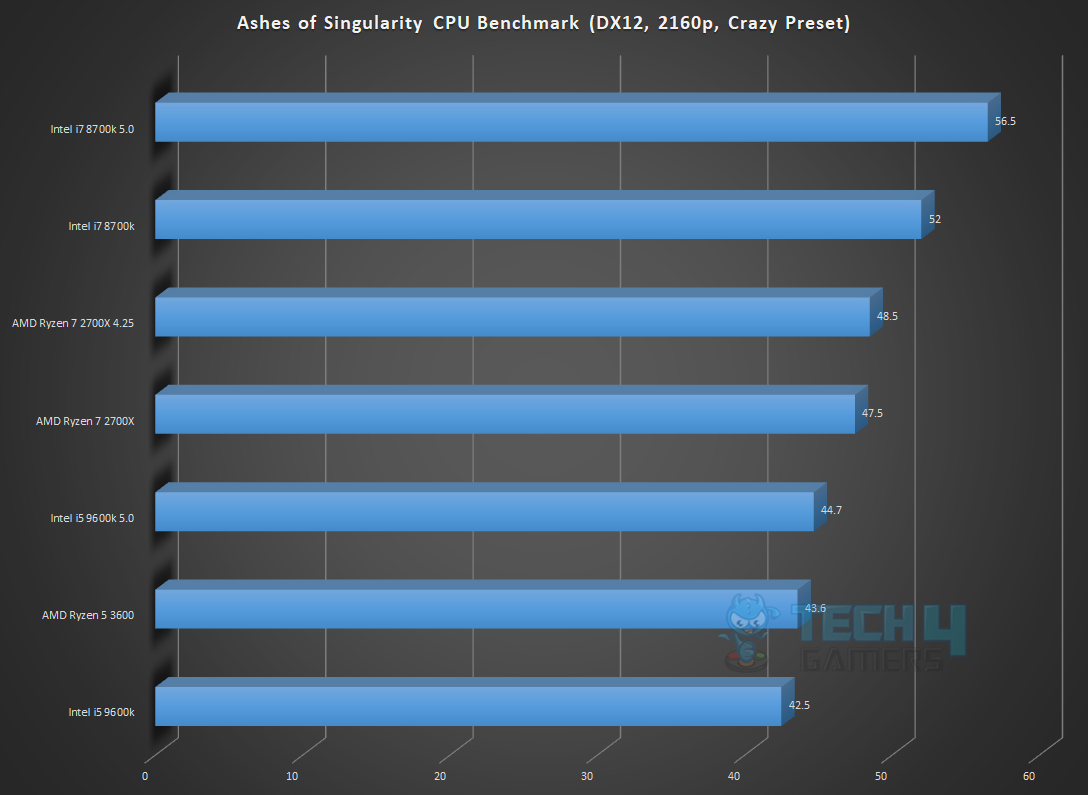
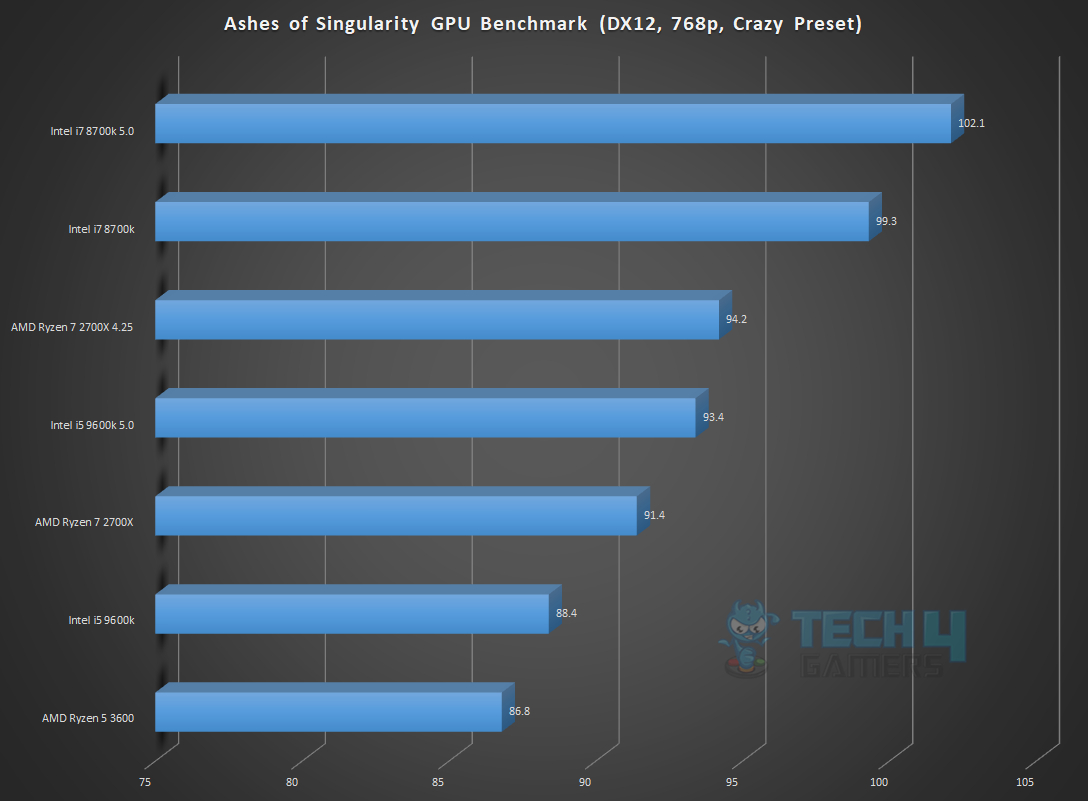
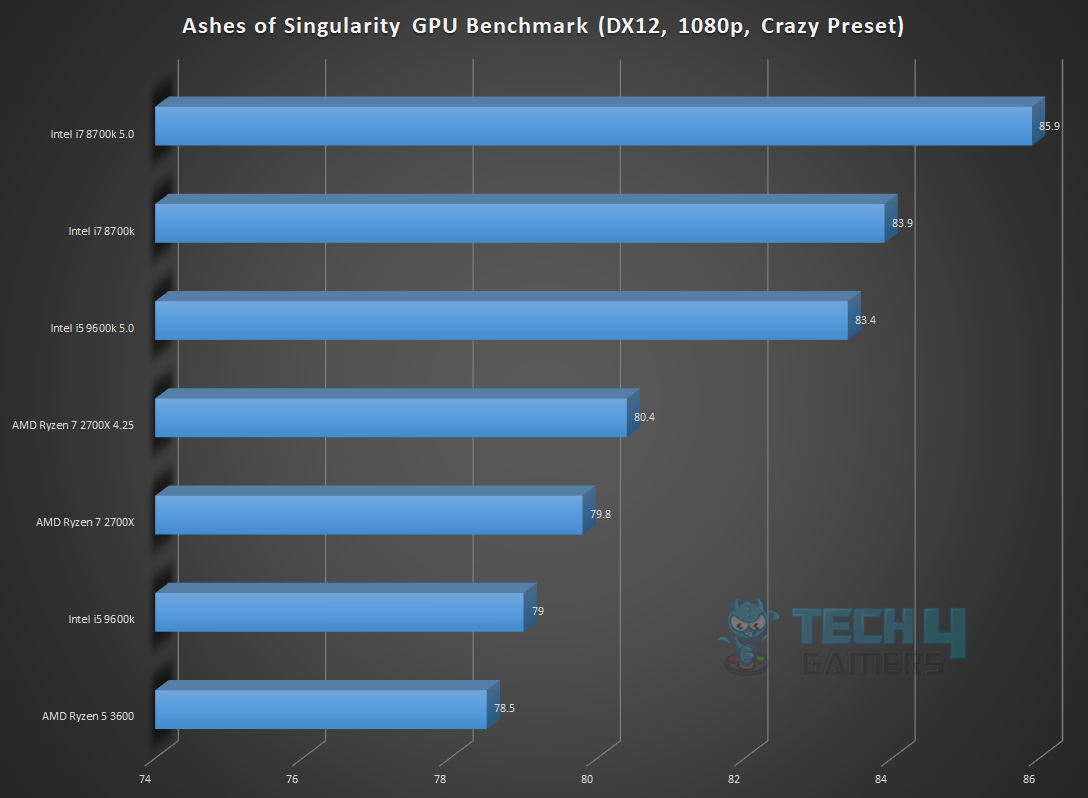
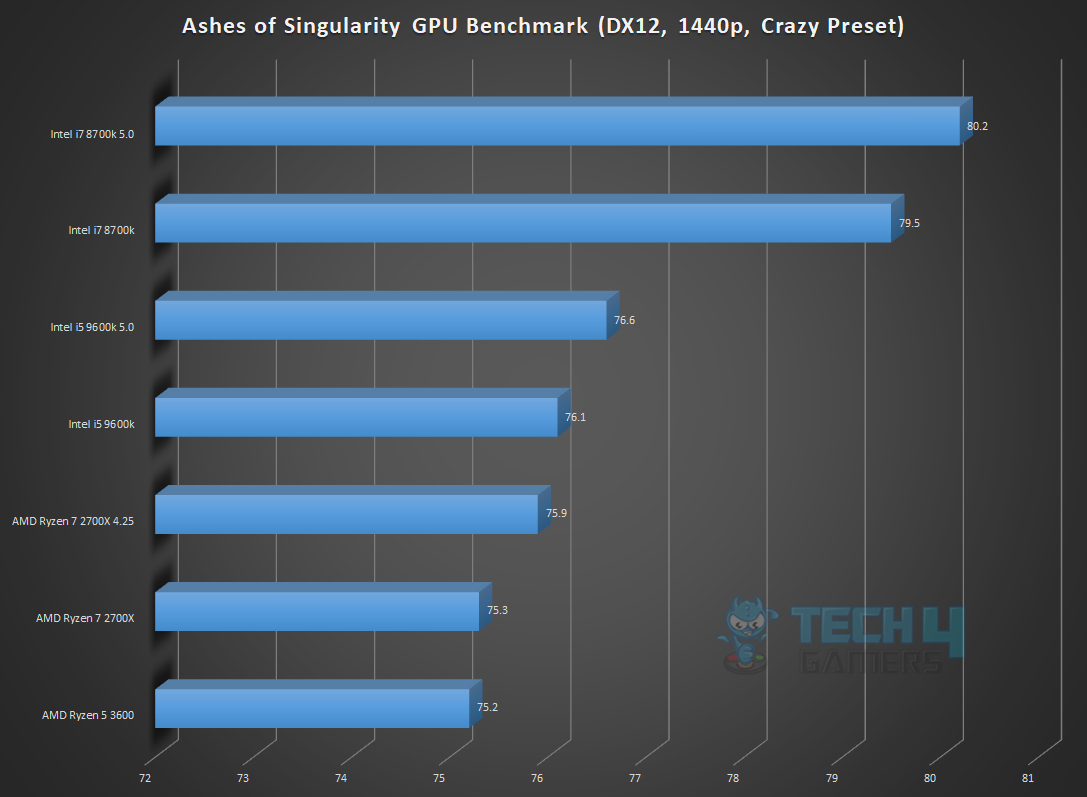
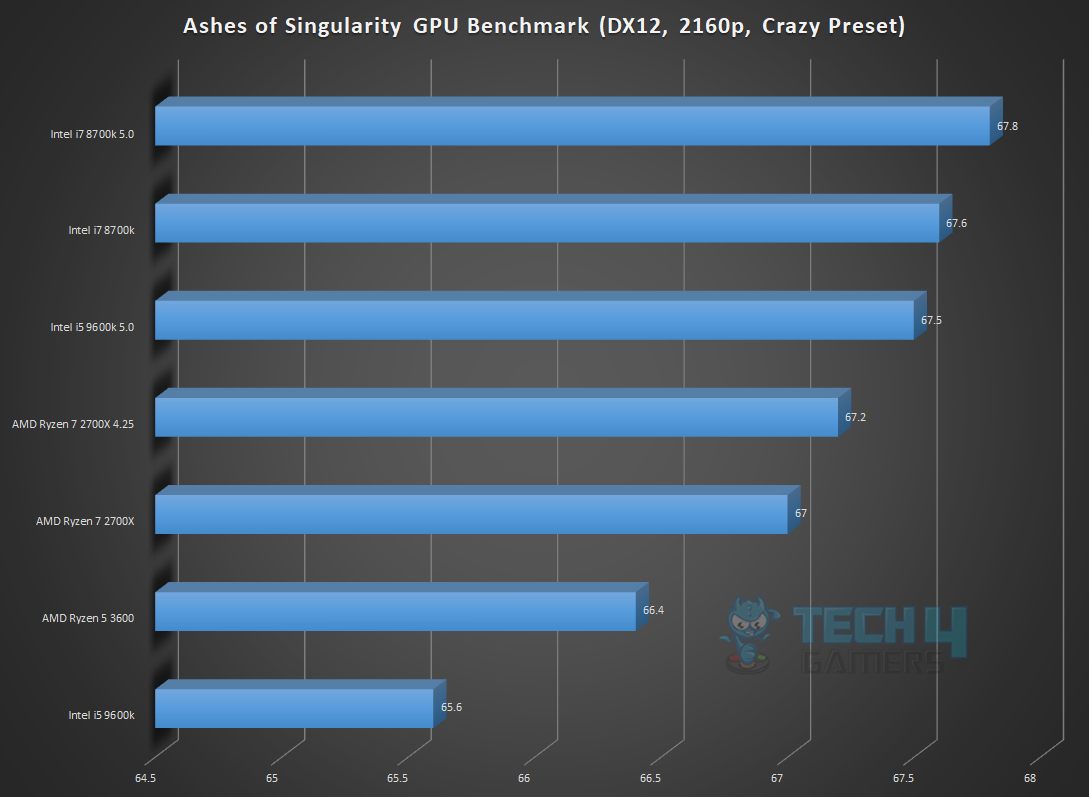
- Ashes of the Singularity (DX12)
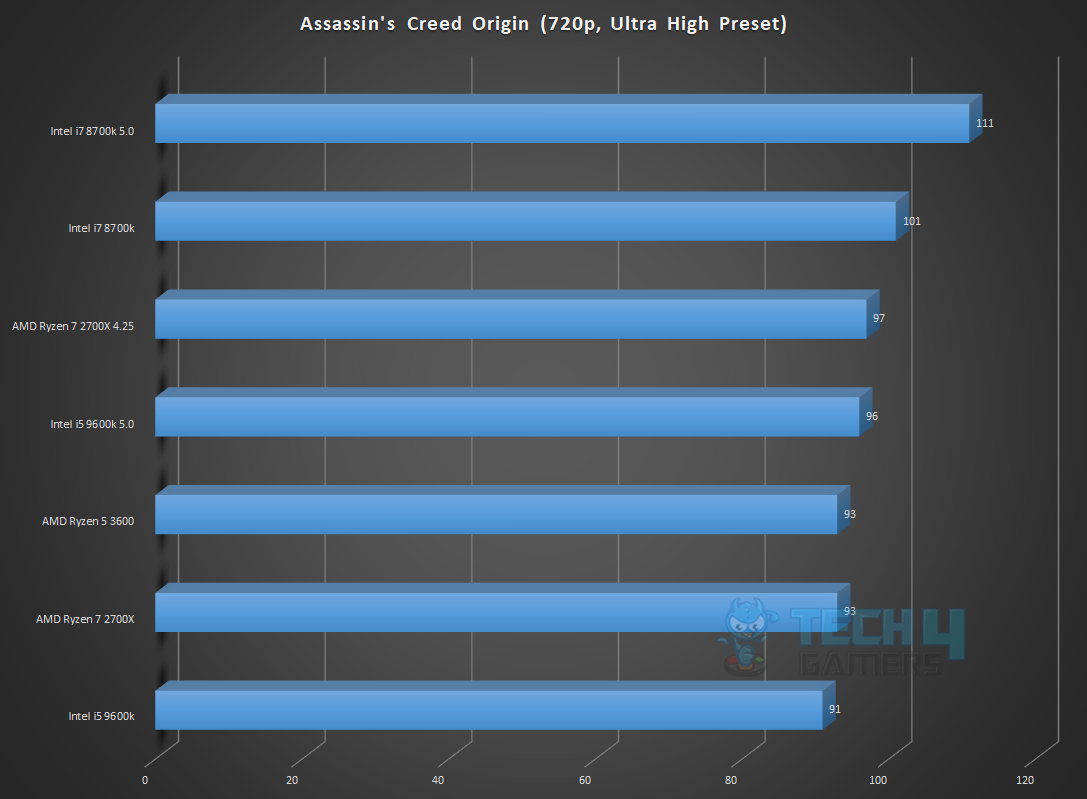
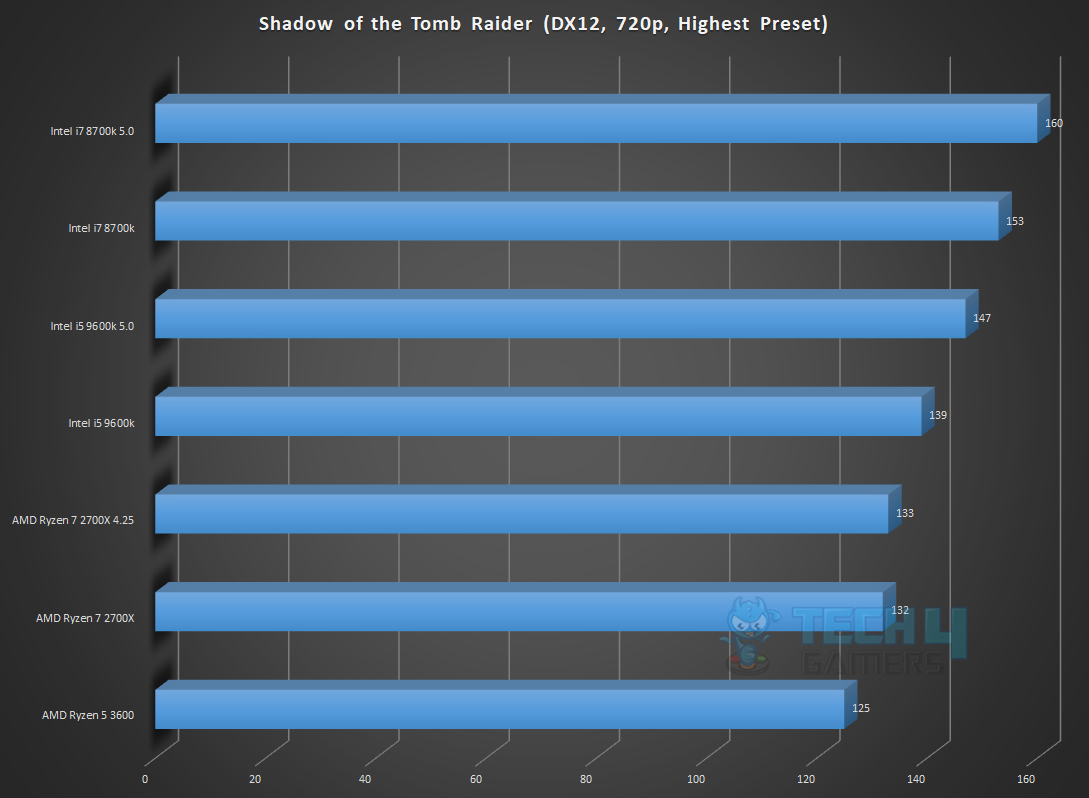
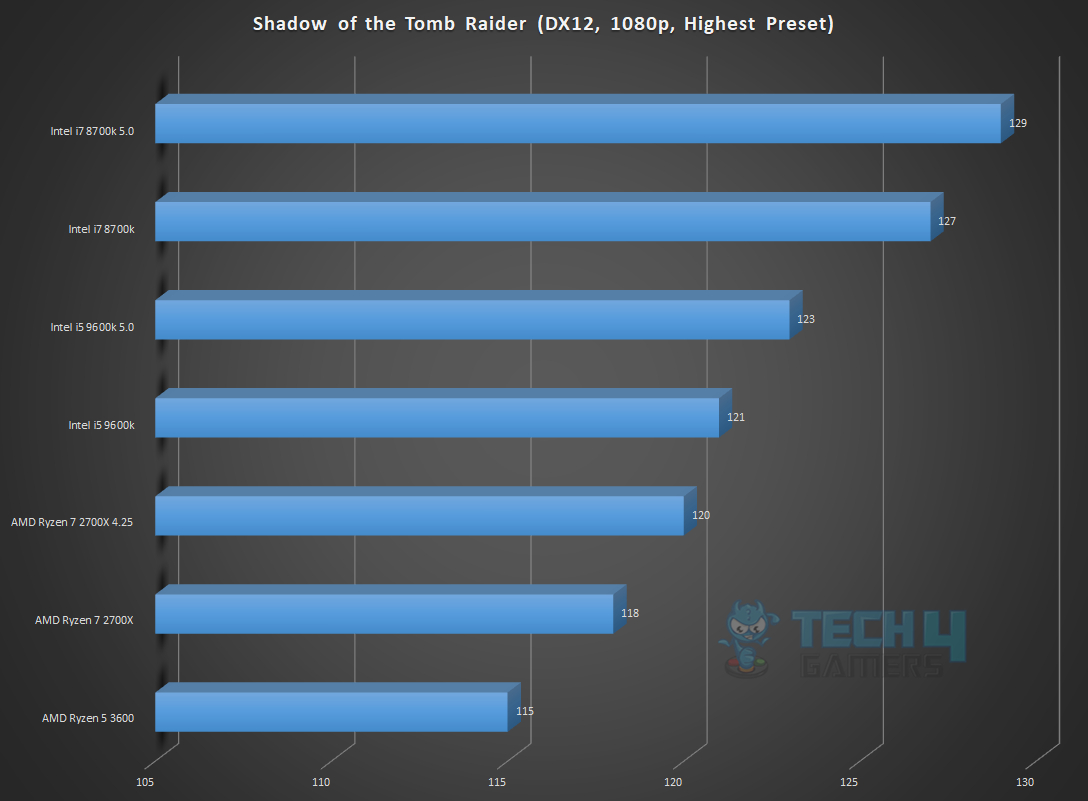
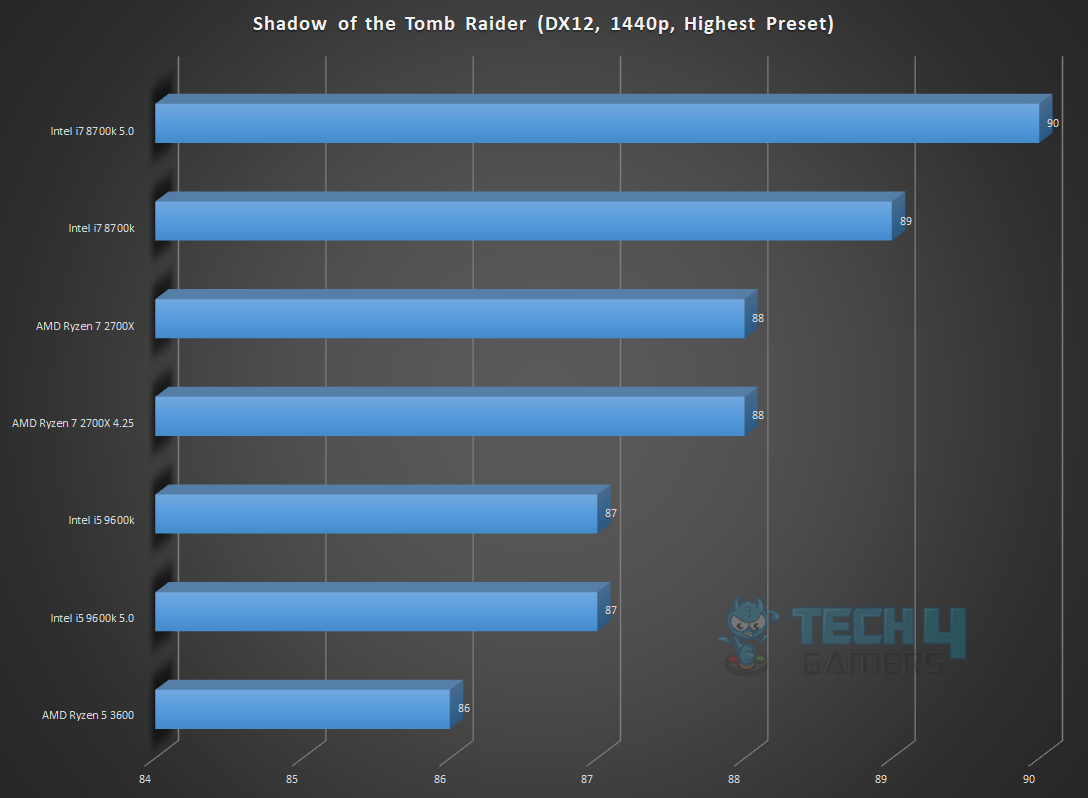
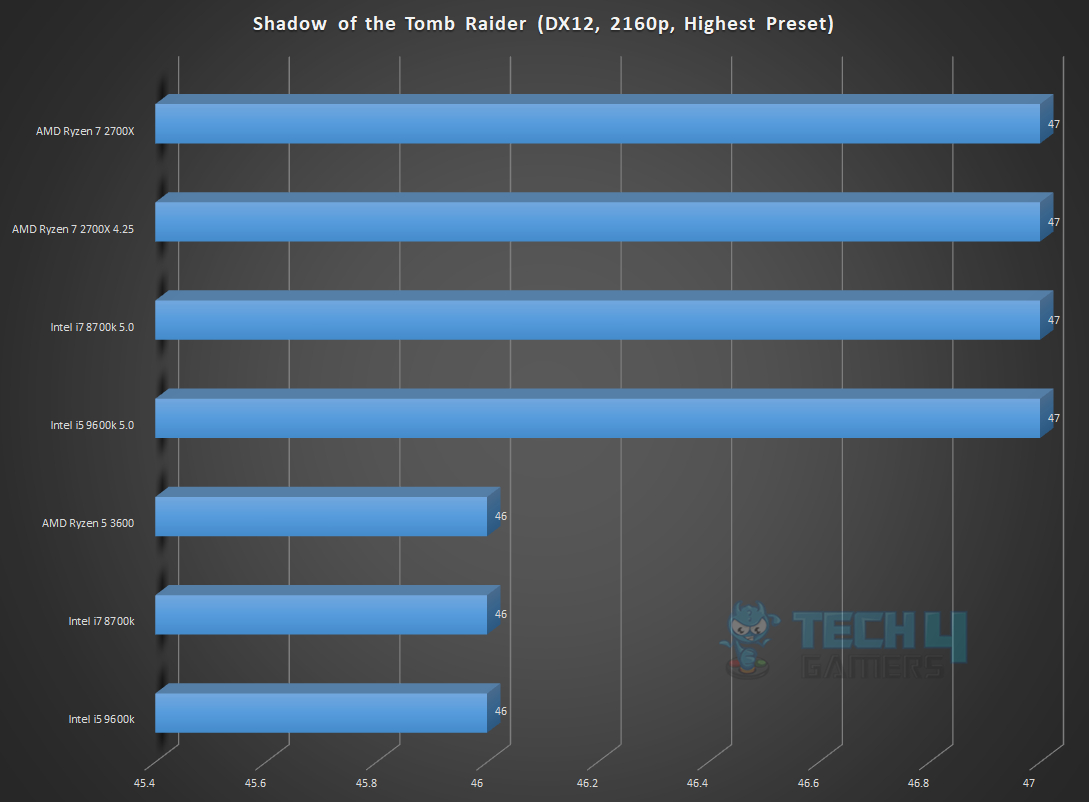
As we know, on lower resolutions, the gaming is more CPU-bound (relatively), so I have also tested the gaming performance on 720P. It is there only to show the relative performance measure. For true gaming performance in terms of who is playing at what resolution, 1080p and higher is where the gamers are. These resolutions are also present in the graphs. The average FPS is reported on the graphs. MSI AfterBurner version 4.62 has been used to bench the FPS.
Assassin’s Creed Origins
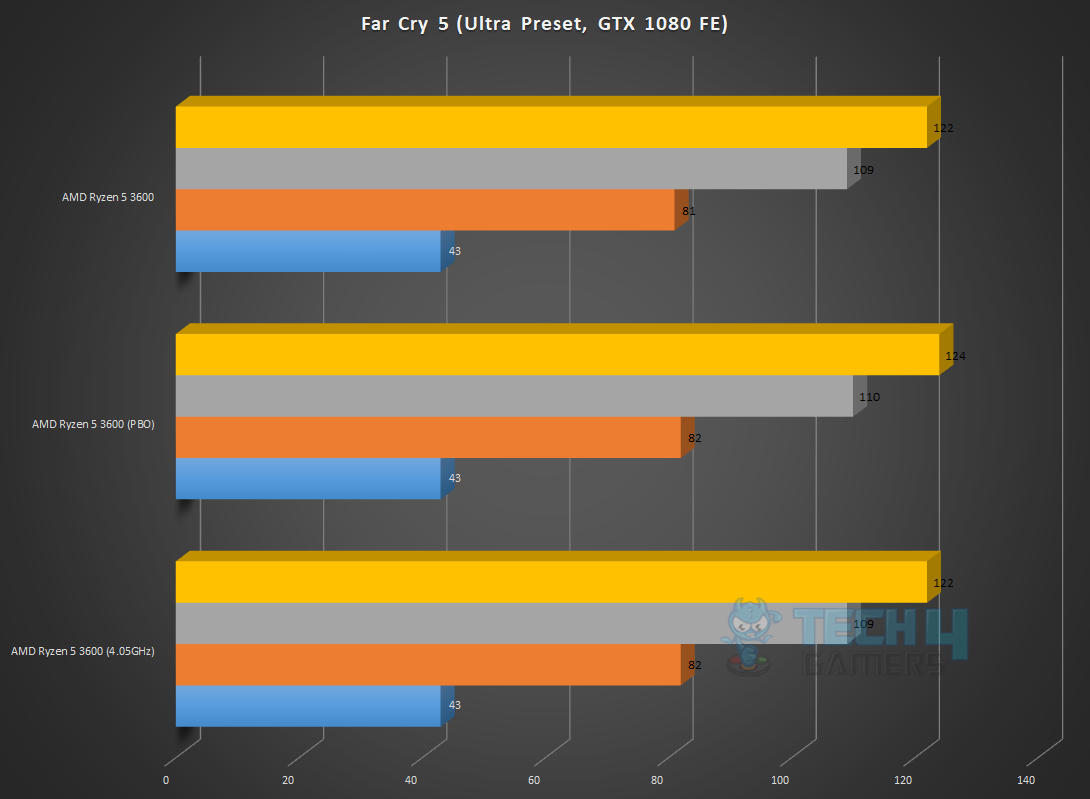
Far Cry 5

Grand Theft Auto – V

DOOM
Ashes of Singularity

Shadow of the Tomb Raider
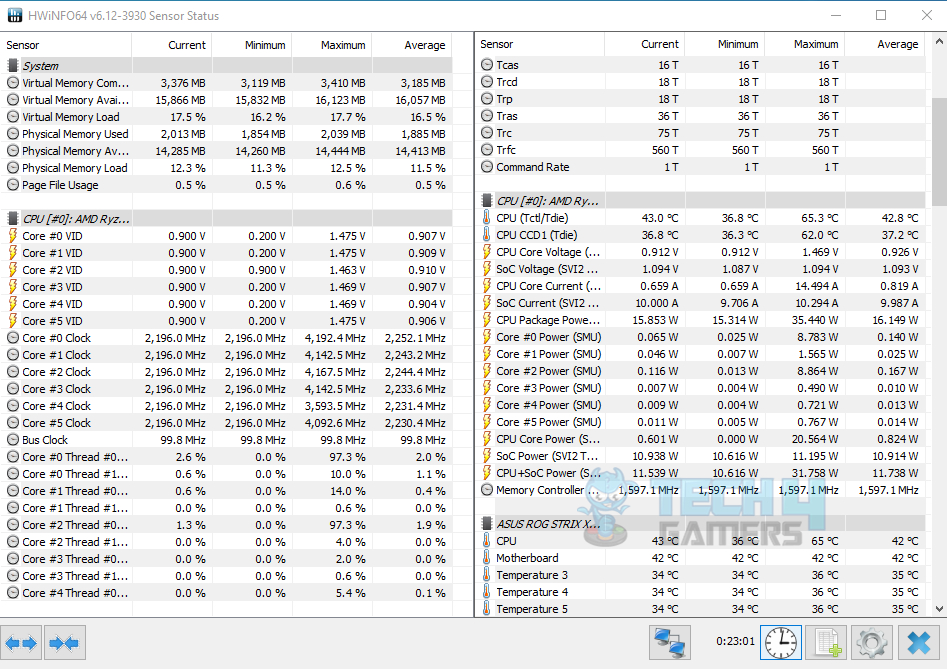
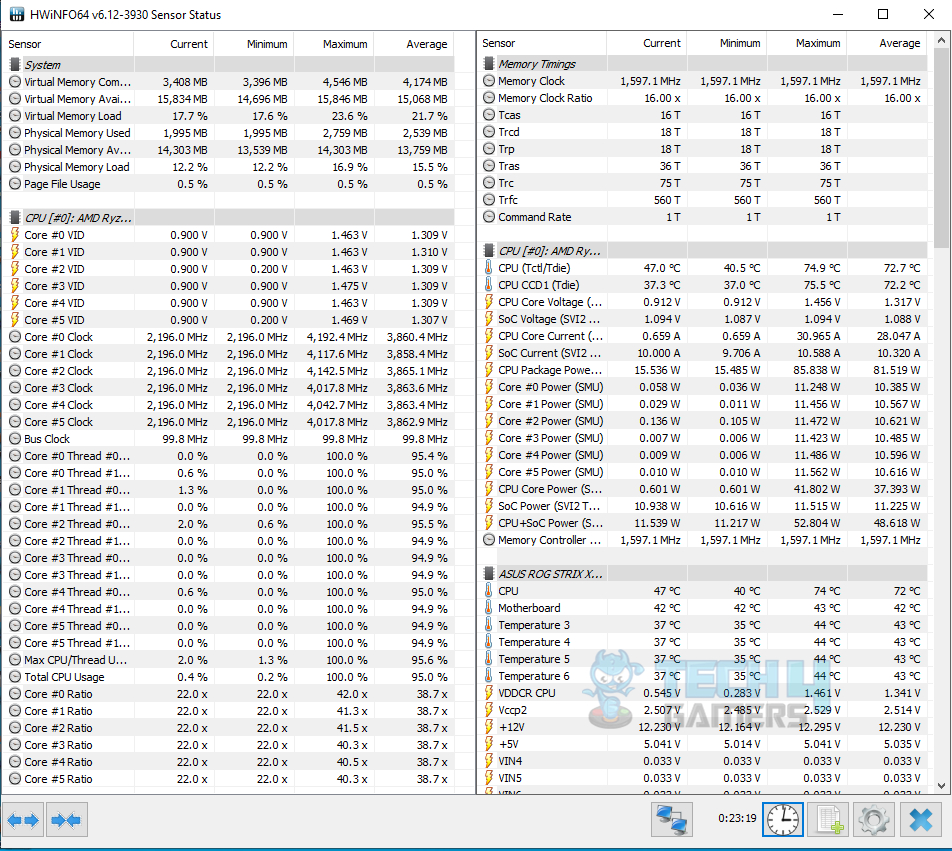
Turbo Frequency
- AMD Ryzen 5 3600, at stock settings, is primarily boosted to 4192MHz, occasionally briefly reaching 4200MHz on one core.
- Notably, AMD’s approach to turbo boost frequency differs from Intel’s, focusing strictly on a single core, as confirmed by AMD Ryzen Master.
- Unlike Intel, AMD bins chips on a core-wide basis, aligning with the Ryzen 3000 series CPUs that often reach maximum performance out of the box, leaving minimal room for overclocking.
- AMD emphasizes that various factors, including voltage, current, ambient temperature, thermal paste application, and cooling solution, influence a core’s ability to reach turbo boost frequency.
- Users reported issues with turbo boost frequencies, with an update addressing some concerns, providing up to a +50MHz increase in boost clocks.
- Workload balancing impacts turbo boost frequency, with users expected to experience rated frequencies briefly during single loads. At the same time, heavy multi-load scenarios may vary due to smart algorithms adjusting parameters based on loads, thermals, and voltages.
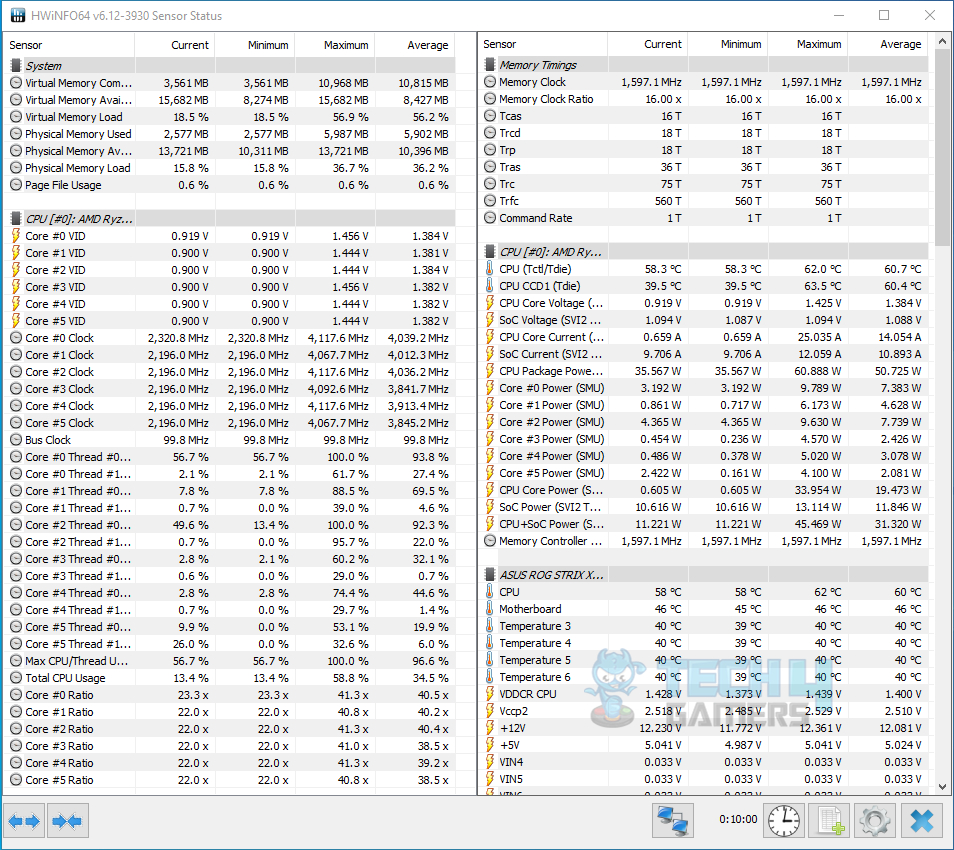
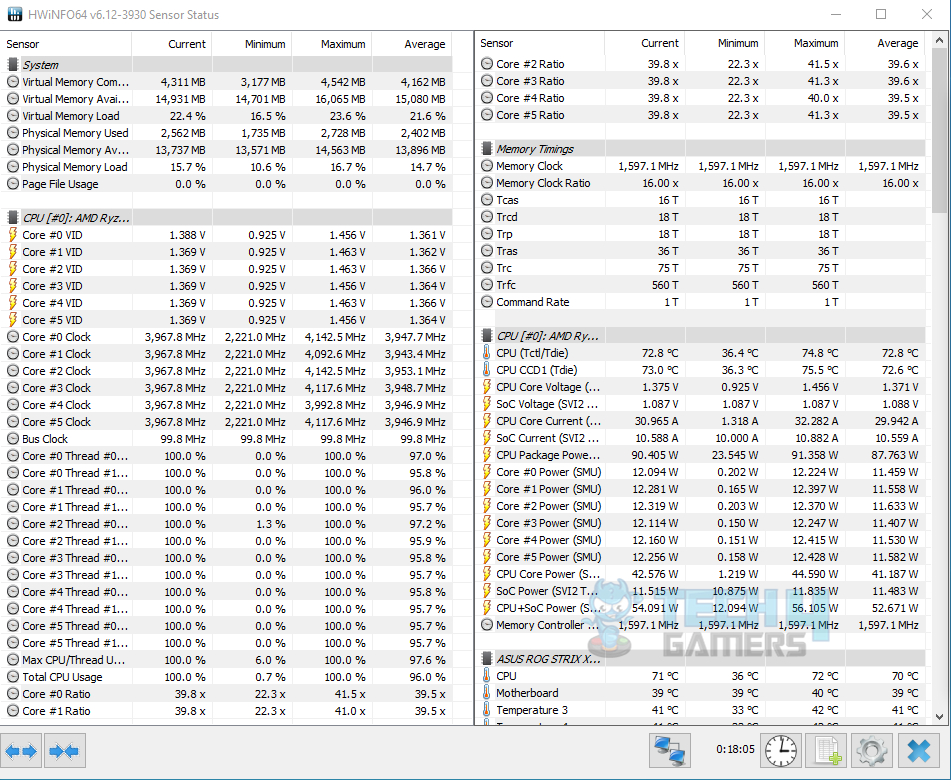
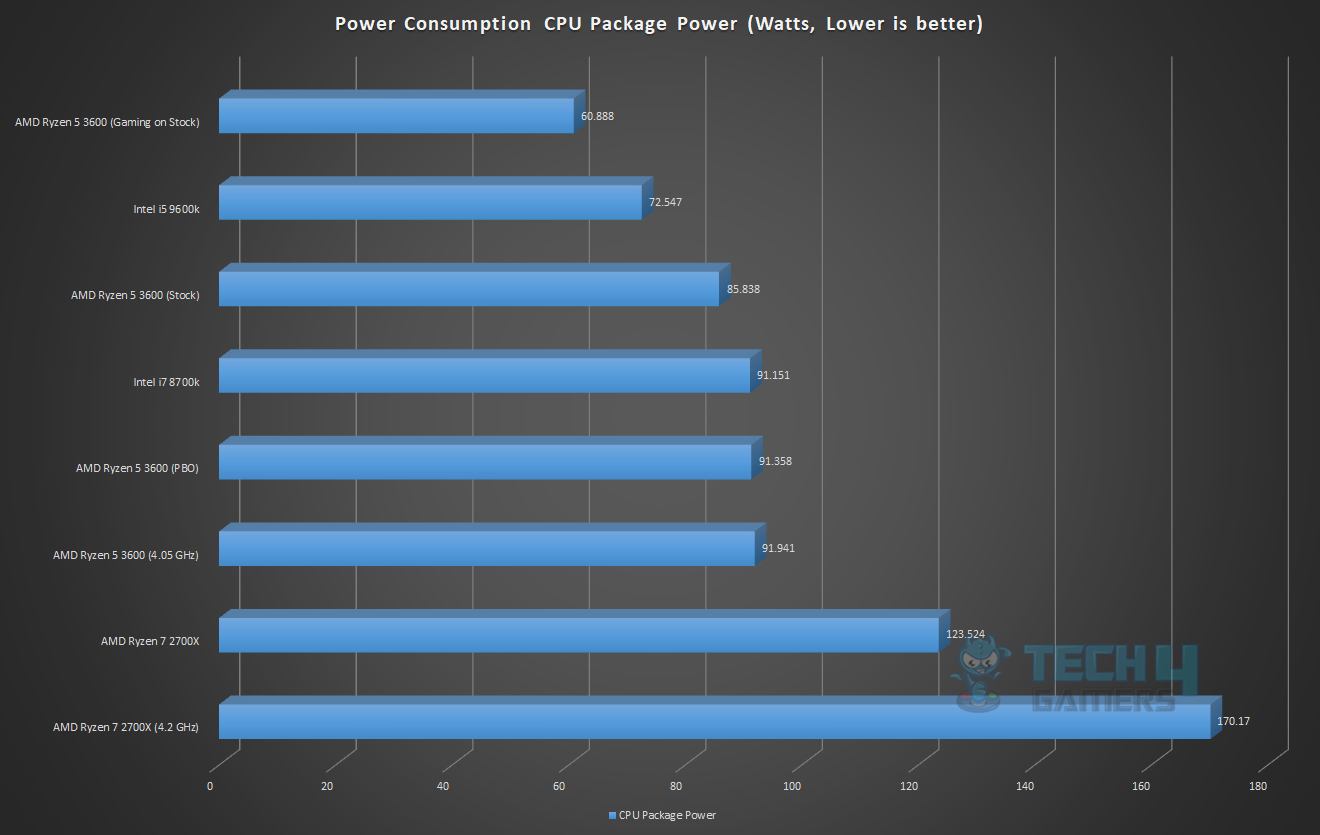
Thermal, Power, and Overclocking
My Asus Strix X470-F Gaming motherboard delivered an excessive 1.475V on stock settings, surpassing the necessary voltage. With the AMD Ryzen 5 3600 nearing its silicon performance peak, achieving an all-core overclock higher than the single-core turbo boost frequency proved challenging.
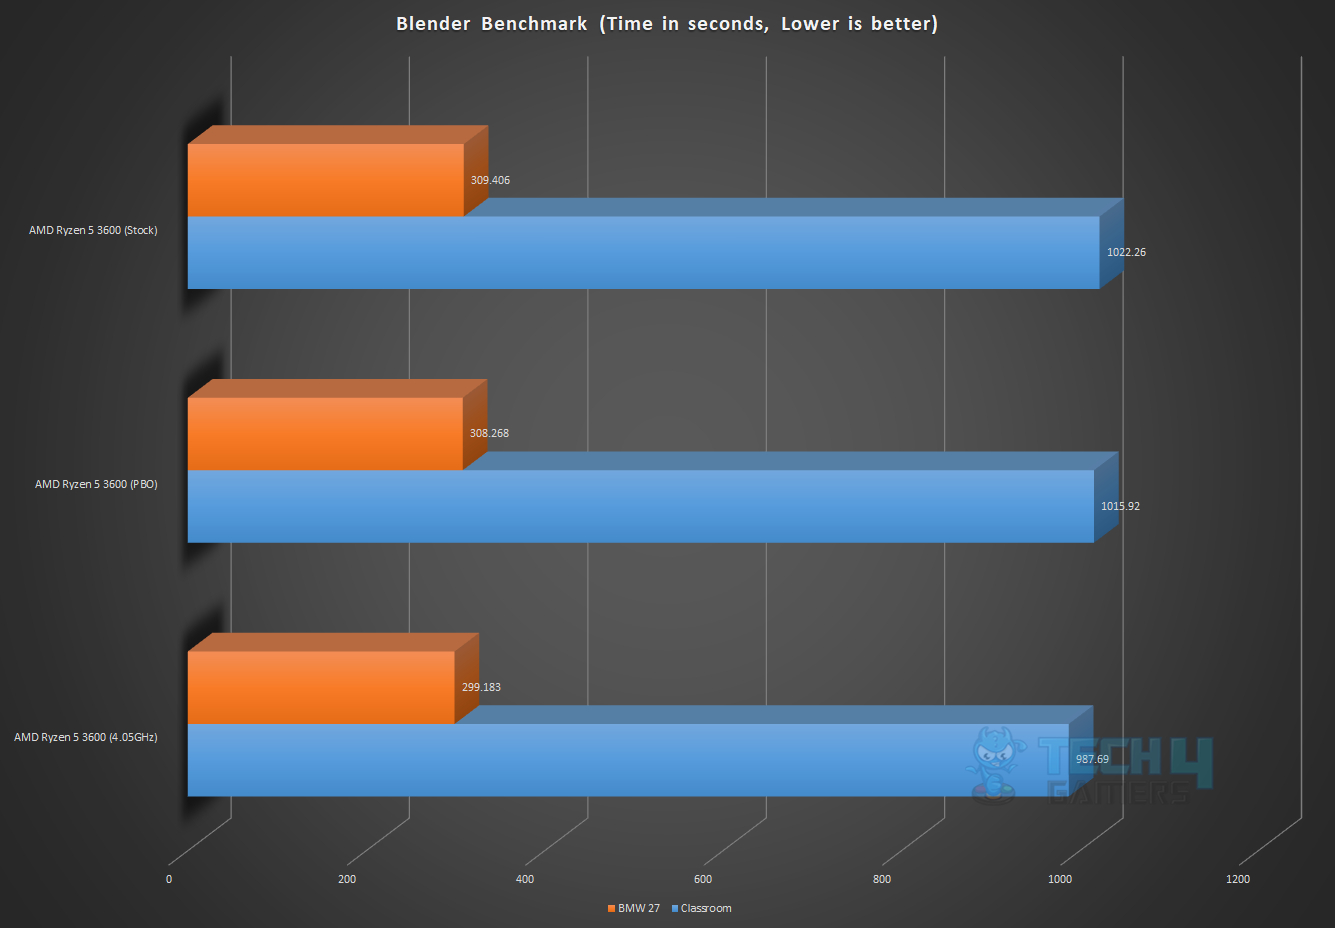
Precision Boost Overdrive (PBO) proved optimal for maximizing chip performance and acknowledging silicon variability in this scenario. Stress tests with Blender, CineBench R15/20, and Far Cry 5 showed stable results at 4050MHz on all cores with Level 3 LLC. Attempts to push the clock further led to system instability or failure to boot.
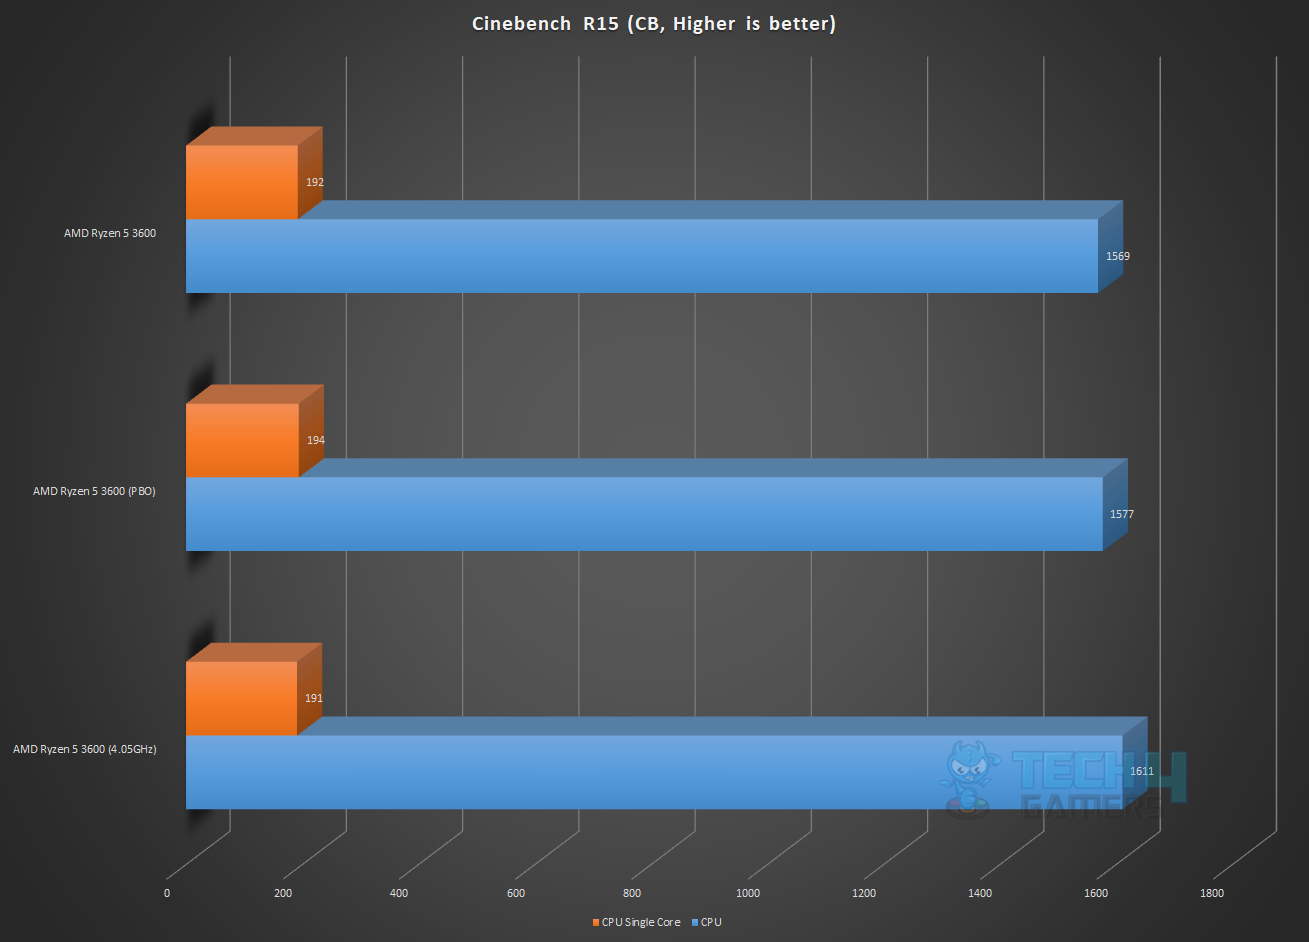
Results
Here are the graphs showing the results with stock settings, PBO, and manual overclocking:

Should You Buy It?
After thoroughly testing the Ryzen 5 3600, should you get it?
Buy It If
You need Cost-Effective performance: Priced at $199.99, the AMD Ryzen 5 3600 offers excellent value for budget-conscious users.
You need an Overclocking-enabled processor: The unlocked Core Multiplier of the AMD Ryzen 5 3600 allows overclocking, providing users with customization options for enhanced performance.
You crave a competitive gaming processor: In testing, the Ryzen 5 3600 competes well with Intel i7 8700k and i5 9600k, showcasing impressive gaming performance.
Don’t Buy It If
You need an iGPU: The Ryzen 5 3600 lacks integrated graphics, requiring users to have a dedicated GPU for display.
You need a powerful Cooler: While the Ryzen 5 3600 bundled cooler is sufficient for 65W TDP, users aiming for more aggressive overclocking may need an aftermarket cooling solution.
You don’t want limited PCIe lanes: The AMD Ryzen 5 3600 provides 16 PCIe lanes, which may be limiting for users with extensive expansion requirements.
Conclusion
The AMD Ryzen 5 3600, part of the Matisse lineup, impressed me with its Zen2 microarchitecture. This non-X version offers overclocking potential, featuring 6 cores, 12 threads, and a base frequency of 3600MHz (up to 4200MHz turbo). Priced at $199.99, the chip lacks integrated graphics but includes a capable Wraith Stealth Cooler.
It stands out in the budget segment with PCIe gen 4.0 support, dual-channel DDR4-3200 memory, and 16 PCIe lanes. AMD’s dedicated I/O chip enhances efficiency. In my tests, it competes well with Intel’s i7 8700k and i5 9600k, showcasing impressive gaming performance. Improved DRAM scalability and a bundled cooler make it a compelling all-rounder.
- December 11, 2023: A few text changes to improve readability.
Thank you! Please share your positive feedback. 🔋
How could we improve this post? Please Help us. 😔
[Hardware Reviewer]
Awais Khan is a Tech Geek, conscientious, reliable, and hardworking individual who pays attention to detail with excellent time management skills. Alongside that, he is an expert in PC Hardware; dealing with Benchmarks, Analysis, and testing before sharing information with readers. Whenever free, Awais occasionally shares Gaming Videos on his YouTube Channel.
Get In Touch: awais@tech4gamers.com


