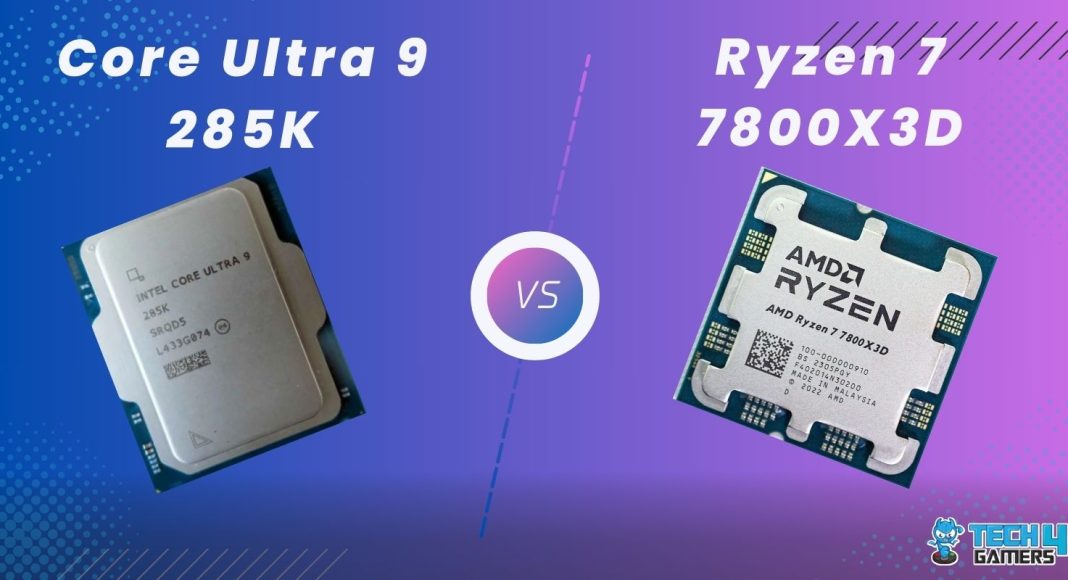
Intel Core Ultra 9 285K Rated: 8.4/10 AMD Ryzen 7 7800X3D Rated: 9/10
Pros and Cons
| CPU | Pros | Cons |
|---|---|---|
| Core Ultra 9 285K | ✅ 8 more physical cores ✅ Built on advanced 3nm process | ❌ Higher power consumption ❌ More costly |
| Ryzen 7 7800X3D | ✅ Larger L3 cache for gaming ✅ Lower power consumption | ❌ Weaker integrated GPU ❌ Slightly lower clock speeds |
Comparison Table
| Feature | Core Ultra 9 285K | Ryzen 7 7800X3D |
|---|---|---|
| Instruction Set | x86-64 | x86-64 |
| Codename | Arrow Lake | Zen 4 (Raphael) |
| Integrated GPU | Arc Xe2 (Arrow Lake-S) | AMD Radeon™ Graphics |
| GPU Boost Clock | 2000 MHz | - |
| Shading Units | 512 | - |
| Best Motherboards | - | Motherboards for Ryzen 7 7800X3D |
| Best CPU Coolers | - | Best Coolers for Ryzen 7 7800X3D |
| Processor Review | Core Ultra 9 285K Review | Ryzen 7 7800X3D Review |
Architectural Differences
- Core Count: The Ultra 9 285K has 8 P-Cores and 16 E-Cores, while the 7800X3D has only 8 P-Cores without any E-Cores, resulting in a total of 24 threads for Intel and 16 threads for AMD.
- Clock Speed: Intel has a base clock of 3.2 GHz on the E-Cores which at a boost can go as far as 5.7 GHz on the P-Cores. Ryzen 7800X3D however starts at a base clock of 4.2 GHz up to 5 GHz when boosted.
- Cache: The Ultra 9 boasts a 36 megabyte L3 cache, while the Ryzen 7 offers a 96 megabyte L3 cache, optimized for more enhanced gaming performance.
- Process Node: The Core Ultra 9 is built on an advanced 3nm manufacturing process, a smaller node compared to Ryzen’s Zen 4 architecture, which is based on TSMC’s 5nm technology.
- TDP: Intel’s Core Ultra 9 285K has a 125-watt PL1 TDP, while the Ryzen 7 7800X3D has a slightly lower TDP of 120 watts, highlighting AMD’s efficiency advantage.
Intel’s Core Ultra 9 285K steps into the ring with a focus on efficiency and multi-core performance, but can it take on AMD’s gaming powerhouse, the Ryzen 7 7800X3D? Here we’ll pin Core Ultra 9 285K against Ryzen 7 7800X3D and see if Intel can challenge AMD’s chip in both gaming and workload efficiency.
Gaming Benchmark – 1080p
To have a better understanding of these processors’ performance, it is important to consider how well they function in a gaming setting. For this, we tested 6 games at 1080p using both Intel’s Core Ultra 9 285k and AMD’s Ryzen 7 7800X3D on a test bench with specifications as follows:
Test Bench
- OS – Windows 11
- CPU Cooler – Enermax LiqMaxFlo 360mm
- Graphics Card – GIGABYTE RTX 4090 Gaming OC 24G
- SSD – Sabrent Rocket 4 Plus G 2TB
- Power Supply – CORSAIR HX Series HX1200i 1200W
- Mobo (AMD) – MSI MPG X670 Carbon WiFi Review
- Mobo (Intel) – MSI MPG Z890 Tomahawk WiFi Review
Ghost of Tsushima

- On the 7800X3D, we’re looking at an average of 192 FPS, which comes in about 7.2% higher than the Core Ultra 9 285K’s 179 FPS, a pretty decent headstart for the Ryzen processor.
- However, if we look at the 1% lows, the Ryzen 7 7800X3D hits 122 FPS, which is about 10% lower than the Core Ultra 9 285K’s 134 FPS. This means that Intel still managed to take a lead in 1% lows despite having a lower average framerate.
Red Dead Redemption 2

- The 7800X3D keeps the average framerate advantage here, hitting 194 FPS, about 7.8% more than the Ultra 9 285K’s 180 FPS, which is a comfortable lead, giving a more consistently high framerate.
- As for the lows, the Ryzen 7 7800X3D holds strong with a minimum of 149 FPS, a pretty noticeable 28.5% improvement over Core Ultra 9 285K’s 116 FPS, amounting to some serious smoothness during the game’s more demanding scenes.
Starfield

- Averaging 140 FPS, the 7800X3D falls just behind the Ultra 9’s 146 FPS, about 4.3% slower. Surprisingly, Intel nudges ahead in average FPS here, though the difference is minor.
- When it comes to the 1% lows, Ryzen comes in at 88 FPS, around 6% higher than Intel’s 83 FPS. So, while both do well, AMD has a small edge in those minimum frames.
Forza Horizon 5

- In Forza Horizon 5, the average framerate for Ryzen sits at 275 FPS, which is just a slight 1.9% faster than the Core Ultra 9’s 270 FPS.
- When it comes to 1% lows, AMD hits 198 FPS, which is about 5.9% higher than Intel’s 187 FPS, meaning less chance of a stutter during fast-paced racing.
Cyberpunk 2077

- Here, the AMD’s chip got an average of 134 FPS, so it’s holding a 6.4% lead over Intels’s 126 FPS.
- For 1% lows, Ryzen is at 82 FPS, ahead of Intel’s 75 FPS by 9.3%. This means those busy, bustling city moments might feel just a bit smoother on the AMD chip.
The Witcher 3

- With 7800X3D, we’re averaging 106 FPS—about 3.9% faster than Intel’s 102 FPS. A small boost, but it’s enough to make Geralt’s world feel a bit smoother on Ryzen.
- On the 1% lows however, Ryzen is clocking in at 76 FPS, compared to Intel’s 55 FPS, which amounts to a whopping 38% better performance by Ryzen in those minimum frames.
Productivity Benchmarks
Regarding productivity, we tested a number of applications to get a sense of how these architectural differences would pan out for both processors if all other variables remained the same.
Cinebench R24

- In single-core performance, the Ultra 9 285K takes the lead with a score of 150, marking a 25% advantage over the 7800X3D’s score of 120. This difference gives Intel an edge in tasks that rely on single-core speed.
- When it comes to multi-core performance this gap widens drastically as Core Ultra 9 285K scores 2526, a whopping 126% higher than the Ryzen 7 7800X3D’s score of 1118, meaning that those extra cores really come in handy.
Adobe Photoshop

- In Photoshop’s Pudget benchmark, the AMD chip scored 10,983, just 0.72% above Intel’s 10,904. It’s a very insignificant difference so you’re likely to see similar results for both chips in photo editing.
7-Zip

- For compression, Ultra 9 285K scored 201,603 MIPS per watt, giving it a big edge over the 7800X3D’s 112,865, which translates to about 78.6% more efficiency which could be a significant time-saver for frequent compression.
- In decompression, Ultra 9 285K stays in the lead with 193,103 MIPS, about 46% faster than the 7800X3D’s 132,479. If decompression speed is a priority, Intel again has a clear upper hand.
Overall Performance
Average FPS
Our testing showed that Ryzen 7 7800X3D had a clear advantage here, leading to an average framerate 3.7% higher than Intel. However, in games such as Starfield, Intel outperformed AMD with a 4.3% average lead, which wasn’t much but still a noticeable edge.
1% Lows
As for the 1% lows. capturing those critical drops in performance, Ryzen again led with a performance 9.6% higher than that of Intel. Surprisingly enough, Intel did claim a decent edge in Ghost of Tsushima with a 9.8% lead in 1% lows but this was pretty much as far as it went.
Productivity
In productivity benchmarks, the Core Ultra 9 285K outperforms the Ryzen 7 7800X3D in most areas, especially in multi-core tasks. While both perform similarly in Photoshop, Intel leads in applications like Cinebench and 7-Zip, showing an overall advantage of 12%, making it the stronger option for productivity workloads.
Power
| Game | Ryzen 7 7800 X3D | Core Ultra 9 285K |
|---|---|---|
| Ghost of Tsushuima | 57 | 61 |
| Red Dead Redemption 2 | 68 | 95 |
| Cyberpunk 2077 | 76 | 114 |
| The Witcher | 66 | 90 |
| Forza Horizon | 68 | 92 |
| Starfield | 82 | 130 |
| Average Power Draw | 69.5⚡ | 97⚡ |
| Winner: Ryzen 7 7800X3D |
Ryzen 7 7800X3D consistently outperforms the Core Ultra 9 285K in power efficiency, drawing 33% less power on average. This is especially noticeable in demanding games like Starfield, where Ryzen shows a 36.9% power efficiency advantage, highlighting its superior performance-per-watt despite Intel’s efficiency claims.
Thermal Efficiency
| Game | Ryzen 7 7800X3D | Core Ultra 9 285K |
|---|---|---|
| Ghost of Tsushuima | 51 | 46 |
| RDR2 | 58 | 53 |
| Cyberpunk 2077 | 66 | 57 |
| The Witcher | 58 | 56 |
| Forza Horizon | 58 | 57 |
| Starfield | 69 | 61 |
| Average Temperatures | 60🌡️ | 55🌡️ |
| Winner: Core Ultra 9 285K |
When it came to the thermal efficiency of both chips the difference wasn’t that drastic although the Intel Core Ultra 9 285K still had an advantage of over 8.7% lower temperatures as compared to the Ryzen chip.
Price
| CPU | Launch MSRP | Current Price |
|---|---|---|
| Ryzen 7 7800 X3D | 💲449 | 💲479 |
| Core 9 Ultra 285K | 💲589 | 💲630 |
| Price Difference | 31% | 32% |
This indicates that even at the current price, the Intel chip is around 32% costlier for not a whole lot to offer at this difference. However, these prices are not set in stone and are subject to change based on market fluctuations.
What We Recommend
Intel’s Core Ultra 9 285K: After thoroughly testing its capabilities from both gaming and productivity standpoints, it is apparent that the only place Intel’s chip has an advantage is the productivity side of things. Intel’s chip is therefore ideal if the only objective is to maximize productivity without worrying about cost or power use.
AMD Ryzen 7 7800X3D: On the other hand, AMD’s chip showed us a consistently decent performance given its unmatched gaming prowess as well as its excellent power efficiency all to come for a way lower price tag.
Considering the productivity difference, the comparison becomes not-so-unanimous indeed; however, AMD’s Ryzen 7 7800X3D still outshines Intel’s chipset in almost every other way, making it a more reasonable choice, hence taking the recommendation.
No, the Ryzen 7 7800X3D cannot be overclocked because of the restrictions it has with 3D V-Cache technology. Yes, Core Ultra 9 285K is an unlocked Intel processor and therefore can be overclocked. Yes, driver updates and BIOS optimizations can help Core Ultra 9 285K slightly improve its performance in the future. The time it takes to load a game depends more on your storage solution than the processors. Both processors are fully compatible with PCIe 5.0 however Intels expansion slots could make it slightly more compatible for high-end upgrades. FAQs
More From Core Ultra 9 285K:
- Core Ultra 9 285K vs Ryzen 9 9950X
- Core Ultra 9 285K Vs Core Ultra 7 265K
- Core Ultra 9 285K vs Ryzen 9 7950X3D
More From Ryzen 7 7800X3D:
Thank you! Please share your positive feedback. 🔋
How could we improve this post? Please Help us. 😔
[Comparisons Specialist]
I’m a passionate computer hardware expert specializing in CPUs and GPUs. With a lifelong curiosity for hardware and extensive hands-on experience, I provide valuable insights, practical advice, and in-depth analysis on these components. Engaging with the hardware community, I exchange knowledge and stay at the forefront of technological advancements.
Get In Touch: uzair@tech4gamers.com



![i7-12700K Vs i5-13600K [We Tested Both] i7-12700K Vs i5-13600K](https://tech4gamers.com/wp-content/uploads/2024/11/i7-vs-i5-218x150.jpg)
