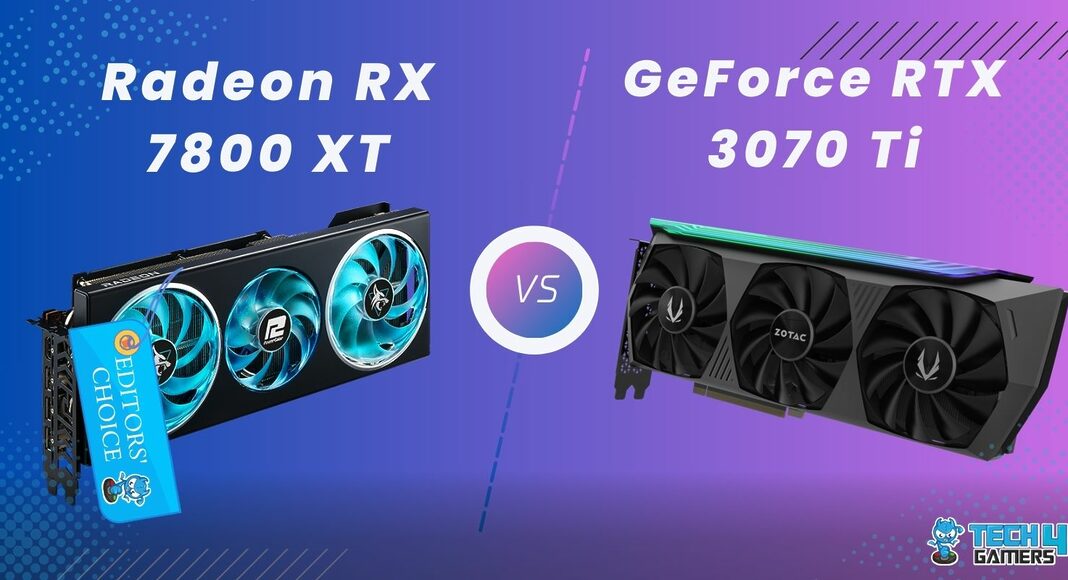
AMD Radeon RX 7800 XT
Rated: 8/10
Nvidia GeForce RTX 3070 Ti
Rated: 8/10
Pros & Cons
| Graphics Card | Pros | Cons |
|---|---|---|
| RX 7800 XT | ✅ Better performance ✅ More advanced processing nodes ✅Larger VRAM buffer | ❌Higher price |
| RTX 3070 Ti | ✅ Lower price ✅Slightly better thermal performance | ❌Lower performance ❌Small VRAM buffer |
- In our performance testing, the RX 7800 XT performed around 41% better at 4k than the RTX 3070 Ti, which puts both of these cards in different tiers of performance.
- Our thermal performance measurements showed the RTX 3070 Ti to be around 1.% cooler on average, which is a difference most people should not concern themselves with.
- The difference in price between the RTX 3070 Ti and RX 7800 XT matches the difference in performance between the two cards, giving them an equivalent price-to-performance ratio.
- Because both graphics are matched in terms of features and they both have a linear scaling to their price, the decision between these two cards relies only on your budget.
Comparison Table
| Feature | AMD RX 7800 XT | Nvidia GeForce RTX 3070 Ti |
|---|---|---|
| Shading Units | 3840 (Stream Processors) | 6144 (CUDA Capability: 8.6) |
| Ray Tracing Cores | 60 | 48 |
| Memory Interface Width | 256-bit | 256-bit |
| Bandwidth | Up to 624 GB/s | Up to 608.3 GB/s |
| Memory Clock / Speed | 2525 MHz | 1188 MHz |
| Launch Date | Sep 06th, 2023 | Oct 15th, 2022 |
| MSRP | $499 | $599 |
| Best Variants | Best RX 7800 XT Graphics Cards | Best RTX 3070 Ti Grahpics Cards |
Architectural Differences
- Clock Speed: The RX 7800 XT has a base clock of 1295MHz, lower than the RTX 3070 Ti’s 1575MHz. Its boost clock is 2430MHz, considerably higher than the RTX 3070 Ti’s 1770MHz.
- VRAM: The RTX 3070 Ti has 8GB GDDR6X memory on a 256-bit bus. In contrast, the RX 7800 XT doubles the VRAM to 16GB using GDDR6 memory on the same bus.
- Process Node: The newer Radeon card uses a 5nm process size from TSMC, while the older card uses a less complex 8nm process size from Samsung, which is significantly less power efficient.
- TDP: The newer card also boasts a smaller 263-watt TDP, while the RTX 3070 Ti is rated for a TDP of 290 watts.
- Other Differences: Both cards are virtually matched in terms of features, with AMD helping its rival out by making all of its performance-enhancing features like FSR and Fluid Motion Frames open source.
The glory of the RTX 30 series of cards was cut short because of the GPU shortage, but how does it hold up now that we’ve left that behind in the past? Join us in the RX 7800 XT vs RTX 3070 Ti comparison to gauge the performance of these two midrange cards!
Gaming Benchmarks – 4K
Now that we understand the workings of these cards, this part of the RX 7800 XT vs RX 3070 Ti comparison will focus on the performance of these graphics cards in popular modern games. We have done all our testing using a test bench, the specifications of which you can take a look at below:
Test Bench
- CPU – AMD Ryzen 9 5900X
- Motherboard – MSI MPG X570S Carbon MAX WiFi
- Memory – Vengeance RGB Pro 16GB (2x8GB) DDR4 3600MHz C18
- CPU Cooler: Arctic Liquid Freezer II 360mm AIO
- Power Supply: be quiet! Dark Power Pro 13 1300W
Cyberpunk 2077

- Boasting an average framerate of 49 FPS, the RX 7800 XT outperformed the RTX 3070 Ti by approximately 60% in Cyberpunk 2077 under maximum graphics settings. The RTX 3070 Ti, in contrast, averaged around 32 FPS.
- The 1% lows of the RX 7800 XT were a smooth-ish 43 FPS, while the RTX 3070 Ti gave a sub-par performance by only outputting 25 FPS in hard-to-render moments of this title.
Assassin’s Creed Valhalla

- The RTX 3070 Ti had an average framerate of around 63 FPS in our test of AC: Valhalla, which is around 49% slower than the 94 FPS average of the RX 7800 XT.
- In our short benchmark, the RX 7800 XT had 1% lows of around 70 FPS, while the RTX 3070 Ti once again fell short with minimums of around 58 FPS.
Watch Dogs Legion

- In this demanding Ubisoft game, the RTX 3070 Ti struggled at an average framerate of 55 FPS, while the RX 7800 XT excelled with 79 FPS, leading by 44%.
- The 1% lows of the RTX 3070 Ti danced around 41 FPS when there was a lot of action on screen, while the RX 7800 XT had lows of around 67 FPS.
Red Dead Redemption 2

- In Rockstar’s open-world RDR2, the RX 7800 XT achieved an average framerate of 87 FPS, surpassing the RTX 3070 Ti, which managed 60 FPS. The performance difference between the two cards was approximately 45%.
- The framerate of the RX 7800 XT fell to around 76 FPS from time to time in this game, while the RTX 3070 Ti had 1% lows of around 54 FPS, making for a stable gaming experience.
Doom Eternal

- In Doom Eternal at maxed-out settings and 4k resolution, the RTX 3070 Ti achieved an average framerate of 156 FPS, while the RX 7800 XT outperformed by around 40% with an average of 217 FPS.
- The 1% lows of the RX 7800 XT hit around 166 FPS, while the RTX 3070 Ti got bogged down to around 123 FPS in the more action-packed sequences of this game.
Horizon Zero Dawn

- The RX 7800 XT managed an average framerate of 102 FPS in the PC port of Horizon Zero Dawn, while the RTX 3070 Ti had an average framerate closer to 73 FPS, which counted as a 40% lead for the RX 7800 XT.
- The 1% lows hovered around 75 FPS on the RX 7800 XT, while the RTX 3070 Ti had lows of around 64 FPS in our benchmark of this title.
A Plague Tale Requiem

- On high graphics settings, the RX 7800 XT achieved 57 FPS, outperforming the RTX 3070 Ti at 39 FPS, securing a lead of about 46% in our benchmark tests of A Plague Tale Requiem.
- Finally, the 1% lows of the RX 7800 XT were around 47 FPS in this game, while the RTX 3070 Ti plateaued at an unpleasant 29 FPS in performance-intensive sections of this game.
Overall Gaming Performance
| Featured | RTX 3070 Ti | RX 7800 XT |
|---|---|---|
| Average FPS | 68 📈 | 98 📈 |
| %1 lows | 56 📉 | 78 📉 |
| Winner: AMD's RX 7800 XT | ||
In our testing, the RX 7800 XT demonstrated a 43% average speed advantage over the RTX 3070 Ti in games at 4k resolution. The RTX 3070 Ti was struggling in certain games. The 1% lows further emphasized the performance difference, with a 38% gap. We did not include RT gaming to keep the tests suited to a general audience.
Temperatures
| Game | RX 7800 XT (°C) | RTX 3070 Ti (°C) |
|---|---|---|
| Cyberpunk 2077 | 72 | 72 |
| Assassin's Creed Valhalla | 72 | 69 |
| Watch Dogs Legion | 68 | 66 |
| Red Dead Redemption 2 | 71 | 66 |
| Doom Eternal | 70 | 78 |
| Horizon Zero Dawn | 71 | 67 |
| A Plague Tale Requiem | 70 | 68 |
| Average Gaming Temperature | 70.5 | 69.4 |
| Winner: Nvidia's GeForce RTX 3070 Ti | ||
There was only a minor difference between the thermal performance of these two cards. The RX 7800 XT ran around 1.6% hotter than the RTX 3070 Ti, which is not a difference most people would concern themselves with.
The performance difference between these two cards is even more apparent in synthetic benchmarks. The RX 7800 XT had a 71% improvement over the RTX 3070 Ti with a score of 37320 points, whereas the Nvidia card scored 21750 points.
– Shehryar Khan
Price And Availability
| GPU | MSRP | Current Price |
|---|---|---|
| RX 7800 XT | 💲499 | 💲499 |
| RTX 3070 Ti | 💲599 | 💲349 |
| Difference | 20% | 43% |
When we checked the current price of these graphics cards on PCPartPicker, we saw that most listings of the RTX 3070 Ti were significantly more than its launch MSRP, but from some digging on eBay, we could find a handful of deals on this card for around $349. This makes the RTX 3070 Ti around 43% cheaper than the RX 7800 XT.
What We Recommend
RTX 3070 Ti: The RTX 3070 Ti offers strong performance at a reasonable price, though it faces challenges at 4k gaming. Its notable drawback lies in the small VRAM buffer, which may become insufficient as modern games increase their VRAM demands.
RX 7800 XT: The RX 7800 XT offers strong 4K performance, standing out in a market of overpriced GPUs. While its appeal diminishes against more reasonably priced alternatives, it becomes a viable option for those with a higher budget, especially due to its driver-level upscaling and frame generation features.
To conclude, both the RTX 3070 Ti and RX 7800 XT have their own benefits, just at different price points. You will be happy with the purchase of either card according to your budget restraints.
FAQs
Yes, the RTX 3070 Ti uses a single 12-pin power connector, while the RX 7800 XT uses a dual 8-pin connector.
The RTX 3070 Ti supports OpenCL 3.0, whereas the RX 7800 XT supports OpenCL version 2.2.
Yes, the DisplayPorts on the RX 7800 XT are 2.1 instead of the 1.4a found on the RTX 3070 Ti, which means support for up to 188Hz 4K output instead of the 120Hz max refresh rate sustainable with DP 1.4a.
More From RX 7800 XT
More From RTX 3070 Ti
Thank you! Please share your positive feedback. 🔋
How could we improve this post? Please Help us. 😔
[Comparisons Expert]
Shehryar Khan, a seasoned PC hardware expert, brings over three years of extensive experience and a deep passion for the world of technology. With a love for building PCs and a genuine enthusiasm for exploring the latest advancements in components, his expertise shines through his work and dedication towards this field. Currently, Shehryar is rocking a custom loop setup for his built.
Get In Touch: shehryar@tech4gamers.com



Feedback By:
Lisa
Chris
Sarah
Kevin
Emma
Michael
Olivia
James
Rachel
Tom