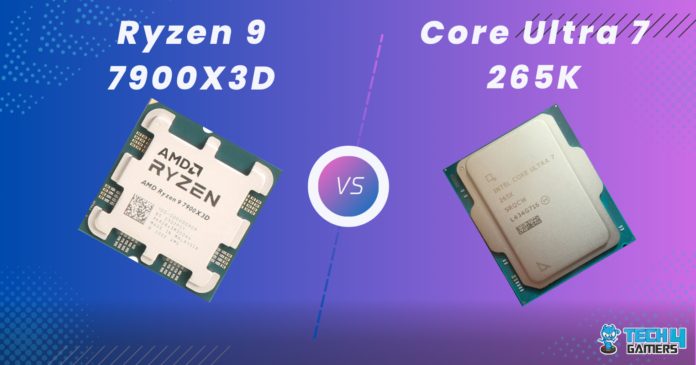
AMD Ryzen 9 7900X3D Rated: 8/10 Intel Core Ultra 7 265K Rated: 7.4/10
Pros And Cons
| CPU | Pros | Cons |
|---|---|---|
| Core Ultra 7 265K | ✅ Has 8 more physical cores ✅ More modern manufacturing process | ❌ Worse in terms of performance |
| Ryzen 9 7900X3D | ✅ Has 100 MB larger L3 cache size ✅ Better in terms of performance | ❌ Much more expensive |
Comparison Table
| Feature | Core Ultra 7 265K | Ryzen 9 7900X3D |
|---|---|---|
| Codename | Arrow Lake | Zen 4 (Raphael) |
| Model number | 265K | - |
| Integrated GPU | Arc Xe2 (Arrow Lake-S) | Radeon Graphics (Ryzen 7000) |
| Transistors | - | 13.1 billions |
| Fabrication Process | 3 nm | 5 nm |
| Socket | FCLGA-1851 | AM5 |
| Best Motherboards | - | BEST Motherboards For Ryzen 9 7900X3D |
| Best CPU Coolers | - | Best CPU Coolers For Ryzen 9 7900X3D |
| Best GPU | - | BEST GPU For Ryzen 9 7900X3D |
Architectural Differences
- Core Count: The Ryzen 9 7900X3D has 12 cores and 24 threads, whereas the Core Ultra 7 265K has 20 cores and 20 threads, made from 8 P-cores and 12 E-cores.
- Clock Speed: The Core Ultra 265K has a base clock of 3.9GHz and a boost clock of 5.4GHz. The 7900X3D has a base clock of 4.4GHz and a boost of up to 5.6GHz.
- Process Node: The newer Intel chip has a 3nm fabrication process, whereas the 7900X3D has a 5nm manufacturing node.
- TDP: AMD’s Ryzen 9 7900X3D has a TDP of 120 watts, whereas the Core Ultra 7 265K has a PL1 TDP of 125 watts.
- Cache: The Ryzen 7900X3D has a whopping 128MB L3 cache, whereas the 265K has an L3 cache of around 30MB.
Intel’s new Core Ultra 7 265K has been a mixed bag. On the one hand, it does improve in power consumption compared to its last-gen counterpart, but it has a slightly worse performance. In the Core Ultra 7 265K Vs Ryzen 9 7900X3D comparison, we will see how these new chips stack up against something more tried and tested.
Gaming Benchmark – 1080p
We’ve got the specs out of the way, so the next thing to see about the Core Ultra 7 265K Vs Ryzen 9 7900X3D is how they perform against each other in games. To do this, we have made a test bench, the specs of which you can read below:
Test Bench
- OS – Windows 11
- CPU Cooler – Enermax LiqMaxFlo 360mm
- Graphics Card – GIGABYTE RTX 4090 Gaming OC 24G
- SSD – XPG Gammix S50 Lite
- Power Supply – be quiet! Dark Power Pro 13 1300W
- Mobo (AMD) – ASRock X870E Taichi Lite
- Mobo (Intel) – MSI MPG Z890 Edge Ti WiFi Review
Star Wars Jedi: Survivor

- Acting out our Jedi fantasies in Star Wars Jedi: Survivor, we saw the Ryzen 9 7900X3D had an average of 200 FPS, which is about 37% higher than the 146 FPS of the 265K.
- The 1% lows showed a difference of about 42%, where the 7900X3D had a performance of 182 FPS, whereas the 265K got a framerate closer to 128 FPS.
The Last Of Us Part 1

- The Ryzen 9 7900X3D had an average framerate of 176 FPS in our testing of The Last Of Us Part 1, whereas the Core Ultra 7 was about 9.6% faster with an average of 193 FPS.
- The 265K won by around 11.5% in our testing, with a framerate of 136 FPS, whereas the Ryzen 9 7900X3D had a framerate of 122 FPS.
Cyberpunk 2077

- The 7900X3D swung back with full force in Cyberpunk, where it had a 20% lead with an average of 177 FPS, whereas the 265K got around 148 FPS on average.
- There was an 18% difference in the minimum framerates, where the 7900X3D hovered around 133 FPS, while the 265K got around 113 FPS.
Hogwarts Legacy

- In Hogwarts Legacy, the 7900X3D had a 19% higher average at 142 FPS, while the Core Ultra had a framerate of around 119 FPS on average in our testing.
- The minimums were surprisingly a hair better on the Core Ultra at 83 FPS instead of the lower 82 FPS that the Ryzen 9 7900X3D scored.
Remnant 2

- The 7900X3D won by around 15% in this test with an average of 135 FPS, whereas the Core Ultra 7 hovered closer to an average of about 117 FPS.
- The 1% lows were about 11% higher on the 7900X3D at about 115 FPS, whereas the 265K hovered closer to about 103 FPS in our testing.
Homeworld 3

- The 7900X3D had an average framerate of 86 FPS, which was only about 2.38% faster than the 84 FPS that the Core Ultra 7 265K had in our test of Homeworld 3.
- The 7900X3D was won by exactly 50% in the 1% lows of Homeworld 3, where it got a framerate of 42 FPS, whereas the 265K got a lower framerate of 28 FPS.
A Plague Tale: Requiem

- The 7900X3D had an average framerate of around 144 FPS in our testing of A Plague Tale: Requiem, whereas the Core Ultra was about 19% behind with an average of 121 FPS.
- The 1% lows went down to around 90 FPS in our testing, which was about 23% higher than the 73 FPS of the Core Ultra 7 265K.
Hitman 3

- The 7900X3D took a loss in the last game of our testing, with a framerate of 247 FPS on average, it was about 3.6% behind the 256 FPS that the 265K had.
- The 1% lows told the same story, where the 7900X3D was 10% behind with its lows of 211 FPS, whereas the Core Ultra 7 265K hovered closer to about 232 FPS.
Productivity Benchmarks
Now that the gaming benchmarks are over, we will go over some productivity benchmarks with both of these chips. The test bench used for the following tests is the same one we used for our gaming benchmarks.
Cinebench R24

- The Ryzen 9 7900X3D had a score of 121 points in the single-core Cinebench test, which was about 20% lower than the 145 points that the Core Ultra 7 265K had.
- The multi-core score was about 35% higher on the Intel chip, which had a score of about 2165 points, while the Ryzen struggled to get around 1605 points.
7-Zip

- The compression score was a bit higher on the Intel chip at about 182 points, instead of the 6.43% lower 182 points that the Ryzen 9 7900X3D.
- The decompression test ran better on the 7900X3D at about 199 points, whereas the Core Ultra 7 265K hovered about 13% lower at around 176 points.
Photoshop

- The Ryzen chip performed about 11% better when we tested Photoshop when compared to the Core Ultra 7 265K.
- The 7900X3D gathered around 10276 points, whereas the Core Ultra 7 265K had about 9246 points in our testing.
Overall Performance
Average Framerate
The 7900X3D had a 10% better performance overall when it came to the average framerates in the games we tested. Only two games ran better on the Core Ultra, and even those did not have a huge margin. The 7900X3D is the clear winner when it comes to gaming performance.
1% Lows
There was only a 9% difference in the 1% lows of both chips. The Ryzen 9 7900X3D did better in some games, whereas the 265K took the lead in about 3 and with a substantial margin. However, the overall experience was noticeably smoother on the Ryzen in most games, so it got a win in this category, too.
Productivity
In Cinebench, the 265K performed better than the Ryzen chip. However, 7-zip and Photoshop ran better on the 7900X3D. The Intel chip won in 3 benchmarks and the 7900X3D won in the equivalent of 3 benchmarks in our testing, so it is safe to call this category a draw.
Power Consumption
| Game | Ryzen 9 7900X3D | Core Ultra 7 265K |
|---|---|---|
| Star Wars Jedi: Survivor | 80 | 123 |
| The Last Of Us Part 1 | 72 | 117 |
| Cyberpunk 2077 | 82 | 131 |
| Hogwarts Legacy | 78 | 115 |
| Remnant 2 | 71 | 120 |
| Homeworld 3 | 85 | 135 |
| A Plague Tale: Requiem | 72 | 122 |
| Hitman 3 | 68 | 125 |
| Average Power Draw | 76⚡ | 123.5⚡ |
| Winner: Ryzen 9 7900X3D | ||
Though the Intel chip has made strides to improve its power efficiency, it does not come close to how the Ryzen 9 7900X3D handles its power management. The 7900X3D took about 39% less power than the Intel chip, making it the clear winner in this regard as well.
Temperatures
| Game | Ryzen 9 7900X3D | Core Ultra 7 265K |
|---|---|---|
| Star Wars Jedi: Survivor | 79 | 68 |
| The Last Of Us Part 1 | 76 | 64 |
| Cyberpunk 2077 | 72 | 66 |
| Hogwarts Legacy | 76 | 78 |
| Remnant 2 | 65 | 67 |
| Homeworld 3 | 63 | 65 |
| A Plague Tale: Requiem | 70 | 68 |
| Hitman 3 | 75 | 76 |
| Average Temperatures | 72🌡️ | 69🌡️ |
| Winner: Core Ultra 7 265K | ||
The 7900X3D ran about 4% hotter in our gaming tests. This difference, though significant, still puts the 7900X3D well within safe thermal ranges. If you have a half-decent cooling solution with either processor, temperatures should not be an issue.
Price And Value
| CPU | Ryzen 9 7900X3D | Core Ultra 7 265K | Price Difference |
|---|---|---|---|
| Launch MSRP | 💲599 | 💲394 | 52.03% |
| Current Price | 💲449 | 💲384 | 16.93% |
As of late November 2024, the Ryzen 9 7900X3D is about $65 more expensive than the Core Ultra 7 265K. This reading uses the used price of the 7900X3D compared to a new 265K. This difference is due to change over time, so do your due diligence before locking into either option.
What We Recommend
Ryzen 9 7900X3D: Though it has better performance than the Core Ultra 7 265K, it also has a noticeably higher price tag. This difference might be made up by the fact that the Ryzen can save you some money over time in your power bills, though this difference is negligible for most consumers.
Core Ultra 7 265K: Though it lost overall, we were impressed that the Core Ultra 7 265K ran some games better than the Ryzen 9 7900X3D. Though its power consumption is nothing to brag about, it is completely adequate for most users and a huge improvement over the previous generation.
The difference between these two chips comes down to your budget. We would recommend you spring for the Ryzen 9 7900X3D if you have the capital for it, whereas the 265K is a slightly more affordable option.
The iGPU on the Core Ultra 7 265K has 512 shading units. The iGPU on the Ryzen 9 7900X3D has 128 shading units. The Core Ultra 7 265K uses PCIe 5.0. The base clock on the E-cores of the Core Ultra 7 265K is about 3.3GHz. The boost clock on the E-cores of the Core Ultra 265K is about 4.6GHz. FAQs
More From Ryzen 9 7900X3D More From Core Ultra 7 265K
Thank you! Please share your positive feedback. 🔋
How could we improve this post? Please Help us. 😔
[Comparisons Specialist]
I’m a passionate computer hardware expert specializing in CPUs and GPUs. With a lifelong curiosity for hardware and extensive hands-on experience, I provide valuable insights, practical advice, and in-depth analysis on these components. Engaging with the hardware community, I exchange knowledge and stay at the forefront of technological advancements.
Get In Touch: uzair@tech4gamers.com



![Ryzen 7 7700X Vs. Ryzen 5 7600X [8 Games Tested] Ryzen 7 7700X Vs Ryzen 5 7600X](https://tech4gamers.com/wp-content/uploads/2022/10/Ryzen-7-7700X-Vs-Ryzen-5-7600X-218x150.jpg)