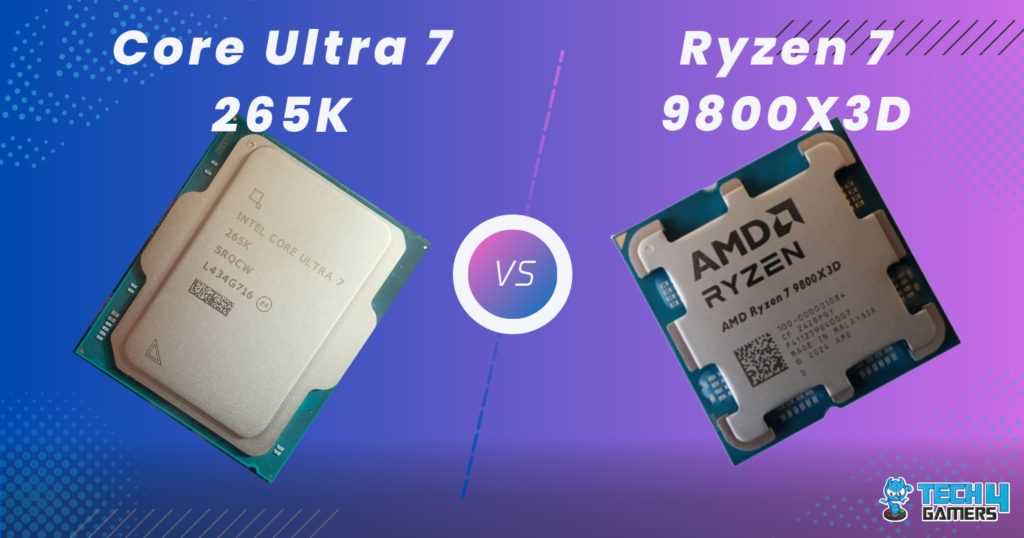
Proces Intel Core Ultra 7 265K Rated: 8.8/10 AMD Ryzen 7 9800X3D Rated: 9.2/10
Pros And Cons
| CPU | Pros | Cons |
|---|---|---|
| Core Ultra 7 265K | ✅ Has 12 more physical cores ✅ Unlocked multiplier | ❌ Worse in terms of performance |
| Ryzen 7 9800X3D | ✅ Has 67MB larger L3 cache size ✅ Better in terms of performance | ❌Much more expensive |
Comparison Table
| Feature | Core Ultra 7 265K | Ryzen 7 9800X3D |
|---|---|---|
| Codename | Arrow Lake | Zen 5 (Granite Ridge) |
| Model number | 265K | - |
| Integrated GPU | Arc Xe2 (Arrow Lake-S) | Radeon Graphics |
| Bus Frequency | 100 MHz | 100 MHz |
| Multiplier | 39x | 47x |
| Fabrication Process | 3 nm | 4 nm |
| Best Motherboards | - | Best Motherboard For Ryzen 7 9800X3D |
| Best CPU Coolers | - | Best CPU Cooler For Ryzen 7 9800X3D |
| Best RAM | - | Best RAM For Ryzen 7 9800X3D |
Architectural Differences
- Core Count: The 9800X3D has 8 cores and 16 threads, which is not far off the 265K’s 20 cores (8 P-Cores, 12 E-Cores) and 20 threads, as one might think at a glance.
- Clock Speed: The 9800X3D has a base clock of 4.7GHz and a boost of up to 5.2GHz, which is different from the 265K’s 3.9GHz base and 5.4GHz boos clocks.
- Cache: The 9800X3D has an excellent 96 MB cache buffer, while the 265K has a much smaller 30 MB buffer.
- TDP: The PL1 TDPs of the Core Ultra 265K and the Ryzen 7 265K are 125 watts and 120 watts, respectively. The 265 K’s PL2 TDP is much higher than the Core Ultra 265K.
- Process Node: The 9800X3D has a 4nm process size, whereas the 265K has a slightly more efficient 3nm fabrication process.
Previously, we compared the Ryzen 7 9800X3D against Intel’s latest and greatest processor, the Core Ultra 285K. In the Ryzen 7 9800X3D vs Core Ultra 7 265K comparison, we will see how AMD’s latest 3D V-Cache processor performs in all metrics that matter compared to something closer to its price range.
Gaming Benchmarks – 1080p
The most important aspect of these CPUs for the average consumer is how they compare against each other in games. To do this, we have put both of them head-to-head against one another using a test bench, the specs of which you can read below:
Test Bench
- OS – Windows 11
- CPU Cooler – Enermax LiqMaxFlo 360mm
- Graphics Card – GIGABYTE RTX 4090 Gaming OC 24G
- SSD – XPG Gammix S50 Lite
- Power Supply – be quiet! Dark Power Pro 13 1300W
- Mobo (AMD) – ASRock X870E Taichi Lite
- Mobo (Intel) – MSI MPG Z890 Edge Ti WiFi Review
Assassin’s Creed: Mirage

- Surprisingly, our AC Mirage test showed very little difference between the two processors. The 9800X3D had an average performance of 177 FPS, which was only 1.14% better than the 265K’s 175 FPS.
- The minimum framerates deviated quite a bit more, with the 9800X3D getting a minimum framerate of 154 FPS, whereas the 265K had a minimum of 132 FPS.
Baldur’s Gate 3

- There was a huge difference between the two chips. The 9800X3D had an average of 217 FPS, whereas the 265K had an average of 128 FPS, which was a difference of around 70%.
- The minimums deviated even further from each other, with the 9800X3D achieving lows of 176 FPS, whereas the 265K dipped to 98 FPS, a difference of around 80%.
Black Myth: Wukong

- Once again, we only saw an 8% difference in this game between the two chips. The 9800X3D had an average framerate of 119 FPS, while the 265K hovered closer to an average of 110 FPS.
- The 1% lows of the 9800X3D were around 68 FPS, whereas the 265K had a minimum framerate of 56 FPS, which was a difference of around 21%.
Cyberpunk 2077

- Our testing of Cyberpunk 2077 showed a difference of around 23%, with the 9800X3D in the lead. The chip had an average of 238 FPS, whereas the 265K had an average closer to 194 FPS.
- The 9800X3D had minimums of around 162 FPS, whereas the 265K had 1% lows closer to 124 FPS, which puts the AMD chip 30% ahead of the Intel processor.
Space Marine 2

- In this War Hammer 40K adaptation, the 9800X3D flew past the Core Ultra with an average of 129 FPS, 92% higher than the 67 FPS that the Intel chip could muster.
- The minimums were around 65 FPS on the 9800X3D, about 67% higher than the 39 FPS of the Core Ultra 7 265K.
Starfield

- We saw about a 12% difference in Starfield’s performance, with the 9800X3D hovering around 258 FPS, whereas the 265K held closer to 230 FPS.
- 1% lows approached 158 FPS on the 9800X3D, which was 19% ahead of the 132 FPS that the 265K had.
World Of Warcraft

- World Of Warcraft enjoyed a 28% performance uplift on the 9800X3D, with the chip getting a framerate of around 272 FPS, while the 265K had a framerate closer to around 212 FPS.
- The uplift in the 1% lows fell to around 22%, with the 9800X3D getting a framerate closer to around 188 FPS, while the 265K held its own at around 154 FPS.
Fortnite

- Finally, for the last game of our testing, we saw a 38% performance gain in Fortnite, with the 9800X3D getting an average of 450 FPS, while the 265K was closer to 325 FPS.
- The difference in the 1% lows was around 43%, with the 9800X3D reaching a minimum of 145 FPS, whereas the Intel processor stuck closer to 101 FPS.
Productivity Benchmarks
Now that we’ve gotten the brutish games testing out, this part of the Ryzen 7 9800X3D vs Core Ultra 7 265K comparison will focus on the productivity benchmarks for these two chips. We will perform these using the same test bench as the gaming tests.
CPU Z

- The single-core test went slightly better on the 265K. It scored 853 points, which was around 9.8% better than the 777 points that the 9800X3D got.
- The multi-core test was a complete bloodbath. The 9800X3D scored around 8722 points, while the 265K was around 79% ahead with a score of 15577 points.
Cinebench

- The Cinebench single-core score was around 28% higher on the 265K, with a score of around 1612 points on the Ryzen, while the Intel chip held around 2060 points.
- The 265K was around 51% better regarding multi-core performance, with a score of 34703 points, while the 9800X3D scored around 23020 points.
Photoshop

- The 9800X3D was around 31% faster in Photoshop because of the extra GPU headroom it freed up, which shows that synthetic benchmarks aren’t the best way to gauge a processor’s performance.
- In our testing, Intel’s chip scored around 8934 points, while the 9800X3D scored around 11734 points, which would make a huge difference in real-world performance.
Overall Performance
Average Framerate
Our games suite for this test showed a couple of GPU-bound games in which the 9800X3D did not provide much of a benefit and some games in which it was miles better. Overall, we saw an almost 30% difference between the performance of the 9800X3D and the 265K, which is a monumental difference.
1% Lows
The difference in the 1% lows was a bit larger, with the 9800X3D being around 33% faster than the Intel chip. This made a noticeable difference when we were playing these games, making the gameplay of the Ryzen chip noticeably smoother.
Productivity Performance
The 9800X3D was behind the 265K in synthetic benchmarks, especially in multi-core performance. However, it took the lead when we tested the Pudget benchmark using Photoshop on both systems. The 9800X3D was around 31% faster because of the extra GPU headroom it provided.
Temperature
| Game | Ryzen 7 9800X3D | Core Ultra 7 265K |
|---|---|---|
| Assassin's Creed: Mirage | 71 | 57 |
| Baldur's Gate 3 | 69 | 65 |
| Black Myth Wukong | 68 | 60 |
| Cyberpunk 2077 | 68 | 66 |
| Space Marine 2 | 65 | 61 |
| Starfield | 72 | 62 |
| World Of Warcraft | 70 | 62 |
| Fortnite | 66 | 65 |
| Average Temperatures | 68.625🌡️ | 62.25🌡️ |
| Winner: Core Ultra 7 265K | ||
Regarding thermals, the 9800X3D got a bit toastier than its rival. It was about 10% hotter while still within safe temperatures. The extra thermal headroom of the 265K is nice, but the 9800X3D is still more than adequate to prevent any heating issues.
Power
| Game | Ryzen 7 9800X3D | Core Ultra 7 265K |
|---|---|---|
| Assassin's Creed: Mirage | 94 | 105 |
| Baldur's Gate 3 | 99 | 111 |
| Black Myth Wukong | 92 | 101 |
| Cyberpunk 2077 | 89 | 108 |
| Space Marine 2 | 98 | 109 |
| Starfield | 99 | 98 |
| World Of Warcraft | 92 | 102 |
| Fortnite | 91 | 105 |
| Average Power Draw | 94.25⚡ | 104.875⚡ |
| Winner: Ryzen 7 9800X3D | ||
The two chips’ power consumption was close, but the 9800X3D was in the lead by around 11% this time. This difference, coupled with the huge gains in performance for the X3D chip, makes it very power-efficient compared to its rival for this comparison.
Price And Value
| CPU | Ryzen 7 9800X3D | Core Ultra 7 265K | Price Difference |
|---|---|---|---|
| Launch MSRP | 💲479 | 💲405 | 18.27% |
| Current Price | 💲479 | 💲384 | 24.74% |
When writing this article, the Core Ultra 7 265K was about 25% or 95 dollars cheaper than the 9800X3D. This roughly matches the difference in performance we’ve seen at 1080p gaming, though the 9800X3D is a bit better value for your dollar.
What We Recommend
Ryzen 7 9800X3D: The difference in performance between these chips and all of its competition is truly remarkable. Though the delta might become smaller with gaming at higher resolutions, the limit to which this chip allows modern GPUs to stretch their legs is astonishing.
Core Ultra 7 265K: Though there is quite a bit of difference in performance between this chip and its rival, it performs adequately for its price. In addition, its productivity performance is also nothing to scoff at. For some users, the Core Ultra 7 265K might be all they need in their gaming/work systems.
We recommend that you get the X3D chip if your system’s heaviest activity is gaming. However, the Core Ultra 7 265K is a good, slightly cheaper processor if your budget does not allow this.
The AMD Ryzen 7 9800X3D uses the AM5 platform. The Intel Core Ultra 265K uses the FCLGA1851 socket. All of the Ryzen 7000 series of chips and the Ryzen 9000 chips use the AM5 platform. As of late November 2024, only the new Core Ultra 200 series of chips uses the FCLGA1851 platform. The 265K can display 8K @60Hz using a Display Port. FAQs
More From Ryzen 7 9800X3D
Thank you! Please share your positive feedback. 🔋
How could we improve this post? Please Help us. 😔
[Comparisons Specialist]
I’m a passionate computer hardware expert specializing in CPUs and GPUs. With a lifelong curiosity for hardware and extensive hands-on experience, I provide valuable insights, practical advice, and in-depth analysis on these components. Engaging with the hardware community, I exchange knowledge and stay at the forefront of technological advancements.
Get In Touch: uzair@tech4gamers.com


![RTX 4080 Super Vs RX 6900 XT [Gaming Benchmarks 2025]](https://tech4gamers.com/wp-content/uploads/2024/03/GPU-Comparison-Template-NEW-218x150.jpg)